Deciding between the hustle and bustle of Dallas, Texas, and the laid-back vibe of the Southwest San Gabriel Valley, California requires consideration of various factors. Each city has unique characteristics that differentiate them from one another. From climate, culture and cost of living to job opportunities, transportation and sports teams, both cities offer diverse blends of amenities and lifestyles. However, personal preferences and lifestyle will play a significant role.
Safety is a crucial factor to consider when planning to move or visit. Dallas has a slightly higher crime rate compared to the national average. The Southwest San Gabriel Valley, on the other hand, boasts a lower crime rate than the national average. While both cities prioritize safety, it's essential to remember that crime occurs everywhere, and it varies from neighborhood to neighborhood.
Cost of Living
Compared to the Southwest San Gabriel Valley, Dallas has a considerably lower cost of living. This includes lower housing costs, utility bills, transportation, and groceries. California, in general, has one of the highest costs of living in America, which may be a crucial consideration for those looking to relocate.
Income Tax
Texas does not have a state income tax, which can benefit individuals and families with high income. In contrast, California has a progressive income tax, with rates ranging from 1% to 13.3%, depending on income level.
Property Tax
Property taxes in Dallas are relatively high, with an average rate of 2.02%. Conversely, property taxes in Southwest San Gabriel Valley are lower, with an average rate of 0.72%.
Sales Tax
Texas has a state sales tax rate of 6.25%, but Dallas adds an additional 2%, making the total sales tax 8.25%. In contrast, the total sales tax in the Southwest San Gabriel Valley is higher, at 9.5%, as California has a state sales tax rate of 7.25%, with local municipalities adding additional rates.
Income
Type
Dallas
Southwest San Gabriel Valley
Estimated median household income
$57,995
$73,720
Estimated per capita income
$38,479
$29,945
Cost of living index (U.S. average is 100)
96.1
161.2
If you make $50,000 in Dallas, you will have to make $83,871 in Southwest San Gabriel Valley to maintain the same standard of living.
Geographical Conditions
Dallas is characterized by flat terrain with few natural lakes and man-made reservoirs. Southwest San Gabriel Valley, on the other hand, lies in a valley surrounded by the San Gabriel Mountains and the Pacific Ocean, offering beautiful mountain and beach landscapes.
Geographical information
Type
Dallas
Southwest San Gabriel Valley
Land area
342.5 sq. miles
35.3 sq. miles
Population density
3,761.4 people per sq. mile
9,252.7 people per sq. mile
Relative area comparison
Dallas, TX Southwest San Gabriel Valley, CA
Education
Both Dallas and Southwest San Gabriel Valley offer access to quality educational resources. Dallas has the second-highest number of public schools in Texas, as well as many private schools and colleges. The Southwest San Gabriel Valley is part of the Los Angeles County and offers access to top-quality public, private schools, and colleges, including the prestigious California Institute of Technology.
Dallas, as a major metropolitan hub, has a booming economy with diverse job opportunities in fields like IT, finance, and healthcare. Conversely, Southwest San Gabriel Valley, being part of the Los Angeles metropolitan area, also offers ample job opportunities. The region is notable for its entertainment, trade, tourism, and fashion industries.
Biggest Employers
Dallas hosts many Fortune 500 companies, including AT&T, ExxonMobil, and Southwest Airlines. Southwest San Gabriel Valley, as part of the Greater Los Angeles area, is home to major employers like The Walt Disney Company, University of Southern California, and Kaiser Permanente.
In Dallas (Dallas County), 57.3% voted for Democrats and 41.8% for Republicans in 2012 Presidential Election. In Southwest San Gabriel Valley (Los Angeles County), 69.7% voted for Democrats and 27.8% for Republicans.
Elections
Type
Democrats
Republicans
Other
Year
Dallas
Southwest San Gabriel Valley
Dallas
Southwest San Gabriel Valley
Dallas
Southwest San Gabriel Valley
2020
65.1%
71.0%
33.4%
26.9%
1.4%
2.1%
2016
60.8%
72.0%
34.7%
22.5%
4.5%
5.5%
2012
57.3%
69.7%
41.8%
27.8%
1.0%
2.4%
2008
57.4%
69.2%
42.0%
28.8%
0.6%
1.9%
2004
49.0%
63.3%
50.4%
35.7%
0.5%
1.0%
2000
45.0%
63.6%
52.7%
32.4%
2.4%
4.0%
1996
46.0%
59.3%
46.8%
31.0%
7.2%
9.7%
Breakdown of population affiliated with a religious congregation
Type
Adherents
Congregations
Religion
Dallas
Southwest San Gabriel Valley
Dallas
Southwest San Gabriel Valley
CATHOLIC CHURCH
18.9%
36.1%
2.4%
4.7%
SOUTHERN BAPTIST CONVENTION
11.0%
1.0%
31.1%
9.0%
MUSLIM ESTIMATE
3.6%
0.7%
1.1%
1.0%
EPISCOPAL CHURCH
1.0%
0.4%
1.5%
1.4%
SEVENTH DAY ADVENTIST CHURCH
0.5%
0.5%
1.7%
2.4%
EVANGELICAL LUTHERAN CHURCH IN AMERICA
0.3%
0.2%
0.9%
1.9%
AMERICAN BAPTIST CHURCHES IN THE USA
0.1%
0.5%
0.2%
3.1%
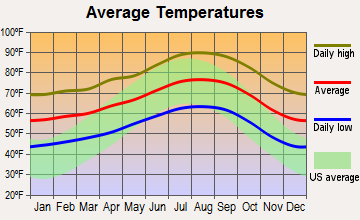
Weather
In Dallas, expect hot, humid summers and mild winters. On the other hand, Southwest San Gabriel Valley has a Mediterranean climate, with mild, wet winters and hot, dry summers. It has more temperate weather than Dallas, resulting in very comfortable living and traveling conditions throughout the year.
Weather and climate
Type
Dallas
Southwest San Gabriel Valley
Temperature - Average
66.6°F
66.3°F
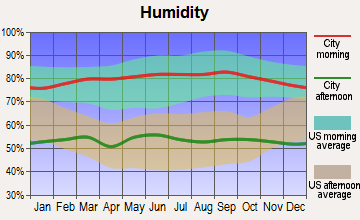
Humidity - Average morning or afternoon humidity
71.3%
61.4%
Humidity - Differences between morning and afternoon humidity
34%
16.5%
Humidity - Maximum monthly morning or afternoon humidity
82%
65.8%
Humidity - Minimum monthly morning or afternoon humidity
48%
49.3%
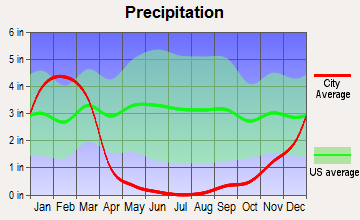
Precipitation - Yearly average
37.3 in
17.6 in
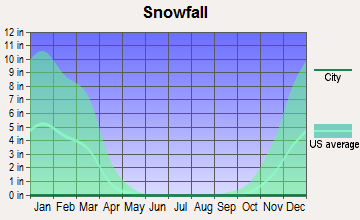
Snowfall - Yearly average
4.2 in
0 in
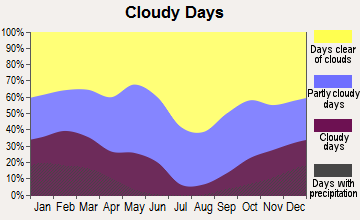
Clouds - Number of days clear of clouds
22.8%
30.1%
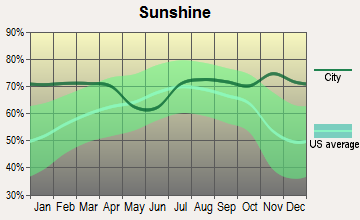
Sunshine amount - Average
66.6%
78.4%
Sunshine amount - Differences during a year
20%
22%
Sunshine amount - Maximum monthly
74%
85%
Sunshine amount - Minimum monthly
54%
63%
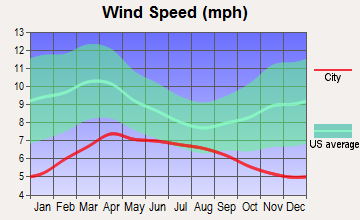
Wind speed - Average
10.3 mph
2.3 mph
Average climate in Dallas, Texas
Average climate in Southwest San Gabriel Valley, California
Air pollution
Type
AQI
CO
NO2
OZONE
PB
PM10
PM25
SO2
Year
Dallas
Southwest San Gabriel Valley
Southwest San Gabriel Valley
Dallas
Southwest San Gabriel Valley
Dallas
Southwest San Gabriel Valley
Dallas
Southwest San Gabriel Valley
Southwest San Gabriel Valley
Dallas
Southwest San Gabriel Valley
Dallas
Southwest San Gabriel Valley
2018
86
140
0.39
N/A
5.7
14.2
28.7
26.6
N/A
0.008
27.5
N/A
9.7
15.1
0.4
0.4
2017
84
142
0.38
N/A
5.5
15.1
28.6
27.8
N/A
0.007
30.2
N/A
9.1
15.3
0.3
0.5
2016
81
128
0.36
N/A
6.1
15.2
27.2
26.5
N/A
0.007
27.8
N/A
8.4
14.3
0.2
0.4
2015
85
137
0.36
N/A
6.5
15.3
26.7
26.7
N/A
0.006
27.6
N/A
8.9
16.4
0.3
0.3
2014
83
138
0.39
N/A
6.3
16.3
27.6
26.8
N/A
0.007
29.9
N/A
9.9
18.0
0.3
0.4
2013
97
140
0.44
N/A
7.3
17.5
28.8
25.2
N/A
0.007
28.3
N/A
13.0
17.0
0.2
0.4
2012
116
144
0.47
N/A
8.6
17.7
31.0
25.0
N/A
0.007
27.6
N/A
12.0
18.1
0.3
0.5
2011
98
142
0.50
N/A
9.4
19.3
30.9
23.6
N/A
0.008
29.8
N/A
11.9
17.6
0.6
0.4
2010
79
128
0.52
N/A
9.4
19.4
28.3
22.9
N/A
0.020
30.0
N/A
N/A
16.3
0.7
0.5
2009
88
150
0.43
N/A
9.2
21.5
28.8
23.5
N/A
0.011
40.0
N/A
N/A
18.0
0.5
0.5
2008
88
152
0.53
N/A
9.8
23.5
29.2
22.8
0.121
0.014
39.1
N/A
N/A
18.3
0.5
0.6
2007
94
128
0.58
N/A
11.0
24.2
25.7
21.8
0.070
0.017
N/A
N/A
N/A
N/A
0.3
1.1
2006
107
125
0.63
N/A
10.8
24.6
30.6
22.1
0.106
0.009
N/A
N/A
N/A
N/A
0.7
1.7
2005
108
123
0.66
N/A
13.0
25.6
29.7
20.5
0.142
0.015
N/A
N/A
11.0
N/A
0.9
2.1
2004
96
132
0.77
N/A
12.3
27.7
26.0
22.9
0.099
0.019
N/A
N/A
N/A
N/A
0.8
2.4
2003
102
143
0.98
N/A
13.6
31.8
27.1
22.0
0.121
0.027
N/A
N/A
N/A
N/A
1.0
1.8
2002
100
137
1.00
N/A
14.0
33.0
25.2
21.1
0.080
0.025
N/A
N/A
N/A
N/A
0.4
2.4
2001
100
143
1.11
N/A
14.3
34.2
26.0
18.9
0.069
0.039
N/A
N/A
N/A
N/A
1.0
2.4
2000
109
147
1.12
N/A
14.5
33.4
27.0
18.9
0.092
0.033
N/A
N/A
N/A
N/A
1.1
1.4
Natural disasters
Type
Dallas
Southwest San Gabriel Valley
Tornado activity compared to U.S. average
254.7%
18%
Earthquake activity compared to U.S. average
567%
7,182.3%
Natural disasters compared to U.S. average
21%
57%
Transportation
Dallas has an extensive public transit system, including buses, light rail, and commuter train service. Traffic can be heavy during peak times. Southwest San Gabriel Valley benefits from being part of the Los Angeles metropolitan area, with access to an extensive public transit system, including buses and light rail. However, like Dallas, traffic congestion can be a concern.
Transport
Type
Dallas
Southwest San Gabriel Valley
Amtrak stations
1
0
Amtrak stations nearby
1
3
FAA registered aircraft
2
0
FAA registered aircraft manufacturers and dealers
56
0
Means of transportation to work
Type
Dallas
Southwest San Gabriel Valley
Bicycle
0.3%
0.5%
Bus
1.4%
4.7%
Carpooled
10.9%
16.1%
Car alone
83.9%
73%
Railroad
0.2%
0%
Subway
0.2%
0%
Taxicab
0.1%
0%
Walked
1.6%
2.5%
Average travel time to work
Type
Dallas
Southwest San Gabriel Valley
Average
31.5 min
29.1 min
Real Estate
The real estate market in Dallas is more affordable than in Southwest San Gabriel Valley. Dallas has a mix of condominiums, single-family homes, and apartment buildings. In contrast, housing in the Southwest San Gabriel Valley is pricey, reflecting California's high cost of living.
Neighborhoods
Both Dallas and Southwest San Gabriel Valley offer a range of neighborhoods catering to different lifestyles. Dallas has vibrant areas like Deep Ellum, known for its nightlife, and Bishop Arts District, known for its indie scene. Southwest San Gabriel Valley has a mix of suburban and urban neighborhoods offering diverse housing and lifestyle options.
Houses and residents
Type
Dallas
Southwest San Gabriel Valley
Houses
591,773
102,656
Average household size (people)
2.6
3.1
Houses occupied
536,008 (90.6%)
99,543 (97%)
Houses occupied by owners
229,518 (42.8%)
47,333 (47.6%)
Houses occupied by renters
306,490 (57.2%)
52,210 (52.5%)
Median rent asked for vacant for-rent units
$1,403
$1,828
Median price asked for vacant for-sale houses and condos
$574,934
$1,138,428
Estimated median house or condo value
$267,600
$723,161
Median number of rooms in apartments
3.7
3.7
Median number of rooms in houses and condos
6.1
5.9
Renting percentage
55.9%
51.7%
Housing density (houses/condos per square mile)
1,727.6
2,909.6
Household income disparities
48.2%
44%
Housing units without a mortgage
1,309 (1%)
13,166 (31.1%)
Housing units with both a second mortgage and home equity loan
3,320 (2.6%)
88 (0.2%)
Housing units with a mortgage
124,846 (99%)
29,118 (68.9%)
Housing units with a home equity loan
204 (0.2%)
2,557 (6%)
Housing units with a second mortgage
5,351 (4.2%)
2,975 (7%)
Housing units lacking complete kitchen facilities
1.2%
1.5%
Housing units lacking complete plumbing facilities
Self-employed workers in own not incorporated business
43,703
8,660
State government workers
17,325
4,158
Unpaid family workers
754
639
Industries and Occupations
Dallas is home to various industries, including telecommunications, technology, defense, financial services and medical research. In comparison, Southwest San Gabriel Valley has a diversified economy centered around entertainment, international trade, technology, design, and fashion.
Dallas offers excellent healthcare facilities with many highly-rated hospitals. Southwest San Gabriel Valley residents also have access to excellent healthcare, being near some of the nation's top hospitals in Los Angeles.
Health (county statistics)
Type
Dallas
Southwest San Gabriel Valley
General health status score of residents in this county from 1 (poor) to 5 (excellent)
Dallas comes equipped with modern, robust infrastructure, including roads, airports, and public facilities. The Southwest San Gabriel Valley also boasts strong infrastructure support from Los Angeles county, including freeways, public utilities, and other public amenities.
Infrastructure
Type
Dallas
Southwest San Gabriel Valley
TV stations
25
26
Culture and Food
Dallas offers a vibrant cultural scene, with a mix of Southwestern and Mexican influences. It is famous for its barbecue, Tex-Mex cuisine, and live music. In contrast, in Southwest San Gabriel Valley, you'll find a diverse mix of cultures and cuisines, with a strong influence of Asian and Hispanic cultures. There's also a higher concentration of vegetarian and vegan restaurants.
Sports Teams
Sports enthusiasts will find plenty to cheer about in both cities. Dallas is home to renowned teams like the Dallas Cowboys (NFL), Dallas Mavericks (NBA), and Texas Rangers (MLB). In the Southwest San Gabriel Valley, residents can root for Los Angeles teams such as the Lakers (NBA), Dodgers (MLB), and Rams (NFL).
 Dallas, TX
 Southwest San Gabriel Valley, CA