Dallas, Texas, and Tucson, Arizona, while both located in the Southwestern United States, offer distinctively different living experiences. Dallas, the third-largest city in Texas, exudes a cosmopolitan vibe with its booming economy and diverse industries. Tucson, on the other hand, is known for its natural beauty, outdoor activities, and relaxed lifestyle. The choice between the two would come down to personal preferences such as weather, job prospects, cost of living, and the general lifestyle one prefers.
Distance between
Dallas, TX and
Tucson, AZ : 823.7 miles
Dallas's population is larger by 137%. Its population has grown by 99,877 people (8.4%) since 2000. The population of Tucson has grown by 56,543 people (11.6%) during that time.
On the crime front, both cities experience their fair share, but Tucson generally has a higher crime rate compared to Dallas. However, the crime rate can vary greatly based on the neighborhood. Both cities offer numerous safe and family-friendly neighborhoods. It's always advisable to research and visit a neighborhood before making a decision to move or visit.
City-data.com crime index counts serious crimes and violent crime more heavily. It adjusts for the number of visitors and daily workers commuting into cities. (higher means more crime, U.S. average = 301.1)
City-data.com crime index counts serious crimes and violent crime more heavily. It adjusts for the number of visitors and daily workers commuting into cities. (higher means more crime, U.S. average = 301.1)
Sex Offenders
According to our data, there are 4,297 registered sex offenders living in Dallas and 1,383 registered sex offenders living in . The ratio of residents to sex offenders in Dallas is 307 to 1; the ratio in Tucson is 384 to 1. The number of registered sex offenders compared to the number of residents is larger in Dallas than in Tucson.
Cost of Living
The cost of living is lower in Tucson than in Dallas. Housing tends to be more affordable in Tucson, and residents also save money on essentials like groceries and healthcare. However, Dallas offers a higher earning potential due to its more diverse economy.
Income Tax
Texas doesn't have a state income tax, which benefits Dallas residents. However, Arizona does have a state income tax, which applies to Tucson residents.
Property Tax
Property taxes are comparably high in both cities, but they tend to be higher in Dallas due to the higher property values.
Sales Tax
Both Dallas and Tucson have city and state sales taxes. However, Dallas residents enjoy a no-income-tax policy in Texas, while Tucson residents are subjected to Arizona's income tax.
Income
Type
Dallas
Tucson
Estimated median household income
$57,995
$50,306
Estimated per capita income
$38,479
$27,821
Cost of living index (U.S. average is 100)
96.1
90.1
If you make $50,000 in Tucson, you will have to make $53,330 in Dallas to maintain the same standard of living.
Geographical Conditions
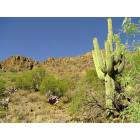
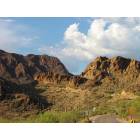
Dallas sits on the flat coastal plain of Texas, while Tucson is situated in the Sonoran Desert surrounded by beautiful mountain ranges. This makes Tucson a popular destination for outdoor activities like hiking and biking.
Both Dallas and Tucson offer numerous public and private education options, from elementary schools to higher education. Dallas has the advantage of having more institutions, while in Tucson, the University of Arizona is a significant contributor to the local economy and culture.
Dallas has a robust and diverse economy, with industries ranging from technology and finance to healthcare and defense. Tucson, while less diversified, has a robust presence of defense and technology companies, supported by the University of Arizona.
Biggest Employers
In Dallas, some of the biggest employers include AT&T, American Airlines, and Texas Health Resources. In Tucson, The University of Arizona, Raytheon Missile Systems, and the federal government are among the biggest employers.
There were 2,245 building permits issued in Dallas in 2012 (1436 more than in 2011) compared to 1,134 building permits issued in Tucson in 2012 (832 more than in 2011).
In Dallas (Dallas County), 57.3% voted for Democrats and 41.8% for Republicans in 2012 Presidential Election. In Tucson (Pima County), 52.7% voted for Democrats and 45.7% for Republicans.
Elections
Type
Democrats
Republicans
Other
Year
Dallas
Tucson
Dallas
Tucson
Dallas
Tucson
2020
65.1%
58.4%
33.4%
39.8%
1.4%
1.7%
2016
60.8%
53.3%
34.7%
39.7%
4.5%
7.0%
2012
57.3%
52.7%
41.8%
45.7%
1.0%
1.6%
2008
57.4%
52.4%
42.0%
46.3%
0.6%
1.4%
2004
49.0%
52.7%
50.4%
46.7%
0.5%
0.6%
2000
45.0%
51.4%
52.7%
43.3%
2.4%
5.3%
1996
46.0%
52.2%
46.8%
39.4%
7.2%
8.5%
Breakdown of population affiliated with a religious congregation
Type
Adherents
Congregations
Religion
Dallas
Tucson
Dallas
Tucson
CATHOLIC CHURCH
18.9%
20.8%
2.4%
7.9%
SOUTHERN BAPTIST CONVENTION
11.0%
2.3%
31.1%
10.4%
MUSLIM ESTIMATE
3.6%
0.0%
1.1%
0.2%
EPISCOPAL CHURCH
1.0%
0.8%
1.5%
1.4%
SEVENTH DAY ADVENTIST CHURCH
0.5%
0.3%
1.7%
1.9%
EVANGELICAL LUTHERAN CHURCH IN AMERICA
0.3%
0.9%
0.9%
2.5%
LUTHERAN CHURCH
0.3%
0.4%
0.7%
1.4%
Weather
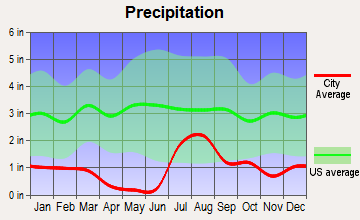
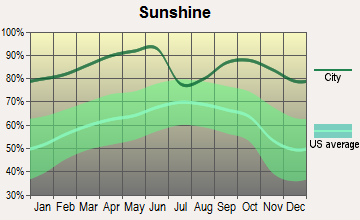
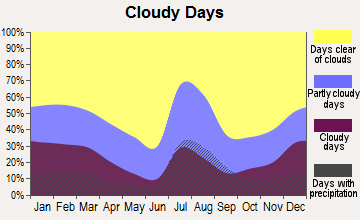
Dallas enjoys a humid subtropical climate, with hot, humid summers and mild winters. It's ideal for those who enjoy all four seasons but without extreme winter conditions. Tucson, conversely, has a hot desert climate with scorching summers and mild winters, suitable for those who prefer lots of sunshine and less rainfall.
Weather and climate
Type
Dallas
Tucson
Temperature - Average
66.6°F
70°F
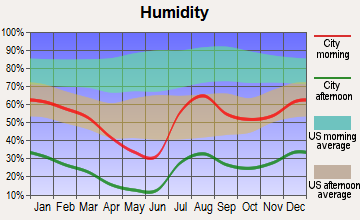
Humidity - Average morning or afternoon humidity
71.3%
38.6%
Humidity - Differences between morning and afternoon humidity
34%
46%
Humidity - Maximum monthly morning or afternoon humidity
82%
58%
Humidity - Minimum monthly morning or afternoon humidity
48%
12%
Precipitation - Yearly average
37.3 in
12 in
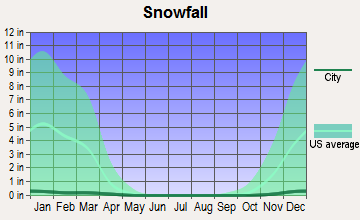
Snowfall - Yearly average
4.2 in
2 in
Clouds - Number of days clear of clouds
22.8%
32.3%
Sunshine amount - Average
66.6%
92.8%
Sunshine amount - Differences during a year
20%
15%
Sunshine amount - Maximum monthly
74%
94%
Sunshine amount - Minimum monthly
54%
79%
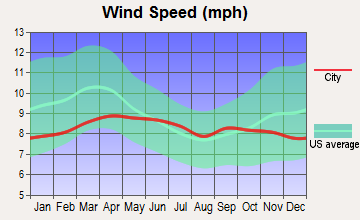
Wind speed - Average
10.3 mph
8.3 mph
Average climate in Dallas, Texas
Average climate in Tucson, Arizona
Air pollution
Type
AQI
CO
NO2
OZONE
PB
PM10
PM25
SO2
Year
Dallas
Tucson
Tucson
Dallas
Tucson
Dallas
Tucson
Dallas
Tucson
Dallas
Tucson
Dallas
Tucson
2018
86
87
0.19
N/A
5.7
8.3
28.7
32.0
N/A
N/A
29.9
N/A
9.7
5.5
0.4
0.1
2017
84
73
0.18
N/A
5.5
8.4
28.6
31.7
N/A
N/A
32.2
N/A
9.1
7.1
0.3
0.1
2016
81
68
0.21
N/A
6.1
7.9
27.2
29.7
N/A
N/A
25.3
N/A
8.4
4.5
0.2
0.1
2015
85
62
0.21
N/A
6.5
8.7
26.7
29.7
N/A
N/A
25.4
N/A
8.9
5.1
0.3
0.2
2014
83
74
0.19
N/A
6.3
10.0
27.6
28.8
N/A
N/A
28.0
N/A
9.9
5.6
0.3
0.2
2013
97
94
0.17
N/A
7.3
10.4
28.8
30.4
N/A
N/A
30.9
N/A
13.0
6.8
0.2
0.2
2012
116
73
0.20
N/A
8.6
11.8
31.0
30.0
N/A
N/A
31.2
N/A
12.0
5.6
0.3
0.2
2011
98
81
0.22
N/A
9.4
11.9
30.9
31.0
N/A
N/A
29.7
N/A
11.9
5.8
0.6
0.3
2010
79
68
0.29
N/A
9.4
10.8
28.3
30.5
N/A
N/A
25.5
N/A
N/A
N/A
0.7
0.5
2009
88
82
0.25
N/A
9.2
11.2
28.8
29.2
N/A
N/A
31.9
N/A
N/A
N/A
0.5
0.5
2008
88
81
0.29
N/A
9.8
12.2
29.2
29.2
0.121
N/A
32.0
N/A
N/A
N/A
0.5
0.9
2007
94
75
0.37
N/A
11.0
13.4
25.7
28.7
0.070
N/A
27.3
N/A
N/A
N/A
0.3
0.9
2006
107
74
0.41
N/A
10.8
15.3
30.6
27.7
0.106
N/A
17.3
N/A
N/A
N/A
0.7
0.6
2005
108
76
0.43
N/A
13.0
15.1
29.7
26.0
0.142
N/A
17.8
N/A
11.0
N/A
0.9
0.7
2004
96
77
0.49
N/A
12.3
15.6
26.0
25.6
0.099
N/A
14.0
N/A
N/A
N/A
0.8
1.2
2003
102
81
0.57
N/A
13.6
17.2
27.1
27.1
0.121
N/A
19.2
N/A
N/A
N/A
1.0
1.2
2002
100
76
0.56
N/A
14.0
16.9
25.2
26.8
0.080
N/A
19.9
N/A
N/A
N/A
0.4
1.0
2001
100
70
0.55
N/A
14.3
16.4
26.0
26.1
0.069
N/A
23.2
N/A
N/A
N/A
1.0
0.8
2000
109
78
0.50
N/A
14.5
16.7
27.0
26.4
0.092
N/A
N/A
N/A
N/A
N/A
1.1
2.3
Natural disasters
Type
Dallas
Tucson
Tornado activity compared to U.S. average
254.7%
8.9%
Earthquake activity compared to U.S. average
567%
1,584.9%
Natural disasters compared to U.S. average
21%
13%
Transportation
Dallas offers solid public transportation options with its DART system, though many residents still prefer to drive. Tucson has a less comprehensive public transportation but is more walkable and bike-friendly compared to Dallas.
Transport
Type
Dallas
Tucson
Amtrak stations
1
1
Amtrak stations nearby
1
1
FAA registered aircraft
2
983
FAA registered aircraft manufacturers and dealers
56
14
Means of transportation to work
Type
Dallas
Tucson
Bicycle
0.3%
1%
Bus
1.4%
1.9%
Carpooled
10.9%
11.5%
Car alone
83.9%
81.9%
Motorcycle
0%
0.5%
Railroad
0.2%
0%
Subway
0.2%
0%
Taxicab
0.1%
0.1%
Walked
1.6%
2.3%
Average travel time to work
Type
Dallas
Tucson
Average
31.5 min
26 min
Other means
26.5 min
21.6 min
Public transportation
46 min
42.5 min
Private vehicle occupancy
Type
Dallas
Tucson
Average
1.2
1.2
Drove alone
86.8%
86.3%
In 2 person carpool
9%
10.1%
In 3 person carpool
2.6%
2.5%
In 4 person carpool
0.9%
1%
In 5-6 person carpool
0.5%
0.1%
In 7+ person carpool
0.2%
0.1%
How many people usually rode to work in the car, truck or van.
Real Estate
Dallas has a higher real estate cost compared to Tucson, but also offers a larger variety in terms of housing styles, from urban lofts to suburban single-family homes. Tucson's real estate market is more affordable, offering mostly single-family homes.
Neighborhoods
Dallas neighborhoods range from the upscale Uptown and Highland Park areas to the funky Deep Ellum district. Tucson offers a laid-back vibe with neighborhoods like Sam Hughes known for its historic homes or El Presidio featuring charming adobe houses.
Houses and residents
Type
Dallas
Tucson
Houses
591,773
242,816
Average household size (people)
2.6
2.4
Median year apartment built
1987
1979
Median year house/condo built
1969
1978
Length of stay in the house since moving in
13.9 years
13.2 years
Houses occupied
536,008 (90.6%)
223,068 (91.9%)
Houses occupied by owners
229,518 (42.8%)
114,708 (51.4%)
Houses occupied by renters
306,490 (57.2%)
108,360 (48.6%)
Median rent asked for vacant for-rent units
$1,403
$801.80
Median monthly housing costs
$1,225
$951
Median price asked for vacant for-sale houses and condos
$574,934
$557,132
Estimated median house or condo value
$267,600
$224,800
Median numbers of rooms
4.6
4.9
Median number of rooms in apartments
3.7
4
Median number of rooms in houses and condos
6.1
5.8
Median house price - detached houses
$410,272
$262,219
Median house price - in 2-unit structures
$255,160
$147,793
Median house price - in 3-to-4-unit structures
$230,927
$125,313
Median house price - in 5 or more unit structures
$444,589
$135,055
Median house price - mobile homes
$91,039
$48,136
Median house price - Townhouses or other attached units
$350,045
$210,375
Median house price - All housing units
$402,215
$234,849
Median house age
40
43
Renting percentage
55.9%
48.1%
Housing density (houses/condos per square mile)
1,727.6
1,247.3
House value disparities
41.3%
32.8%
Household income disparities
48.2%
44.9%
Median household income for houses/condes with a mortgage
$103,798
$76,356
Median household income for apartments without a mortgage
$61,909
$54,612
Housing units without a mortgage
1,309 (1%)
1,087 (1.5%)
Housing units with both a second mortgage and home equity loan
3,320 (2.6%)
2,785 (3.9%)
Housing units with a mortgage
124,846 (99%)
70,054 (98.5%)
Housing units with a home equity loan
204 (0.2%)
211 (0.3%)
Housing units with a second mortgage
5,351 (4.2%)
4,051 (5.7%)
House/condo owner moved in on average (years ago)
12
11
House/condo renter moved in on average (years ago)
1
1
Housing units lacking complete kitchen facilities
1.2%
1.2%
Housing units lacking complete plumbing facilities
0.9%
0.8%
Housing units in structures
Housing units in structures
Dallas
Tucson
One, detached
41.8%
53.5%
One, attached
4.3%
8.3%
Two
1.5%
2.5%
3 or 4
4.9%
4.3%
5 to 9
7.9%
5.0%
10 to 19
12.1%
5.6%
20 to 49
8.1%
5.8%
50 or more
18.4%
8.6%
Mobile homes
1.0%
6.2%
Boats, RVs, vans, etc.
0.0%
0.2%
Median real estate property taxes paid for housing units
Self-employed workers in own not incorporated business
43,703
14,487
State government workers
17,325
17,981
Unpaid family workers
754
709
Industries and Occupations
Dallas is home to many Fortune 500 companies and offers occupations in financial services, information technology, and healthcare. Tucson's economy heavily relies on education, healthcare, and public administration, but also offers opportunities in aerospace and defense sectors.
Both Dallas and Tucson offer high-quality healthcare with numerous hospitals and clinics. Dallas is home to a major medical district while Tucson's medical scene is anchored by the University of Arizona's medical school.
Health (county statistics)
Type
Dallas
Tucson
General health status score of residents in this county from 1 (poor) to 5 (excellent)
Dallas, being a larger city, has more developed infrastructure, including tall skyscrapers, numerous highways, and a prominent airport. Tucson's infrastructure is less dense, with a stronger focus on preserving its natural beauty and historical sites.
Infrastructure
Type
Dallas
Tucson
Hospitals
74
24
TV stations
25
20
Arenas or stadiums
2
2
Bank branches located here
394
159
Bank institutions located here
80
17
Main business address for public companies
122
6
Drinking water stations with no reported violations in the past
8
0
Drinking water stations with reported violations in the past
HMDA - Conventional home purchase loans - Applications denied
Year
Dallas
Tucson
1999
5,030
3,131
2000
3,390
1,601
2001
2,626
912
2002
2,657
778
2003
3,617
1,409
2004
5,460
2,041
2005
7,445
2,872
2006
7,397
2,833
2007
5,056
1,601
2008
2,200
714
2009
1,121
386
Culture and Food
Dallas offers a blend of Southern and Mexican cultures, which reflects in its food, particularly in its array of barbecue and Tex-Mex restaurants. Tucson, a UNESCO City of Gastronomy, offers a unique blend of Native American, Spanish, Mexican, and Anglo-American influences in its cuisine.
Sports Teams
Dallas is a major sports hub with teams like the Dallas Cowboys (NFL), Dallas Mavericks (NBA), and Texas Rangers (MLB). Tucson, while not having its own major league teams, has a strong college sports scene thanks to the University of Arizona.


 Dallas, TX
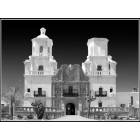
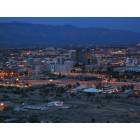
 Tucson, AZ