Dallas, Texas, and Urban Honolulu, Hawaii, offer different lifestyle experiences according to their unique geographical and cultural characteristics. Each city presents a unique blend of opportunities and challenges, making them appealing to different demographics for relocation or tourism. Factors such as weather, cost of living, education, employer base, and tax regimes significantly influence city choices. Furthermore, the distinctive food culture, sports teams, and healthcare facilities play crucial roles in shaping life in these cities.
Dallas, Texas, has a higher crime rate compared to Urban Honolulu, Hawaii. Tourists and new residents need to research and understand various neighborhoods and their safety levels. Honolulu, on the other hand, offers a safer environment, generally speaking, which may provide peace of mind for residents and tourists alike.
Cost of Living
Cost of living in Dallas is significantly lower than in Urban Honolulu, making Dallas more affordable regarding housing, groceries, and general expenses. Urban Honolulu’s high cost of living is related to its isolated geographic location and the extra costs associated with importing goods.
Income Tax
Texas is one of the states without an income tax, which favors Dallas residents. In comparison, Hawaii has an income tax that can go up to 11%, which is among the highest in the nation.
Property Tax
Property taxes in Dallas are relatively high, while in Honolulu, property tax rates are quite low but are offset by high property values.
Sales Tax
Sales tax in Dallas is 8.25%, while Urban Honolulu has a General Excise Tax (GET) of 4.5%. The lower GET in Honolulu applies to all goods and services, resulting in a broader tax base.
Income
Type
Dallas
Urban Honolulu
Estimated median household income
$57,995
$90,704
Estimated per capita income
$38,479
$39,573
Cost of living index (U.S. average is 100)
96.1
128.3
If you make $50,000 in Dallas, you will have to make $66,753 in Urban Honolulu to maintain the same standard of living.
Geographical Conditions
Dallas, located on the southern plains, features a flat, sprawling landscape, while Urban Honolulu is renowned for its picturesque coastline and mountainous terrain, encapsulated by the Pacific Ocean on all sides.
Both cities offer quality education, but Dallas' school district, with diverse program offerings and a large selection of private schools, may offer more choices than Honolulu’s smaller district. Colleges in Dallas include Southern Methodist University and University of Texas, while Honolulu hosts the University of Hawaii.
Dallas has a robust economy with sectors including defense, financial services, IT, and telecommunications thriving. In comparison, Honolulu's economy leans towards tourism, healthcare, and defense. While Dallas might offer more diverse job opportunities, Honolulu offers jobs tied closely to its unique geographic location.
Biggest Employers
Dallas’s biggest employers include AT&T, American Airlines, and Bank of America. In Urban Honolulu, the Department of Defense, University of Hawaii, and State of Hawaii are among the largest employers.
In Dallas (Dallas County), 57.3% voted for Democrats and 41.8% for Republicans in 2012 Presidential Election. In Urban Honolulu (Honolulu County), 68.9% voted for Democrats and 29.8% for Republicans.
Elections
Type
Democrats
Republicans
Other
Year
Dallas
Urban Honolulu
Dallas
Urban Honolulu
Dallas
Urban Honolulu
2020
65.1%
62.7%
33.4%
35.8%
1.4%
1.5%
2016
60.8%
61.5%
34.7%
31.6%
4.5%
6.9%
2012
57.3%
68.9%
41.8%
29.8%
1.0%
1.3%
2008
57.4%
70.1%
42.0%
28.8%
0.6%
1.1%
2004
49.0%
51.1%
50.4%
48.3%
0.5%
0.6%
2000
45.0%
54.6%
52.7%
39.6%
2.4%
5.7%
1996
46.0%
56.3%
46.8%
33.6%
7.2%
10.1%
Breakdown of population affiliated with a religious congregation
Type
Adherents
Congregations
Religion
Dallas
Urban Honolulu
Dallas
Urban Honolulu
CATHOLIC CHURCH
18.9%
18.2%
2.4%
5.2%
SOUTHERN BAPTIST CONVENTION
11.0%
1.5%
31.1%
9.7%
MUSLIM ESTIMATE
3.6%
0.0%
1.1%
0.1%
EPISCOPAL CHURCH
1.0%
0.5%
1.5%
2.7%
SEVENTH DAY ADVENTIST CHURCH
0.5%
0.5%
1.7%
2.6%
EVANGELICAL LUTHERAN CHURCH IN AMERICA
0.3%
0.2%
0.9%
1.1%
Weather
Dallas experiences a humid subtropical climate, characterized by hot, humid summers and mild winters, while Urban Honolulu has a tropical rainforest climate with warm temperatures all year round. This difference may appeal to those who prefer consistent warmth like Honolulu offers or more seasonal change, as found in Dallas.
Weather and climate
Type
Dallas
Urban Honolulu
Temperature - Average
66.6°F
74.7°F
Humidity - Average morning or afternoon humidity
71.3%
70.5%
Humidity - Differences between morning and afternoon humidity
34%
27%
Humidity - Maximum monthly morning or afternoon humidity
82%
79%
Humidity - Minimum monthly morning or afternoon humidity
48%
52%
Precipitation - Yearly average
37.3 in
58.7 in
Snowfall - Yearly average
4.2 in
0 in
Clouds - Number of days clear of clouds
22.8%
14.9%
Sunshine amount - Average
66.6%
71%
Sunshine amount - Differences during a year
20%
19%
Sunshine amount - Maximum monthly
74%
75%
Sunshine amount - Minimum monthly
54%
56%
Wind speed - Average
10.3 mph
11.1 mph
Average climate in Dallas, Texas
Air pollution
Type
AQI
CO
NO2
OZONE
PB
PM10
PM25
SO2
Year
Dallas
Urban Honolulu
Urban Honolulu
Dallas
Urban Honolulu
Dallas
Urban Honolulu
Dallas
Urban Honolulu
Urban Honolulu
Dallas
Urban Honolulu
Dallas
Urban Honolulu
2018
86
43
0.44
N/A
5.7
3.9
28.7
25.8
N/A
N/A
12.8
N/A
9.7
3.8
0.4
0.1
2017
84
46
0.49
N/A
5.5
4.4
28.6
24.8
N/A
N/A
11.9
N/A
9.1
3.5
0.3
0.4
2016
81
46
0.59
N/A
6.1
3.9
27.2
24.8
N/A
N/A
13.7
N/A
8.4
3.2
0.2
0.3
2015
85
53
0.53
N/A
6.5
3.5
26.7
24.0
N/A
N/A
11.7
N/A
8.9
4.5
0.3
0.4
2014
83
45
0.41
N/A
6.3
3.4
27.6
21.6
N/A
N/A
13.3
N/A
9.9
4.6
0.3
1.2
2013
97
53
0.41
N/A
7.3
3.0
28.8
26.4
N/A
N/A
12.0
N/A
13.0
5.6
0.2
1.1
2012
116
58
0.32
N/A
8.6
2.9
31.0
24.7
N/A
N/A
12.4
N/A
12.0
5.6
0.3
0.6
2011
98
57
0.38
N/A
9.4
2.9
30.9
28.4
N/A
N/A
12.8
N/A
11.9
6.1
0.6
0.6
2010
79
68
0.38
N/A
9.4
3.4
28.3
N/A
N/A
0.002
N/A
N/A
N/A
5.9
0.7
1.1
2009
88
58
0.42
N/A
9.2
4.3
28.8
N/A
N/A
0.003
N/A
N/A
N/A
5.8
0.5
0.7
2008
88
19
0.45
N/A
9.8
4.2
29.2
N/A
0.121
0.002
N/A
N/A
N/A
N/A
0.5
0.6
2007
94
23
0.52
N/A
11.0
4.7
25.7
N/A
0.070
0.001
N/A
N/A
N/A
N/A
0.3
0.5
2006
107
21
0.24
N/A
10.8
4.9
30.6
N/A
0.106
0.003
N/A
N/A
N/A
N/A
0.7
1.1
2005
108
19
0.42
N/A
13.0
5.0
29.7
N/A
0.142
0.001
N/A
N/A
11.0
N/A
0.9
0.7
2004
96
18
0.60
N/A
12.3
4.8
26.0
N/A
0.099
0.001
N/A
N/A
N/A
N/A
0.8
0.5
2003
102
21
0.62
N/A
13.6
4.7
27.1
N/A
0.121
0.002
N/A
N/A
N/A
N/A
1.0
0.5
2002
100
19
0.64
N/A
14.0
4.9
25.2
N/A
0.080
N/A
N/A
N/A
N/A
N/A
0.4
0.9
2001
100
21
0.62
N/A
14.3
4.5
26.0
N/A
0.069
N/A
N/A
N/A
N/A
N/A
1.0
0.7
2000
109
21
0.68
N/A
14.5
4.9
27.0
N/A
0.092
N/A
N/A
N/A
N/A
N/A
1.1
0.4
Natural disasters
Type
Dallas
Urban Honolulu
Tornado activity compared to U.S. average
254.7%
3.7%
Earthquake activity compared to U.S. average
567%
1,250.1%
Natural disasters compared to U.S. average
21%
16%
Transportation
Dallas offers a well-connected public transit system, including a light rail and buses, and is also car-friendly. Urban Honolulu has a bus system, and a new rail system is also under development. However, traffic in Honolulu can be problematic and commuting times can be long.
Transport
Type
Dallas
Urban Honolulu
Amtrak stations
1
0
Amtrak stations nearby
1
0
FAA registered aircraft
2
0
FAA registered aircraft manufacturers and dealers
56
0
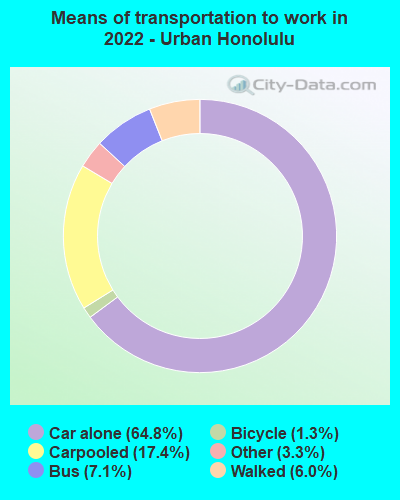
Means of transportation to work
Type
Dallas
Urban Honolulu
Bicycle
0.3%
0.9%
Bus
1.4%
6.3%
Carpooled
10.9%
15.5%
Car alone
83.9%
69.3%
Railroad
0.2%
0%
Subway
0.2%
0%
Taxicab
0.1%
0%
Walked
1.6%
5.4%
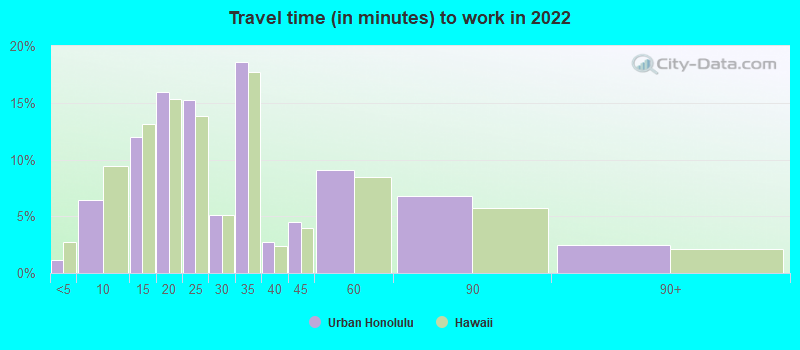
Average travel time to work
Type
Dallas
Urban Honolulu
Average
31.5 min
29.3 min
Private vehicle occupancy
Type
Dallas
Urban Honolulu
Average
1.2
1.3
Drove alone
86.8%
78.5%
In 2 person carpool
9%
16.2%
In 3 person carpool
2.6%
2.9%
In 4 person carpool
0.9%
1.6%
In 5-6 person carpool
0.5%
0.8%
In 7+ person carpool
0.2%
0%
How many people usually rode to work in the car, truck or van.
Real Estate
The real estate market is more accessible in Dallas due to its lower average property prices compared to Honolulu. Urban Honolulu, surrounded by ocean and mountains, has limited land for expansion, keeping property prices relatively high.
Neighborhoods
Both cities offer an array of neighborhoods to suit different lifestyles. Dallas boasts neighborhoods such as Bishop Arts District for artists or Preston Hollow for peace and quiet. Honolulu offers places like Downtown for city living or Manoa for a suburban feel.
Houses and residents
Type
Dallas
Urban Honolulu
Houses
591,773
157,427
Average household size (people)
2.6
2.5
Median year apartment built
1987
1974
Median year house/condo built
1969
1973
Length of stay in the house since moving in
13.9 years
16.7 years
Houses occupied
536,008 (90.6%)
138,398 (87.9%)
Houses occupied by owners
229,518 (42.8%)
68,458 (49.5%)
Houses occupied by renters
306,490 (57.2%)
69,940 (50.5%)
Median rent asked for vacant for-rent units
$1,403
$1,712
Median monthly housing costs
$1,225
$1,665
Median price asked for vacant for-sale houses and condos
$574,934
$238,020
Estimated median house or condo value
$267,600
$781,600
Median numbers of rooms
4.6
3.8
Median house price - detached houses
$410,272
Over $1,000,000
Median house price - in 2-unit structures
$255,160
$940,827
Median house price - in 3-to-4-unit structures
$230,927
$766,061
Median house price - in 5 or more unit structures
$444,589
$539,250
Median house price - mobile homes
$91,039
Over $1,000,000
Median house price - Townhouses or other attached units
$350,045
Over $1,000,000
Median house price - All housing units
$402,215
$941,281
Median house age
40
47
Renting percentage
55.9%
56.2%
House value disparities
41.3%
27%
Household income disparities
48.2%
45%
Median household income for houses/condes with a mortgage
$103,798
$117,430
Median household income for apartments without a mortgage
$61,909
$69,945
Housing units without a mortgage
1,309 (1%)
1,696 (4.1%)
Housing units with both a second mortgage and home equity loan
3,320 (2.6%)
6,219 (15.1%)
Housing units with a mortgage
124,846 (99%)
39,383 (95.9%)
Housing units with a home equity loan
204 (0.2%)
319 (0.8%)
Housing units with a second mortgage
5,351 (4.2%)
7,901 (19.2%)
House/condo owner moved in on average (years ago)
12
14
House/condo renter moved in on average (years ago)
1
3
Housing units lacking complete kitchen facilities
1.2%
2.6%
Housing units lacking complete plumbing facilities
0.9%
0.8%
Housing units in structures
Housing units in structures
Dallas
Urban Honolulu
One, detached
41.8%
26.2%
One, attached
4.3%
7.2%
Two
1.5%
2.4%
3 or 4
4.9%
3.3%
5 to 9
7.9%
5.2%
10 to 19
12.1%
6.2%
20 to 49
8.1%
11.4%
50 or more
18.4%
38.0%
Mobile homes
1.0%
0.1%
Median real estate property taxes paid for housing units
Self-employed workers in own not incorporated business
43,703
10,949
State government workers
17,325
19,544
Unpaid family workers
754
446
Industries and Occupations
Dallas offers opportunities in industries such as technology, financial services, defense, and telecommunications. In comparison, Honolulu provides jobs primarily in tourism, healthcare, and defense sectors, aligning with its geographic location and cultural attractions.
Dallas has numerous large hospitals and specialty clinics, providing excellent healthcare resources. Urban Honolulu, with its smaller population, has fewer facilities but still offers high-quality healthcare.
Health (county statistics)
Type
Dallas
Urban Honolulu
General health status score of residents in this county from 1 (poor) to 5 (excellent)
Both Dallas and Honolulu offer modern infrastructure. Dallas, as the ninth-largest city in the U.S., provides a large city infrastructure, whereas Honolulu has a smaller city structure. Each city, therefore, presents different kinds of infrastructure opportunities.
Infrastructure
Type
Dallas
Urban Honolulu
TV stations
25
15
Culture and Food
Dallas boasts a thriving arts scene and rich food culture including Tex-Mex and barbecues. Urban Honolulu offers a unique blend of Pacific cultures, with a strong Asian influence apparent in food and cultural events.
Sports Teams
Dallas is home to several professional sports teams, including the Dallas Cowboys (NFL) and the Mavericks (NBA). In contrast, Honolulu does not have professional sports teams but offers a robust range of water sports due to its coastal location.


 Dallas, TX and
  Urban Honolulu, HI : 3,788.6 miles
 Dallas, TX and
  Urban Honolulu, HI : 3,788.6 miles