This comparison between Dallas, TX and Wichita, KS addresses key factors such as crime and safety, weather, cost of living, education, work and economy, infrastructure, real estate, transportation, taxes, culture, sports, geography, and healthcare. Each city offers distinctive qualities perfect for different personalities and lifestyles. Included are the specific points that may appeal to people considering relocation or just visiting.
Distance between
Dallas, TX and
Wichita, KS : 339.2 miles
Dallas's population is larger by 226%. Its population has grown by 99,877 people (8.4%) since 2000. The population of Wichita has grown by 51,415 people (14.9%) during that time.
According to crime statistics, Wichita tends to have a higher crime rate than the national average while Dallas exceeds Wichita. However, this does not necessarily mean Dallas is less safe, as crime often concentrates in specific areas. Neighborhood-based safety measures are becoming a focus in both cities. Dallas has seen falling crime rates in recent years while Wichita is working on improving public safety.
City-data.com crime index counts serious crimes and violent crime more heavily. It adjusts for the number of visitors and daily workers commuting into cities. (higher means more crime, U.S. average = 301.1)
City-data.com crime index counts serious crimes and violent crime more heavily. It adjusts for the number of visitors and daily workers commuting into cities. (higher means more crime, U.S. average = 301.1)
Sex Offenders
According to our data, there are 4,310 registered sex offenders living in Dallas and 1,459 registered sex offenders living in . The ratio of residents to sex offenders in Dallas is 306 to 1; the ratio in Wichita is 267 to 1. The number of registered sex offenders compared to the number of residents in Dallas is near to than in Wichita.
Cost of Living
Overall, the cost of living in Wichita is lower than in Dallas. Housing is notably less expensive in Wichita, making it an attractive choice for those looking for affordability. However, Dallas offers higher wages which balances out the cost increase to a certain extent.
Income Tax
Texas does not impose state income tax, making it appealing for those seeking tax savings. On the contrary, Kansas does require residents to pay state income tax.
Property Tax
Texas property taxes are generally higher than in Kansas, so homeowners in Dallas pay more property tax compared to Wichita residents.
Sales Tax
Both Texas and Kansas have state sales tax. However, Texas does not have city sales tax while Wichita does, accounting for a higher combined sales tax rate in Wichita compared to Dallas.
Income
Type
Dallas
Wichita
Estimated median household income
$57,995
$56,293
Estimated per capita income
$38,479
$30,942
Cost of living index (U.S. average is 100)
96.1
81.7
If you make $50,000 in Wichita, you will have to make $58,813 in Dallas to maintain the same standard of living.
Geographical Conditions
Both Dallas and Wichita are located on the plains but Dallas is near lakes and has a more varied landscape. Wichita is known for its flatness, with the Arkansas River being a significant geographical feature.
Both cities feature well-regarded school districts and higher education institutions. Dallas holds more opportunities because of its size, with multiple universities including renowned Southern Methodist University. Wichita is home to Wichita State University which is known for a strong engineering program.
Dallas has a diverse, robust economy with strengths in sectors like technology, banking, healthcare, and more. Wichita is known as the "Air Capital of the World" due to its significant aviation industry. Both cities have stable job markets, but Dallas offers more opportunities due to its size and diversity.
Biggest Employers
Dallas being a hub for economic activity houses Fortune 500 companies like AT&T and Texas Instruments. Wichita's largest employers are centered around the aviation industry, with companies like Spirit AeroSystems and Textron Aviation.
There were 2,245 building permits issued in Dallas in 2012 (1436 more than in 2011) compared to 760 building permits issued in Wichita in 2012 (351 more than in 2011).
In Dallas (Dallas County), 57.3% voted for Democrats and 41.8% for Republicans in 2012 Presidential Election. In Wichita (Sedgwick County), 39.4% voted for Democrats and 58.3% for Republicans.
Elections
Type
Democrats
Republicans
Other
Year
Dallas
Wichita
Dallas
Wichita
Dallas
Wichita
2020
65.1%
42.9%
33.4%
54.7%
1.4%
2.4%
2016
60.8%
36.3%
34.7%
54.4%
4.5%
9.3%
2012
57.3%
39.4%
41.8%
58.3%
1.0%
2.3%
2008
57.4%
42.5%
42.0%
55.2%
0.6%
2.3%
2004
49.0%
36.6%
50.4%
62.3%
0.5%
1.2%
2000
45.0%
38.4%
52.7%
57.5%
2.4%
4.1%
1996
46.0%
35.8%
46.8%
56.1%
7.2%
8.1%
Breakdown of population affiliated with a religious congregation
Type
Adherents
Congregations
Religion
Dallas
Wichita
Dallas
Wichita
CATHOLIC CHURCH
18.9%
15.0%
2.4%
5.9%
SOUTHERN BAPTIST CONVENTION
11.0%
5.9%
31.1%
9.9%
MUSLIM ESTIMATE
3.6%
0.2%
1.1%
0.7%
EPISCOPAL CHURCH
1.0%
0.5%
1.5%
1.3%
SEVENTH DAY ADVENTIST CHURCH
0.5%
0.4%
1.7%
1.3%
EVANGELICAL LUTHERAN CHURCH IN AMERICA
0.3%
0.5%
0.9%
1.6%
LUTHERAN CHURCH
0.3%
1.4%
0.7%
1.8%
SALVATION ARMY
0.2%
0.4%
0.3%
0.4%
AMERICAN BAPTIST CHURCHES IN THE USA
0.1%
0.6%
0.2%
3.1%
Weather
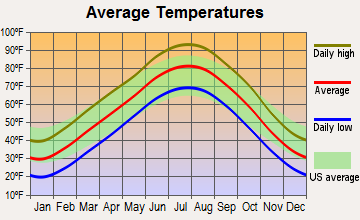
Dallas experiences a humid subtropical climate with hot summers and cool winters, leading to a broader variety of weather patterns compared to Wichita. Wichita, residing in the continental zone, has hot summers too but experiences more severe weather incidents like tornadoes.
Weather and climate
Type
Dallas
Wichita
Temperature - Average
66.6°F
56.3°F
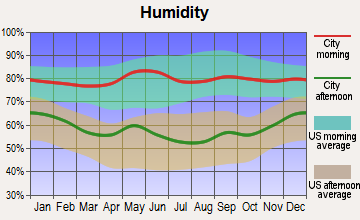
Humidity - Average morning or afternoon humidity
71.3%
73.4%
Humidity - Differences between morning and afternoon humidity
34%
34%
Humidity - Maximum monthly morning or afternoon humidity
82%
84%
Humidity - Minimum monthly morning or afternoon humidity
48%
50%
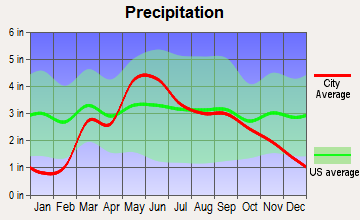
Precipitation - Yearly average
37.3 in
30.9 in
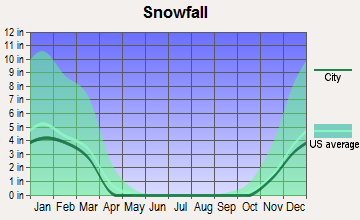
Snowfall - Yearly average
4.2 in
30 in
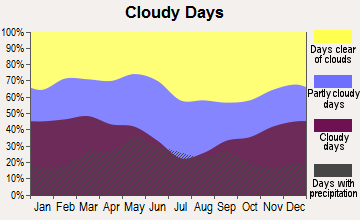
Clouds - Number of days clear of clouds
22.8%
21.3%
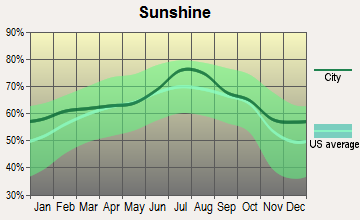
Sunshine amount - Average
66.6%
70.2%
Sunshine amount - Differences during a year
20%
20%
Sunshine amount - Maximum monthly
74%
76%
Sunshine amount - Minimum monthly
54%
56%
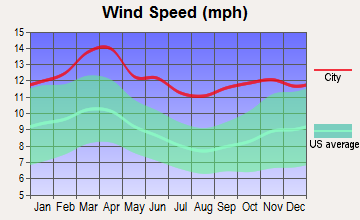
Wind speed - Average
10.3 mph
12.5 mph
Average climate in Dallas, Texas
Average climate in Wichita, Kansas
Air pollution
Type
AQI
CO
NO2
OZONE
PB
PM10
PM25
SO2
Year
Dallas
Wichita
Wichita
Dallas
Wichita
Dallas
Wichita
Dallas
Wichita
Dallas
Wichita
Dallas
Wichita
2018
86
67
N/A
N/A
5.7
7.8
28.7
28.1
N/A
N/A
25.8
N/A
9.7
6.2
0.4
1.1
2017
84
66
N/A
N/A
5.5
6.8
28.6
29.1
N/A
N/A
22.1
N/A
9.1
6.9
0.3
1.2
2016
81
65
N/A
N/A
6.1
6.8
27.2
27.6
N/A
N/A
21.5
N/A
8.4
N/A
0.2
0.6
2015
85
61
N/A
N/A
6.5
7.2
26.7
28.4
N/A
N/A
21.1
N/A
8.9
N/A
0.3
1.0
2014
83
70
N/A
N/A
6.3
7.7
27.6
30.0
N/A
N/A
23.4
N/A
9.9
N/A
0.3
1.4
2013
97
66
0.25
N/A
7.3
8.9
28.8
30.1
N/A
N/A
20.8
N/A
13.0
N/A
0.2
0.6
2012
116
91
0.26
N/A
8.6
9.9
31.0
32.2
N/A
N/A
24.1
N/A
12.0
N/A
0.3
1.2
2011
98
89
0.22
N/A
9.4
12.2
30.9
33.5
N/A
N/A
22.6
N/A
11.9
N/A
0.6
1.5
2010
79
73
0.45
N/A
9.4
8.3
28.3
32.0
N/A
N/A
20.2
N/A
N/A
N/A
0.7
0.7
2009
88
69
0.31
N/A
9.2
8.2
28.8
29.3
N/A
N/A
19.9
N/A
N/A
N/A
0.5
0.8
2008
88
66
0.36
N/A
9.8
8.9
29.2
24.0
0.121
N/A
20.9
N/A
N/A
N/A
0.5
1.7
2007
94
70
0.47
N/A
11.0
9.5
25.7
21.7
0.070
N/A
21.2
N/A
N/A
N/A
0.3
1.4
2006
107
82
0.46
N/A
10.8
10.0
30.6
29.7
0.106
N/A
22.3
N/A
N/A
N/A
0.7
0.4
2005
108
80
0.55
N/A
13.0
11.4
29.7
27.8
0.142
N/A
21.5
N/A
11.0
N/A
0.9
0.3
2004
96
60
0.37
N/A
12.3
9.3
26.0
27.8
0.099
N/A
20.2
N/A
N/A
N/A
0.8
0.1
2003
102
74
0.30
N/A
13.6
10.0
27.1
29.2
0.121
N/A
21.8
N/A
N/A
N/A
1.0
0.1
2002
100
79
0.54
N/A
14.0
8.1
25.2
31.7
0.080
N/A
22.4
N/A
N/A
N/A
0.4
0.1
2001
100
86
0.40
N/A
14.3
5.2
26.0
34.2
0.069
N/A
23.7
N/A
N/A
N/A
1.0
0.2
2000
109
84
0.55
N/A
14.5
5.0
27.0
30.6
0.092
N/A
22.8
N/A
N/A
N/A
1.1
0.3
Natural disasters
Type
Dallas
Wichita
Tornado activity compared to U.S. average
254.7%
202.4%
Earthquake activity compared to U.S. average
567%
922.9%
Natural disasters compared to U.S. average
21%
16%
Transportation
Dallas has an extensive public transit system, including buses, light rail, and a bike-share program. Wichita public transit is more limited but the city is generally more navigable due to its smaller size.
Transport
Type
Dallas
Wichita
Amtrak stations
1
0
Amtrak stations nearby
1
0
FAA registered aircraft
2
2
FAA registered aircraft manufacturers and dealers
56
69
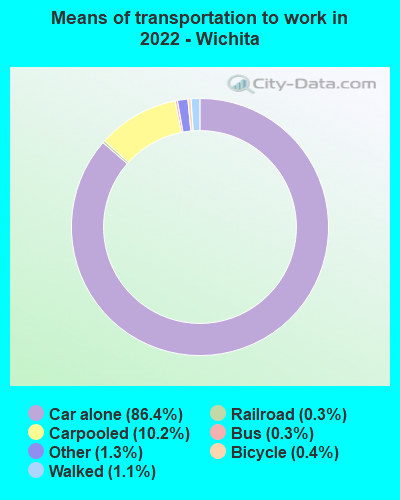
Means of transportation to work
Type
Dallas
Wichita
Bicycle
0.3%
0.3%
Bus
1.4%
0.5%
Carpooled
10.9%
9.1%
Car alone
83.9%
87%
Motorcycle
0%
0.1%
Railroad
0.2%
0%
Subway
0.2%
0%
Taxicab
0.1%
0.1%
Walked
1.6%
1.1%
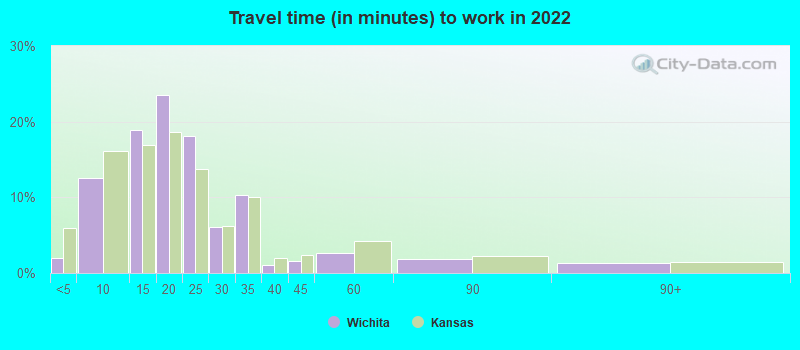
Average travel time to work
Type
Dallas
Wichita
Average
31.5 min
21.6 min
Other means
26.5 min
18.7 min
Public transportation
46 min
42.3 min
Private vehicle occupancy
Type
Dallas
Wichita
Average
1.2
1.2
Drove alone
86.8%
89.1%
In 2 person carpool
9%
8.3%
In 3 person carpool
2.6%
1.6%
In 4 person carpool
0.9%
0.5%
In 5-6 person carpool
0.5%
0.3%
In 7+ person carpool
0.2%
0.2%
How many people usually rode to work in the car, truck or van.
Real Estate
The real estate market in Dallas tends to be more expensive but has shown solid appreciation. Wichita’s real estate is more affordable with steady growth, providing potential for investment opportunities.
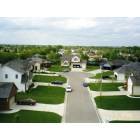
Neighborhoods
Dallas neighborhoods span from urban to suburban, each with a character of its own, appeals to a diverse array of residents. Wichita’s neighborhoods are less diversified, but still offer a range from historic to more modern areas.
Houses and residents
Type
Dallas
Wichita
Houses
591,773
176,357
Average household size (people)
2.6
2.5
Median year apartment built
1987
1974
Median year house/condo built
1969
1978
Length of stay in the house since moving in
13.9 years
12.1 years
Houses occupied
536,008 (90.6%)
156,668 (88.8%)
Houses occupied by owners
229,518 (42.8%)
91,527 (58.4%)
Houses occupied by renters
306,490 (57.2%)
65,141 (41.6%)
Median rent asked for vacant for-rent units
$1,403
$1,022
Median monthly housing costs
$1,225
$884
Median price asked for vacant for-sale houses and condos
$574,934
$269,752
Estimated median house or condo value
$267,600
$165,700
Median numbers of rooms
4.6
5.7
Median number of rooms in apartments
3.7
4.3
Median number of rooms in houses and condos
6.1
7
Median house price - detached houses
$410,272
$217,536
Median house price - in 2-unit structures
$255,160
$140,687
Median house price - in 3-to-4-unit structures
$230,927
$121,965
Median house price - in 5 or more unit structures
$444,589
$117,517
Median house price - mobile homes
$91,039
$87,984
Median house price - Townhouses or other attached units
$350,045
$146,455
Median house price - All housing units
$402,215
$210,445
Median house age
40
47
Renting percentage
55.9%
38.7%
Housing density (houses/condos per square mile)
1,727.6
1,299.1
House value disparities
41.3%
37.5%
Household income disparities
48.2%
44.1%
Median household income for houses/condes with a mortgage
$103,798
$82,935
Median household income for apartments without a mortgage
$61,909
$60,554
Housing units without a mortgage
1,309 (1%)
1,747 (3%)
Housing units with both a second mortgage and home equity loan
3,320 (2.6%)
4,222 (7.3%)
Housing units with a mortgage
124,846 (99%)
56,370 (97%)
Housing units with a home equity loan
204 (0.2%)
321 (0.6%)
Housing units with a second mortgage
5,351 (4.2%)
5,142 (8.8%)
House/condo owner moved in on average (years ago)
12
10
House/condo renter moved in on average (years ago)
1
1
Housing units lacking complete kitchen facilities
1.2%
3.7%
Housing units lacking complete plumbing facilities
0.9%
2.6%
Housing units in structures
Housing units in structures
Dallas
Wichita
One, detached
41.8%
65.1%
One, attached
4.3%
5.6%
Two
1.5%
4.6%
3 or 4
4.9%
4.7%
5 to 9
7.9%
3.6%
10 to 19
12.1%
5.3%
20 to 49
8.1%
4.3%
50 or more
18.4%
4.6%
Mobile homes
1.0%
2.0%
Boats, RVs, vans, etc.
0.0%
0.1%
Median real estate property taxes paid for housing units
Self-employed workers in own not incorporated business
43,703
8,733
State government workers
17,325
7,037
Unpaid family workers
754
256
Industries and Occupations
Dallas has a diverse range of industries, including IT, financial services, and healthcare. In contrast, Wichita's job market is largely centered around aviation, manufacturing, and agricultural sectors.
Health care wise, both cities are equipped with renowned hospitals and health services. Dallas has more hospitals and facilities due to its larger size and population.
Health (county statistics)
Type
Dallas
Wichita
General health status score of residents in this county from 1 (poor) to 5 (excellent)
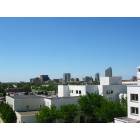
Dallas boasts of state-of-the-art infrastructures like modern airports, highways, and public buildings. Wichita, although smaller, is well-structured, with continuous infrastructural development to encourage economic growth and improve living conditions.
Infrastructure
Type
Dallas
Wichita
Hospitals
74
24
TV stations
25
13
Arenas or stadiums
2
1
Bank branches located here
394
138
Bank institutions located here
80
34
Main business address for public companies
122
5
Drinking water stations with no reported violations in the past
8
0
Drinking water stations with reported violations in the past
HMDA - Conventional home purchase loans - Applications denied
Year
Dallas
Wichita
1999
5,030
2,785
2000
3,390
2,308
2001
2,626
1,808
2002
2,657
1,227
2003
3,617
1,260
2004
5,460
1,320
2005
7,445
1,401
2006
7,397
1,272
2007
5,056
1,037
2008
2,200
569
2009
1,121
324
Culture and Food
Dallas is culturally diverse, reflected in its wide array of food, art, and music scenes. Wichita, smaller and less diverse, still offers a vibrant culture with a focus on the arts, history, and local food.
Sports Teams
Dallas is home to several professional sports teams including the Dallas Cowboys (NFL), Dallas Mavericks (NBA), and the Texas Rangers (MLB). Wichita does not have any major league professional sports teams but has several minor league teams and college sports are popular.


 Dallas, TX
 Wichita, KS