Detroit, MI and Seattle, WA offer distinct environments for both residents and visitors. While Detroit, known as "Motor City" has a rich history with the automobile industry and a vibrant music scene, Seattle, the "Emerald City," is renowned for its tech industry and outdoor activities. Regardless of the stark lifestyle differences, both cities offer unique cultural experiences, world-class education systems, and thriving industries.
Distance between
Detroit, MI and
Seattle, WA : 1,928.8 miles
Seattle's population is larger by 16%. Its population has grown by 170,545 people (30.3%) since 2000. The population of Detroit has decreased by 318,806 people (33.5%) during that time.
Detroit has seen a high crime rate in recent decades, yet it has shown progress in improving public safety with increased law enforcement and community outreach programs. Nevertheless, specific neighborhoods like Midtown and Downtown Detroit remain relatively safer. On the other hand, Seattle has a lower overall crime rate compared to Detroit. Certain areas in Seattle like Queen Anne and Northgate offer safer living and visiting experiences.
City-data.com crime index counts serious crimes and violent crime more heavily. It adjusts for the number of visitors and daily workers commuting into cities. (higher means more crime, U.S. average = 301.1)
City-data.com crime index counts serious crimes and violent crime more heavily. It adjusts for the number of visitors and daily workers commuting into cities. (higher means more crime, U.S. average = 301.1)
Sex Offenders
According to our data, there are 3,441 registered sex offenders living in Detroit and 481 registered sex offenders living in . The ratio of residents to sex offenders in Detroit is 196 to 1; the ratio in Seattle is 1,464 to 1. The number of registered sex offenders compared to the number of residents is much larger in Detroit than that in Seattle.
Cost of Living
Detroit has a lower cost of living compared to Seattle. Affordability in housing, transportation, and groceries are noticeable, which can be an attractive point for relocation. Seattle is one of the highest cost-of-living cities in the US, largely due to the extensive growth of the technology sector and the high housing costs it has produced.
Income Tax
Residents of Detroit pay a city income tax, and Michigan also imposes a state income tax. Seattle, however, does not have a city income tax, and Washington state does not levy an income tax.
Property Tax
Property taxes in Detroit tend to be lower than in Seattle. However, Michigan does impose a state property tax. In contrast, Seattle has higher property tax rates, although there is no state property tax in Washington.
Sales Tax
Michigan has a statewide sales tax of 6% and does not levy any local sales tax, giving Detroit a comparatively low sales tax. Seattle, in Washington state, levies a combined state and local sales tax, which can be up to 10.1%.
Income
Type
Detroit
Seattle
Estimated median household income
$36,140
$110,781
Estimated per capita income
$22,122
$74,733
Cost of living index (U.S. average is 100)
94.1
118.5
If you make $50,000 in Detroit, you will have to make $62,965 in Seattle to maintain the same standard of living.
Geographical Conditions
Detroit, located by the Detroit River, offers riverfront views and flat landscapes. Seattle is known for its picturesque landscape of mountains and bodies of water which includes Puget Sound and Lake Washington. Its hilly topography offers many stunning views of the surrounding area.
Both cities offer exceptional education opportunities. Detroit is home to Wayne State University, regarded for its research and diversity. Detroit's education system has struggled but it is steadily improving. Seattle, home to the University of Washington, boasts one of the top public research universities in the country. It also provides excellent public and private schools.
Detroit's economy, once heavily dependent on the automobile industry, has diversified into sectors such as finance, healthcare, and technology. Its labor market has seen steady growth over the past years. Seattle's economy is robust, with strengths in technology, aerospace, and retail industries. It's home to industry giants such as Amazon and Microsoft.
Biggest Employers
Detroit's biggest employers are General Motors, Ford, Detroit Medical Center and Quicken Loans. In Seattle, Amazon, Microsoft, University of Washington are among the largest employers, providing a wide range of jobs.
There were 10 building permits issued in Detroit in 2012 (8 less than in 2011) compared to 264 building permits issued in Seattle in 2012 (52 less than in 2011).
In Detroit (Wayne County), 73.1% voted for Democrats and 26.2% for Republicans in 2012 Presidential Election. In Seattle (King County), 69.0% voted for Democrats and 28.5% for Republicans.
Elections
Type
Democrats
Republicans
Other
Year
Detroit
Seattle
Detroit
Seattle
Detroit
Seattle
2020
68.6%
75.1%
30.4%
22.3%
1.0%
2.6%
2016
66.6%
70.0%
29.4%
21.1%
4.0%
8.9%
2012
73.1%
69.0%
26.2%
28.5%
0.6%
2.5%
2008
74.4%
70.2%
24.7%
28.1%
0.9%
1.7%
2004
69.7%
65.1%
29.9%
33.8%
0.4%
1.1%
2000
69.1%
60.3%
29.1%
34.5%
1.8%
5.2%
1996
69.0%
56.4%
24.0%
31.4%
7.0%
12.2%
Breakdown of population affiliated with a religious congregation
Type
Adherents
Congregations
Religion
Detroit
Seattle
Detroit
Seattle
CATHOLIC CHURCH
16.3%
14.4%
11.2%
4.9%
MUSLIM ESTIMATE
3.7%
0.6%
2.9%
1.4%
AMERICAN BAPTIST CHURCHES IN THE USA
1.5%
0.6%
2.4%
2.9%
LUTHERAN CHURCH
1.2%
0.5%
3.9%
2.0%
EVANGELICAL LUTHERAN CHURCH IN AMERICA
0.7%
1.3%
2.8%
4.7%
EPISCOPAL CHURCH
0.4%
0.8%
2.5%
2.4%
SEVENTH DAY ADVENTIST CHURCH
0.4%
0.6%
1.4%
2.3%
SOUTHERN BAPTIST CONVENTION
0.4%
0.3%
3.2%
3.8%
Weather
Detroit experiences a continental climate with dramatic seasonal changes including warm, humid summers and cold winters, offering opportunities for a range of seasonal activities. Seattle's weather, in contrast, is Oceanic, featuring mild, damp winters and warm, dry summers. The city is notorious for its rainy environment, especially during the winter months.
Weather and climate
Type
Detroit
Seattle
Temperature - Average
50°F
52.5°F
Humidity - Average morning or afternoon humidity
75.3%
78.5%
Humidity - Differences between morning and afternoon humidity
33%
38%
Humidity - Maximum monthly morning or afternoon humidity
86%
86%
Humidity - Minimum monthly morning or afternoon humidity
53%
48%
Precipitation - Yearly average
33.6 in
36.6 in
Snowfall - Yearly average
86.5 in
21.4 in
Clouds - Number of days clear of clouds
12.7%
11.6%
Sunshine amount - Average
56.8%
49.4%
Sunshine amount - Differences during a year
38%
44%
Sunshine amount - Maximum monthly
69%
64%
Sunshine amount - Minimum monthly
31%
20%
Wind speed - Average
10.2 mph
8.6 mph
Average climate in Detroit, Michigan
Average climate in Seattle, Washington
Air pollution
Type
AQI
CO
NO2
OZONE
PB
PM10
PM25
SO2
Year
Detroit
Seattle
Detroit
Seattle
Detroit
Seattle
Detroit
Seattle
Detroit
Seattle
Seattle
Detroit
Seattle
Detroit
Seattle
2018
90
82
0.44
0.21
12.9
10.6
25.8
20.7
N/A
N/A
N/A
N/A
10.1
8.3
1.1
0.7
2017
87
92
0.56
0.23
12.7
11.1
20.9
21.0
N/A
N/A
N/A
N/A
10.1
8.8
1.3
0.3
2016
86
67
0.47
0.22
13.2
11.9
22.0
20.3
N/A
N/A
N/A
N/A
10.9
6.6
0.8
0.6
2015
95
81
0.49
0.23
14.8
10.8
26.5
19.3
N/A
N/A
N/A
N/A
11.9
8.5
1.2
0.8
2014
95
75
0.48
0.24
14.2
11.5
24.2
19.5
N/A
N/A
N/A
N/A
12.0
7.4
1.7
N/A
2013
80
81
0.53
0.24
14.4
N/A
24.5
17.4
N/A
N/A
N/A
N/A
11.0
9.1
1.3
0.8
2012
99
77
0.49
0.23
14.6
N/A
25.7
19.5
N/A
N/A
N/A
N/A
6.6
7.7
1.7
1.0
2011
94
72
0.32
0.24
12.9
N/A
24.3
18.6
N/A
N/A
N/A
N/A
6.5
7.5
1.6
1.1
2010
96
71
0.28
0.24
11.8
N/A
24.7
18.0
0.006
N/A
N/A
N/A
12.1
6.7
1.6
1.1
2009
68
94
0.27
0.27
12.7
N/A
23.4
17.7
N/A
N/A
N/A
N/A
N/A
8.0
1.9
1.4
2008
67
80
0.27
0.30
12.8
N/A
N/A
17.8
N/A
N/A
N/A
N/A
N/A
6.5
2.0
1.3
2007
81
83
0.29
0.30
13.7
N/A
25.8
18.2
0.017
N/A
20.3
N/A
N/A
7.9
N/A
1.5
2006
63
98
0.31
N/A
14.0
N/A
19.8
18.3
0.022
N/A
22.6
N/A
N/A
8.7
3.2
N/A
2005
83
101
0.36
0.80
17.4
18.3
22.6
N/A
0.019
N/A
24.5
N/A
N/A
9.5
4.0
3.5
2004
70
102
0.43
0.81
15.0
17.9
N/A
N/A
0.014
N/A
N/A
N/A
N/A
10.3
3.7
3.0
2003
86
91
0.40
0.78
18.5
18.5
N/A
N/A
0.013
N/A
N/A
N/A
N/A
9.9
4.8
2.4
2002
88
87
0.36
0.82
18.3
19.3
N/A
N/A
0.019
N/A
N/A
N/A
N/A
11.7
4.3
2.7
2001
83
88
0.36
0.90
19.0
20.7
N/A
N/A
0.020
0.005
N/A
N/A
N/A
12.3
4.4
3.7
2000
71
98
0.35
1.06
18.2
20.9
N/A
N/A
0.027
N/A
N/A
N/A
N/A
13.3
5.2
3.2
Natural disasters
Type
Detroit
Seattle
Tornado activity compared to U.S. average
128.5%
5.5%
Earthquake activity compared to U.S. average
53.2%
1,394.2%
Natural disasters compared to U.S. average
14%
30%
Transportation
Detroit's public transit includes buses and a downtown People Mover system. Yet, the city is largely car-dependent. In contrast, Seattle boasts a range of public transit options from buses to light rail, making commuting without a car feasible.
Transport
Type
Detroit
Seattle
Amtrak stations
1
1
Amtrak stations nearby
3
2
FAA registered aircraft
93
1
FAA registered aircraft manufacturers and dealers
3
2
Means of transportation to work
Type
Detroit
Seattle
Bicycle
0.5%
2.1%
Bus
4%
8.9%
Carpooled
7.5%
8.7%
Car alone
83.4%
67.8%
Ferryboat
0%
0.7%
Motorcycle
0%
0.3%
Railroad
0%
1.2%
Streetcar
0.1%
0.3%
Subway
0.1%
0.6%
Taxicab
0.5%
0.1%
Walked
2.7%
8%
Average travel time to work
Type
Detroit
Seattle
Average
30.6 min
35 min
Other means
26 min
23.5 min
Public transportation
47.7 min
35.6 min
Private vehicle occupancy
Type
Detroit
Seattle
Average
1.2
1.2
Drove alone
87.1%
89%
In 2 person carpool
10.5%
8.7%
In 3 person carpool
1%
0.8%
In 4 person carpool
1%
0.2%
In 5-6 person carpool
0.3%
1.1%
In 7+ person carpool
0.2%
0.2%
How many people usually rode to work in the car, truck or van.
Real Estate
Housing prices in Detroit are considerably lower than in Seattle. Despite recent increases, Detroit real estate remains a potentially attractive investment. Seattle has a competitive real estate market, with high home prices driven by strong demand and low supply.
Neighborhoods
Detroit has diverse neighborhoods such as the artistic Midtown, historic Corktown, and upscale Palmer Woods. Seattle's neighborhoods all have a unique feel, from the bustling Downtown district, the quirky Capitol Hill to the family-friendly Queen Anne area.
Houses and residents
Type
Detroit
Seattle
Houses
322,906
384,799
Average household size (people)
2.6
2.1
Median year apartment built
1953
1987
Median year house/condo built
1946
1955
Length of stay in the house since moving in
16.7 years
12.4 years
Houses occupied
251,729 (78%)
351,650 (91.4%)
Houses occupied by owners
129,084 (51.3%)
161,587 (46%)
Houses occupied by renters
122,645 (48.7%)
190,063 (54%)
Median rent asked for vacant for-rent units
$798.06
$2,780
Median monthly housing costs
$755
$1,984
Median price asked for vacant for-sale houses and condos
$86,452
$860,506
Estimated median house or condo value
$69,300
$848,100
Median numbers of rooms
5.7
4.1
Median number of rooms in apartments
5
3
Median number of rooms in houses and condos
6.3
6.3
Median house price - detached houses
$96,752
Over $1,000,000
Median house price - in 2-unit structures
$72,631
$764,579
Median house price - in 3-to-4-unit structures
$183,952
$719,049
Median house price - in 5 or more unit structures
$242,851
$626,370
Median house price - mobile homes
$43,864
$226,727
Median house price - Townhouses or other attached units
$128,652
$925,507
Median house price - All housing units
$101,554
Over $1,000,000
Median house age
74
47
Renting percentage
48.9%
51.9%
Housing density (houses/condos per square mile)
2,326.9
4,587.9
House value disparities
48.4%
20.6%
Household income disparities
49.3%
42.2%
Median household income for houses/condes with a mortgage
$61,259
$189,767
Median household income for apartments without a mortgage
$38,901
$112,771
Housing units without a mortgage
2,599 (5.6%)
2,459 (2.1%)
Housing units with both a second mortgage and home equity loan
2,270 (4.9%)
12,354 (10.5%)
Housing units with a mortgage
43,675 (94.4%)
115,481 (97.9%)
Housing units with a home equity loan
357 (0.8%)
240 (0.2%)
Housing units with a second mortgage
3,466 (7.5%)
13,881 (11.8%)
House/condo owner moved in on average (years ago)
16
8
House/condo renter moved in on average (years ago)
4
1
Housing units lacking complete kitchen facilities
17.1%
2.2%
Housing units lacking complete plumbing facilities
13.6%
0.4%
Housing units in structures
Housing units in structures
Detroit
Seattle
One, detached
66.0%
39.6%
One, attached
6.1%
6.0%
Two
6.5%
2.0%
3 or 4
2.7%
3.2%
5 to 9
2.2%
5.7%
10 to 19
2.7%
7.0%
20 to 49
3.9%
11.9%
50 or more
9.4%
24.4%
Mobile homes
0.5%
0.1%
Median real estate property taxes paid for housing units
Self-employed workers in own not incorporated business
11,725
24,994
State government workers
8,763
27,235
Unpaid family workers
441
947
Industries and Occupations
Detroit is historically known for its automobile industry with General Motors, Ford, and Chrysler headquartered there. Yet it's seeing growth in healthcare, technology, and finance. Seattle’s economy is driven by a mix of older industrial companies, and "new economy" Internet and technology companies, service, design, and clean technology companies.
Detroit's health care is anchored by the Detroit Medical Center and Henry Ford Health System. In Seattle, top-rated hospitals like the University of Washington Medical Center and Seattle Children's Hospital provide comprehensive healthcare services.
Health (county statistics)
Type
Detroit
Seattle
General health status score of residents in this county from 1 (poor) to 5 (excellent)
Detroit's infrastructure, while older, is undergoing revitalization in recent years, especially in Downtown and Midtown. Seattle boasts state-of-the-art infrastructure, with investments in public transit and sustainability initiatives. Its tech boom has also led to a surge in modern office buildings.
Infrastructure
Type
Detroit
Seattle
Hospitals
41
22
TV stations
16
17
Arenas or stadiums
4
5
Bank branches located here
98
236
Bank institutions located here
12
37
Main business address for public companies
11
54
Drinking water stations with no reported violations in the past
5
3
Drinking water stations with reported violations in the past
HMDA - Conventional home purchase loans - Applications denied
Year
Detroit
Seattle
1999
2,901
1,357
2000
4,079
1,148
2001
3,815
890
2002
3,247
840
2003
5,511
1,421
2004
9,068
1,810
2005
13,958
2,341
2006
16,654
2,789
2007
10,742
2,273
2008
2,823
1,113
2009
484
748
Culture and Food
Detroit is known for its music, particularly Motown, and has a burgeoning food scene with notable Detroit-style pizza and coney dogs. Seattle, synonymous with grunge music and coffee culture, also hosts a vibrant food scene with a focus on seafood, influenced by its location by the Pacific Ocean.
Sports Teams
Detroit is home to four major sports teams: the Lions (NFL), Tigers (MLB), Pistons (NBA), and Red Wings (NHL). Seattle, on the other hand, hosts the Seahawks (NFL), Mariners (MLB), and recently welcomed Kraken (NHL). It’s also home to a successful MLS team, the Sounders.


 Detroit, MI
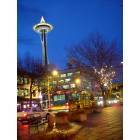
 Seattle, WA


