Detroit, MI vs Virginia Beach, VA - Advanced U.S. city comparison tool

Detroit, MI vs Virginia Beach, VA

When comparing Detroit, MI, and Virginia Beach, VA, one will find distinct differences in lifestyle, economy, and culture, defining both cities' unique personalities. These differences span across factors such as crime and safety, weather, cost of living, education, economy, infrastructure, occupations, real-estate, transportation, taxes, culture, and healthcare. As vibrant cities with their unique appeal, Detroit and Virginia Beach both have offerings that attract residents and tourists alike.
 
 
Distance between Detroit, MI and Virginia Beach, VA : 535.0 miles

Detroit's population is larger by 38%. Its population has decreased by 318,806 people (33.5%) since 2000. The population of Virginia Beach has grown by 32,415 people (7.6%) during that time.

Population
Type Detroit Virginia Beach
Population 632,464 457,672
Female / male percentage 52.3% / 47.7%
52.3%
47.7%
50.8% / 49.2%
50.8%
49.2%
Racial makeup - percentage
Ethnicity DetroitVirginia Beach
Black 76.4% 17.9%
White Non-Hispanic 10.3% 59.3%
Hispanic 7.7% 8.9%
Two or more 3.3% 6.3%
Asian 1.4% 6.8%
American Indian 0.2% 0.0%
Racial makeup - absolute values
Ethnicity DetroitVirginia Beach
Black 483,095 81,784
White Non-Hispanic 64,915 271,295
Hispanic 48,438 40,524
Two or more 21,010 28,962
Asian 8,924 30,957
American Indian 1,049 122
Pacific Islander 115 111

Crime and Safety

Detroit, MI has suffered from an elevated crime rate, however, in recent years, efforts have been made to reduce these statistics and its safety index is slowly improving. Virginia Beach, VA is deemed safer with relatively lower crime rates, making it a more lucrative choice for families and older individuals who prioritize safety. Detroit's downtown area is generally safer, while certain neighborhoods in the outskirts can experience higher crime rates.

Crime by year per 100,000 residents
Type City-data.com crime indexRobberies per 100,000Murders per 100,000Rapes per 100,000Assaults per 100,000Burglaries per 100,000Theft per 100,000Auto theft per 100,000Arson per 100,000
Year DetroitVirginia BeachDetroitVirginia BeachDetroitVirginia BeachDetroitVirginia BeachDetroitVirginia BeachDetroitVirginia BeachDetroitVirginia BeachDetroitVirginia BeachDetroitVirginia Beach
2020 796.8 106.6 280.2 27.5 49.7 3.8 102.5 13.3 1,746.2 54.1 661.1 110.7 1,703.9 1,262.7 845.6 138.4 115.5 6.0
2019 835.7 132.5 353.0 43.0 42.2 6.7 144.4 17.6 1,424.9 62.4 1,031.0 118.5 2,242.6 1,525.5 1,038.4 129.6 119.1 9.6
2018 840.8 126.9 344.1 38.8 38.9 3.5 149.9 20.2 1,477.2 65.6 1,112.4 131.3 2,243.8 1,485.1 961.0 128.2 127.1 9.5
2017 851.9 139.5 393.3 60.1 39.8 3.1 106.0 22.7 1,509.6 52.6 1,232.0 166.4 2,098.1 1,672.9 1,217.5 101.7 129.7 11.2
2016 871.0 160.4 439.3 58.7 45.1 4.6 88.7 29.4 1,476.1 62.2 1,318.4 191.2 2,087.6 1,879.0 1,338.0 112.6 83.0 15.5
2015 793.0 156.7 512.2 59.6 42.6 4.2 78.3 26.5 1,134.7 51.9 1,169.6 211.4 2,156.8 1,906.8 1,205.2 96.7 125.5 21.0
2014 869.2 154.9 521.8 55.4 43.5 3.8 81.4 25.5 1,342.8 63.2 1,340.6 233.0 2,004.4 1,872.7 1,473.9 81.1 71.7 13.3
2013 964.9 179.2 681.7 67.7 45.2 3.8 87.6 32.6 1,257.5 59.7 1,680.0 312.6 2,457.2 2,088.6 1,657.7 99.2 87.3 22.0
2012 983.7 176.9 685.9 73.1 54.6 4.7 62.5 12.7 1,321.6 77.3 1,909.8 351.7 2,261.6 2,168.5 1,628.4 107.9 79.3 27.7
2011 996.0 187.7 697.7 93.4 48.2 3.4 59.7 14.7 1,333.1 65.4 2,247.8 461.4 2,313.4 2,192.1 1,574.1 102.0 134.3 30.0
2010 1,075.6 203.3 776.0 97.9 43.4 3.2 56.5 12.1 1,502.0 76.5 2,392.6 494.1 2,539.6 2,397.5 1,765.8 150.7 151.6 30.8
2009 903.0 210.6 661.2 102.7 40.0 4.4 36.8 15.1 1,253.8 83.2 2,117.5 468.4 2,069.6 2,478.8 1,419.1 129.8 70.0 24.8
2008 924.0 211.8 698.3 121.8 35.7 3.2 36.9 16.8 1,214.4 97.7 2,034.2 444.3 2,156.8 2,322.2 1,777.0 148.1 79.3 31.1
2007 1,061.5 221.2 762.7 126.6 45.5 3.7 38.9 19.5 1,439.8 98.9 2,063.3 496.6 2,431.3 2,372.1 2,260.7 135.3 88.3 39.2
2006 1,138.7 231.2 818.0 152.7 47.6 4.3 66.9 26.2 1,486.0 100.3 2,050.6 464.3 2,407.9 2,312.9 2,593.8 135.1 97.5 37.3
2005 908.5 195.5 757.7 139.1 41.4 4.3 65.5 22.4 1,496.8 89.4 1,699.7 496.6 1,931.7 2,330.8 2,372.7 168.7 104.0 26.4
2004 805.8 191.0 596.2 107.7 42.1 3.4 78.6 31.8 1,023.5 83.8 1,334.5 399.9 2,257.3 2,481.5 2,687.5 172.1 189.6 33.1
2003 888.1 200.1 627.0 93.1 39.5 5.5 87.7 27.5 1,264.0 86.0 1,519.8 487.0 2,732.7 2,650.3 2,733.0 183.6 188.0 42.8

City-data.com crime index counts serious crimes and violent crime more heavily. It adjusts for the number of visitors and daily workers commuting into cities. (higher means more crime, U.S. average = 301.1)


Crime per year
Type City-data.com crime indexRobberiesMurdersRapesAssaultsBurglariesTheftAuto theftArson
Year DetroitVirginia BeachDetroitVirginia BeachDetroitVirginia BeachDetroitVirginia BeachDetroitVirginia BeachDetroitVirginia BeachDetroitVirginia BeachDetroitVirginia BeachDetroitVirginia Beach
2019 835.7 132.5 2,342 193 280 30 958 79 9,454 280 6,841 532 14,880 6,850 6,890 582 790 43
2018 840.8 126.9 2,310 175 261 16 1,006 91 9,916 296 7,467 592 15,062 6,698 6,451 578 853 43
2017 851.9 139.5 2,638 273 267 14 711 103 10,126 239 8,264 756 14,074 7,601 8,167 462 870 51
2016 871.0 160.4 2,942 266 302 21 594 133 9,885 282 8,829 866 13,980 8,512 8,960 510 556 70
2015 793.0 156.7 3,448 270 287 19 527 120 7,639 235 7,874 957 14,520 8,634 8,114 438 845 95
2014 869.2 154.9 3,573 250 298 17 557 115 9,194 285 9,179 1,051 13,724 8,448 10,092 366 491 60
2013 964.9 179.2 4,771 305 316 17 613 147 8,801 269 11,758 1,409 17,198 9,413 11,602 447 611 99
2012 983.7 176.9 4,850 327 386 21 442 57 9,345 346 13,504 1,574 15,992 9,706 11,514 483 561 124
2011 996.0 187.7 4,976 414 344 15 426 65 9,508 290 16,032 2,045 16,500 9,716 11,227 452 958 133
2010 1,075.6 203.3 5,539 429 310 14 403 53 10,721 335 17,078 2,164 18,127 10,501 12,604 660 1,082 135
2009 903.0 210.6 6,007 448 363 19 334 66 11,390 363 19,236 2,043 18,801 10,812 12,892 566 636 108
2008 924.0 211.8 6,325 529 323 14 334 73 11,000 424 18,425 1,929 19,536 10,082 16,096 643 718 135
2007 1,061.5 221.2 6,567 552 392 16 335 85 12,396 431 17,764 2,165 20,933 10,341 19,464 590 760 171
2006 1,138.7 231.2 7,235 676 421 19 592 116 13,143 444 18,137 2,056 21,297 10,241 22,941 598 862 165
2005 908.5 195.5 6,826 621 373 19 590 100 13,485 399 15,313 2,217 17,403 10,406 21,376 753 937 118
2004 805.8 191.0 5,451 478 385 15 719 141 9,358 372 12,202 1,775 20,640 11,014 24,573 764 1,734 147
2003 888.1 200.1 5,817 409 366 24 814 121 11,727 378 14,100 2,140 25,353 11,647 25,356 807 1,744 188

City-data.com crime index counts serious crimes and violent crime more heavily. It adjusts for the number of visitors and daily workers commuting into cities. (higher means more crime, U.S. average = 301.1)

Sex Offenders

According to our data, there are 3,441 registered sex offenders living in Detroit and 706 registered sex offenders living in .
The ratio of residents to sex offenders in Detroit is 196 to 1; the ratio in Virginia Beach is 641 to 1.
The number of registered sex offenders compared to the number of residents is much larger in Detroit than that in Virginia Beach.

Cost of Living

The cost of living in Detroit is lower than the national average, making it attractive for individuals and families on a budget. On the other hand, Virginia Beach has a slightly higher than average cost of living, influenced by higher housing prices and a stronger job market.

Income Tax

Michigan has a flat state income tax rate of 4.25%, while Virginia adopts a progressive income tax system, ranging from 2% to 5.75%.

Property Tax

Property taxes are notably higher in Michigan than in Virginia, affecting homeownership costs.

Sales Tax

Both Michigan and Virginia have comparative sales tax rates, with Michigan slightly lower at 6% compared to Virginia's 5.3%-7%, depending on localities.
Income
Type Detroit Virginia Beach
Estimated median household income $36,140 $81,634
Estimated per capita income $22,122 $42,498
Cost of living index (U.S. average is 100) 94.1 97

If you make $50,000 in Detroit, you will have to make $51,541 in Virginia Beach to maintain the same standard of living.

Geographical Conditions

Detroit is located near the Detroit River, Great Lakes, and has a flat topography. Virginia Beach's geography is defined by its positioning on the Atlantic Coast, providing an attractive coastal environment.
Geographical information
Type Detroit Virginia Beach
Land area 138.8 sq. miles 248.3 sq. miles
Population density 4,557.7 people per sq. mile 1,843.3 people per sq. mile
Elevation 600 feet 15 feet
Relative area comparison
Detroit, MI Virginia Beach, VA
First ancestry reported - percentage
Ancestry DetroitVirginia Beach
Arab 1.0% 0.0%
German 0.6% 5.8%
Polish 0.5% 1.1%
Irish 0.4% 5.5%
Italian 0.3% 3.3%
English 0.3% 7.5%
French Canadian 0.1% 0.4%
French 0.1% 0.8%
Dutch 0.1% 0.3%
Scottish 0.1% 1.3%
Greek 0.0% 0.4%
Norwegian 0.0% 0.7%
Russian 0.0% 0.4%
Scotch-Irish 0.0% 1.0%
Swedish 0.0% 0.3%
Ukrainian 0.0% 0.3%
Welsh 0.0% 0.3%
Population origin - absolute values
Ancestry DetroitVirginia Beach
Arab 4,957 8
German 2,855 13,125
Polish 2,445 2,419
Irish 1,841 12,541
English 1,433 17,018
Italian 1,311 7,520
French 669 1,775
Scottish 510 2,948
French Canadian 295 870
Dutch 290 638
Ukrainian 206 575
Scotch-Irish 123 2,234
Greek 118 903
Swedish 99 574
Lithuanian 88 349
Welsh 85 574
Norwegian 83 1,488
Hungarian 67 240
Russian 59 841
West Indian 49 384
Foreign born residents - absolute values
Type Count
Region DetroitVirginia Beach
All 35,800 42,126
Africa 1,995 2,040
Asia 14,401 22,222
Europe 1,827 6,229
Latin America 16,941 10,813
North America 1,050 928
Oceania 15 153
Foreign born residents - percentage
Type Percentage
Region DetroitVirginia Beach
All 5.6% 9.2%
Africa 0.3% 0.4%
Asia 2.2% 4.9%
Europe 0.3% 1.4%
Latin America 2.6% 2.4%
North America 0.2% 0.2%

Education

Both Detroit and Virginia Beach offer quality education, including public, private, and higher education institutions. However, Virginia Beach is often ranked higher when it comes to education, with schools such as Virginia Beach City Public Schools recognized for their performance.
School enrollment
Type Detroit Virginia Beach
Nursery, preschool 6,502 (4.5%) 6,122 (5.8%)
Kindergarten 6,872 (4.8%) 4,600 (4.3%)
Grade 1 to 4 33,114 (23.1%) 20,032 (18.8%)
Grade 5 to 8 32,708 (22.8%) 23,712 (22.3%)
Grade 9 to 12 34,919 (24.3%) 22,713 (21.4%)
College undergrad 23,566 (16.4%) 22,460 (21.1%)
Graduate or professional 5,896 (4.1%) 6,692 (6.3%)
Students in private schools - absolute values
Type Count
Grade DetroitVirginia Beach
Grades 1 to 8 (elementary and middle school) 7,097 6,955
Grades 9 to 12 (high school) 3,222 1,851
Undergraduate colleges 4,972 5,722
Students in private schools - percentage
Type Percentage
Grade DetroitVirginia Beach
Grades 1 to 8 (elementary and middle school) 10.8% 15.9%
Grades 9 to 12 (high school) 9.2% 8.2%
Undergraduate colleges 21.1% 25.5%
Educational attainment
Type Detroit Virginia Beach
Less than high school 15.8% 4.7%
High school or equiv. 33.9% 22.2%
Less than 1 year of college 7% 7.6%
1 or more years of college 17.9% 14%
Associate degree 7.3% 9.3%
Bachelor's degree 10.6% 27.1%
Master's degree 5.9% 11.1%
Profess. school degree 1% 2.7%
Doctorate degree 0.6% 1.3%
Education level (25-year-olds and older)
Type Detroit Virginia Beach
Bachelor's degree or higher 18.1% 42.2%
Graduate or professional degree 7.6% 15.2%
High school or higher 84.2% 95.3%

Work and Economy

Detroit historically relies on the auto industry with the presence of the 'Big Three' auto manufacturers. However, it's currently evolving with a growing presence in technology, healthcare, and arts. Virginia Beach is fueled by military, agribusiness, and tourism.

Biggest Employers

Detroit's biggest employers are General Motors, Ford, and Quicken Loans. In Virginia Beach, the prominent employers include the Navy, Geico, and STIHL, Inc.
Employment and residency - absolute values
Kind DetroitVirginia Beach
Work and live in this city 154,933 127,961
Work and live in this county 164,849 169,655
Workers who work outside the city they live in 796,337 297,296
Workers who work outside the county they live in 51,083 72,833
Working at home 32,626 38,703
Not working at home 183,306 203,785
Employment and residency - percentage
Kind DetroitVirginia Beach
Work and live in this city 48.5% 57.5%
Work and live in this county 76.3% 70.0%
Workers who work outside the city they live in 51.5% 42.5%
Workers who work outside the county they live in 23.7% 30.0%
Working at home 15.1% 16.0%
Not working at home 84.9% 84.0%
Geographical mobility: all
Type all
Mobility DetroitVirginia Beach
Same house 1 year ago 89.6% 84.1%
Moved from abroad 0.5% 0.6%
Moved within same county 6.0% 7.4%
Moved from different state 1.3% 4.7%
Moved within same state 2.6% 3.3%
Geographical mobility: Asian
Type Asian
Mobility DetroitVirginia Beach
Same house 1 year ago 73.5% 86.0%
Moved from abroad 5.0% 0%
Moved within same county 7.6% 7.4%
Moved from different state 9.6% 4.1%
Moved within same state 4.3% 2.5%
Geographical mobility: Black
Type Black
Mobility DetroitVirginia Beach
Same house 1 year ago 92.2% 81.4%
Moved from abroad 0.2% 0%
Moved within same county 5.1% 6.5%
Moved from different state 0.6% 7.0%
Moved within same state 1.9% 5.1%
Geographical mobility: White
Type White
Mobility DetroitVirginia Beach
Same house 1 year ago 82.4% 85.7%
Moved from abroad 0.8% 0.4%
Moved within same county 8.1% 7.5%
Moved from different state 3.4% 3.7%
Moved within same state 5.3% 2.8%
Building permits
Type Average valueCount
City DetroitVirginia BeachDetroitVirginia Beach
1997 $116,700 $131,100 74 1,223
1998 $203,500 $114,100 79 1,468
1999 $116,800 $125,600 158 1,300
2000 $169,400 $130,200 72 1,312
2001 $94,200 $123,500 56 1,636
2002 $155,800 $126,000 184 1,896
2003 $110,600 $129,400 382 1,758
2004 $126,900 $134,100 350 971
2005 $132,000 $144,400 277 894
2006 $134,300 $154,100 249 681
2007 $127,700 $200,500 154 821
2008 $108,900 $182,500 85 501
2009 $87,600 $181,600 32 503
2010 $190,100 $181,300 134 529
2011 $170,500 $180,000 18 535
2012 $188,900 $176,400 4 594
2013 $219,900 $174,300 21 733
2014 $235,400 $178,500 33 688
2015 $239,200 $176,900 31 696
2016 $253,800 $213,200 25 768
2017 $258,600 $214,400 59 646
2018 $258,500 $197,100 52 534
2019 $265,000 $175,900 30 667
2020 $278,000 $187,400 18 493
2021 $285,000 $278,800 10 335

There were 10 building permits issued in Detroit in 2012 (8 less than in 2011) compared to 335 building permits issued in Virginia Beach in 2012 (200 less than in 2011).

In Detroit (Wayne County), 73.1% voted for Democrats and 26.2% for Republicans in 2012 Presidential Election. In Virginia Beach (Virginia Beach city), 48.1% voted for Democrats and 50.7% for Republicans.

Elections
Type DemocratsRepublicansOther
Year DetroitVirginia BeachDetroitVirginia BeachDetroitVirginia Beach
2020 68.6% 51.6% 30.4% 46.2% 1.0% 2.2%
2016 66.6% 44.8% 29.4% 48.4% 4.0% 6.8%
2012 73.1% 48.1% 26.2% 50.7% 0.6% 1.2%
2008 74.4% 49.3% 24.7% 50.1% 0.9% 0.6%
2004 69.7% 40.4% 29.9% 59.3% 0.4% 0.4%
2000 69.1% 41.8% 29.1% 56.1% 1.8% 2.1%
1996 69.0% 41.4% 24.0% 50.6% 7.0% 8.0%
Breakdown of population affiliated with a religious congregation
Type AdherentsCongregations
Religion DetroitVirginia BeachDetroitVirginia Beach
CATHOLIC CHURCH 16.3% 10.7% 11.2% 4.2%
MUSLIM ESTIMATE 3.7% 0.8% 2.9% 0.4%
AMERICAN BAPTIST CHURCHES IN THE USA 1.5% 0.4% 2.4% 0.4%
LUTHERAN CHURCH 1.2% 0.2% 3.9% 0.8%
EVANGELICAL LUTHERAN CHURCH IN AMERICA 0.7% 0.4% 2.8% 1.5%
EPISCOPAL CHURCH 0.4% 1.4% 2.5% 4.2%
SEVENTH DAY ADVENTIST CHURCH 0.4% 0.1% 1.4% 1.1%
SOUTHERN BAPTIST CONVENTION 0.4% 4.9% 3.2% 13.6%
EVANGELICAL PRESBYTERIAN CHURCH 0.3% 0.3% 0.3% 0.4%

Weather

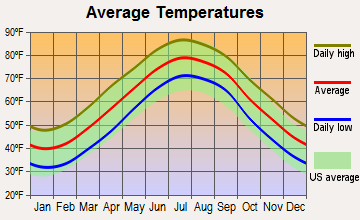
Detroit experiences a Midwest weather pattern, with cold, snowy winters and warm summers. Virginia Beach, lying on the Atlantic Ocean, has a humid subtropical climate, offering milder winters and hot, humid summers. The ocean's influence in Virginia Beach can also lead to hurricanes, which are virtually absent in Detroit's weather patterns.
Weather and climate
Type Detroit Virginia Beach
Temperature - Average 50°F 59.7°F
Humidity - Average morning or afternoon humidity 75.3% 73%
Humidity - Differences between morning and afternoon humidity 33% 32%
Humidity - Maximum monthly morning or afternoon humidity 86% 83%
Humidity - Minimum monthly morning or afternoon humidity 53% 51%
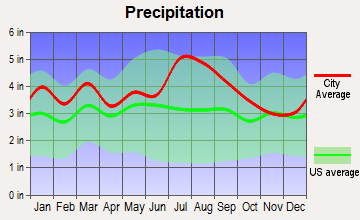
Precipitation - Yearly average 33.6 in 45.9 in
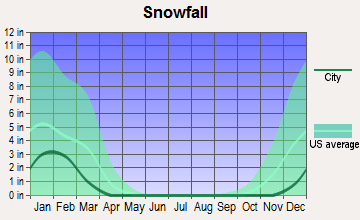
Snowfall - Yearly average 86.5 in 15.4 in
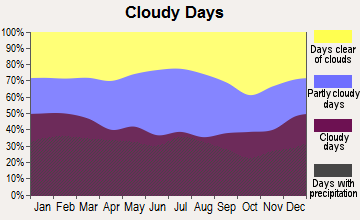
Clouds - Number of days clear of clouds 12.7% 17.6%
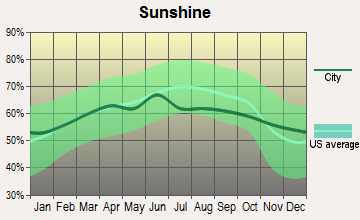
Sunshine amount - Average 56.8% 66.8%
Sunshine amount - Differences during a year 38% 14%
Sunshine amount - Maximum monthly 69% 67%
Sunshine amount - Minimum monthly 31% 53%
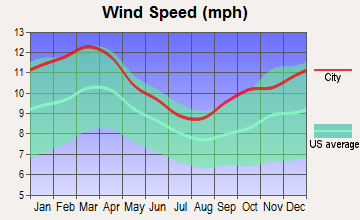
Wind speed - Average 10.2 mph 10.4 mph

Average climate in Detroit, Michigan

Chicago, Illinois average temperatures Chicago, Illinois average precipitation Chicago, Illinois humidity Chicago, Illinois wind speed Chicago, Illinois snowfall Chicago, Illinois sunshine Chicago, Illinois clear and cloudy days
 

Average climate in Virginia Beach, Virginia

Chicago, Illinois average temperatures Chicago, Illinois average precipitation Chicago, Illinois humidity Chicago, Illinois wind speed Chicago, Illinois snowfall Chicago, Illinois sunshine Chicago, Illinois clear and cloudy days
 

Air pollution
Type AQICONO2OZONEPBPM25SO2
Year DetroitVirginia BeachDetroitVirginia BeachDetroitVirginia BeachDetroitVirginia BeachDetroitVirginia BeachDetroitVirginia BeachDetroitVirginia Beach
2018 90 57 0.44 0.27 12.9 6.3 25.8 31.3 N/A 0.002 10.1 6.1 1.1 0.4
2017 87 60 0.56 0.22 12.7 6.8 20.9 33.2 N/A 0.002 10.1 6.9 1.3 0.3
2016 86 66 0.47 0.21 13.2 6.5 22.0 31.7 N/A 0.002 10.9 6.1 0.8 0.4
2015 95 57 0.49 0.27 14.8 7.3 26.5 33.8 N/A 0.002 11.9 6.4 1.2 0.5
2014 95 59 0.48 0.27 14.2 7.5 24.2 33.8 N/A 0.002 12.0 6.8 1.7 1.1
2013 80 66 0.53 0.28 14.4 7.1 24.5 31.2 N/A 0.002 11.0 6.8 1.3 1.1
2012 99 76 0.49 0.29 14.6 7.8 25.7 34.6 N/A 0.002 6.6 8.1 1.7 1.1
2011 94 66 0.32 0.27 12.9 9.2 24.3 35.1 N/A 0.003 6.5 8.8 1.6 1.7
2010 96 71 0.28 0.25 11.8 4.8 24.7 38.4 0.006 0.004 12.1 N/A 1.6 2.2
2009 68 51 0.27 0.25 12.7 9.7 23.4 31.5 N/A 0.012 N/A N/A 1.9 2.6
2008 67 77 0.27 0.23 12.8 10.3 N/A 36.2 N/A 0.004 N/A N/A 2.0 3.3
2007 81 81 0.29 0.18 13.7 12.2 25.8 36.3 0.017 0.004 N/A N/A N/A 4.3
2006 63 62 0.31 0.32 14.0 N/A 19.8 36.2 0.022 0.004 N/A N/A 3.2 3.4
2005 83 67 0.36 0.28 17.4 N/A 22.6 35.4 0.019 N/A N/A N/A 4.0 3.4
2004 70 80 0.43 0.30 15.0 15.9 N/A 33.3 0.014 N/A N/A N/A 3.7 4.3
2003 86 84 0.40 0.34 18.5 16.2 N/A 34.3 0.013 N/A N/A N/A 4.8 3.9
2002 88 99 0.36 0.40 18.3 17.8 N/A 38.0 0.019 N/A N/A N/A 4.3 5.9
2001 83 92 0.36 0.42 19.0 18.2 N/A 36.3 0.020 N/A N/A N/A 4.4 6.0
2000 71 85 0.35 0.44 18.2 15.7 N/A 36.5 0.027 N/A N/A N/A 5.2 6.5
Natural disasters
Type Detroit Virginia Beach
Tornado activity compared to U.S. average 128.5% 61.5%
Earthquake activity compared to U.S. average 53.2% 35.2%
Natural disasters compared to U.S. average 14% 0%

Transportation

Detroit has limited public transportation options and, given its historical link to the auto industry, is very car-centric. Virginia Beach also relies on cars but offers better commuting experiences due to more developed infrastructure.
Transport
Type Detroit Virginia Beach
Amtrak stations 1 1
Amtrak stations nearby 3 2
FAA registered aircraft 93 374
FAA registered aircraft manufacturers and dealers 3 4
Means of transportation to work
Type Detroit Virginia Beach
Bicycle 0.5% 0.2%
Bus 4% 1%
Carpooled 7.5% 9.5%
Car alone 83.4% 84.2%
Motorcycle 0% 0.1%
Taxicab 0.5% 0%
Walked 2.7% 3.2%
Means of transportation to work
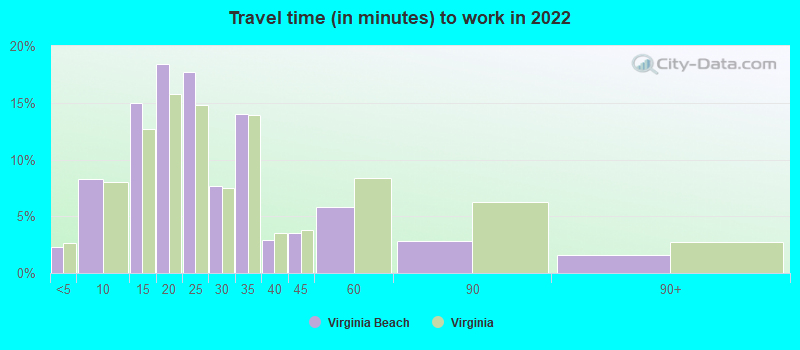
Average travel time to work
Type Detroit Virginia Beach
Average 30.6 min 24.8 min
Other means 26 min 23.7 min
Public transportation 47.7 min 41.9 min
Travel time to work
Time leaving to work
Travel time to work
Time leaving to work
Private vehicle occupancy
Type Detroit Virginia Beach
Average 1.2 1.1
Drove alone 87.1% 90.3%
In 2 person carpool 10.5% 8%
In 3 person carpool 1% 1.3%
In 4 person carpool 1% 0.2%
In 5-6 person carpool 0.3% 0.1%
In 7+ person carpool 0.2% 0%

How many people usually rode to work in the car, truck or van.

Real Estate

Real-estate in Detroit is notably affordable compared to the national average. Virginia Beach, being a coastal city, has higher prices, particularly near the waterfront.

Neighborhoods

Detroit's neighborhoods vary with diverse ethnic enclaves. Some areas are undergoing gentrification, while others are more rundown. Virginia Beach is generally safe and well-maintained, renowned for the consistent quality of life across neighborhoods.
Houses and residents
Type Detroit Virginia Beach
Houses 322,906 190,981
Average household size (people) 2.6 2.6
Median year apartment built 1953 1988
Median year house/condo built 1946 1983
Length of stay in the house since moving in 16.7 years 13.5 years
Houses occupied 251,729 (78%) 182,775 (95.7%)
Houses occupied by owners 129,084 (51.3%) 119,144 (65.2%)
Houses occupied by renters 122,645 (48.7%) 63,631 (34.8%)
Median rent asked for vacant for-rent units $798.06 $1,833
Median monthly housing costs $755 $1,490
Median price asked for vacant for-sale houses and condos $86,452 $508,833
Estimated median house or condo value $69,300 $328,500
Median numbers of rooms 5.7 6
Median number of rooms in apartments 5 4.6
Median number of rooms in houses and condos 6.3 7
Median house price - detached houses $96,752 $459,164
Median house price - in 2-unit structures $72,631 $200,674
Median house price - in 3-to-4-unit structures $183,952 $279,464
Median house price - in 5 or more unit structures $242,851 $229,647
Median house price - mobile homes $43,864 $143,239
Median house price - Townhouses or other attached units $128,652 $261,878
Median house price - All housing units $101,554 $401,957
Median house age 74 36
Renting percentage 48.9% 34.7%
Housing density (houses/condos per square mile) 2,326.9 769.2
House value disparities 48.4% 29%
Household income disparities 49.3% 40.6%
Median household income for houses/condes with a mortgage $61,259 $104,941
Median household income for apartments without a mortgage $38,901 $82,507
Housing units without a mortgage 2,599 (5.6%) 2,373 (2.6%)
Housing units with both a second mortgage and home equity loan 2,270 (4.9%) 9,070 (10%)
Housing units with a mortgage 43,675 (94.4%) 88,748 (97.4%)
Housing units with a home equity loan 357 (0.8%) 287 (0.3%)
Housing units with a second mortgage 3,466 (7.5%) 10,952 (12%)
House/condo owner moved in on average (years ago) 16 10
House/condo renter moved in on average (years ago) 4 1
Housing units lacking complete kitchen facilities 17.1% 1%
Housing units lacking complete plumbing facilities 13.6% 0.4%
Housing units in structures
Housing units in structures DetroitVirginia Beach
One, detached 66.0% 53.2%
One, attached 6.1% 18.3%
Two 6.5% 1.7%
3 or 4 2.7% 4.6%
5 to 9 2.2% 9.0%
10 to 19 2.7% 4.5%
20 to 49 3.9% 2.1%
50 or more 9.4% 5.4%
Mobile homes 0.5% 1.1%
Median real estate property taxes paid for housing units
Type Detroit Virginia Beach
With mortgages $1,551 (1.5%) $2,594 (0.8%)
With no mortgages $1,214 (2.1%) $2,958 (0.9%)
Marital status
Type Detroit Virginia Beach
Divorced 12.1% 11.3%
Never married 55.5% 30.5%
Now married 24.2% 51.4%
Separated 2.6% 1.8%
Widowed 5.7% 5%
Class of workers - percentage
Class of Workers DetroitVirginia Beach
Employee of private company 71.4% 61.1%
Private not-for-profit wage and salary workers 10.0% 8.4%
Self-employed workers in own not incorporated business 5.3% 4.5%
Local government workers 4.2% 9.7%
State government workers 3.9% 3.0%
Self-employed in own incorporated business 2.7% 4.4%
Federal government workers 2.3% 8.9%
Unpaid family workers 0.2% 0.1%
Class of workers - absolute values
Class of Workers DetroitVirginia Beach
Employee of private company 159,185 135,469
Federal government workers 5,090 19,637
Local government workers 9,443 21,482
Private not-for-profit wage and salary workers 22,322 18,672
Self-employed in own incorporated business 5,967 9,812
Self-employed workers in own not incorporated business 11,725 9,992
State government workers 8,763 6,577
Unpaid family workers 441 251

Industries and Occupations

Detroit's primary industries are automotive, manufacturing, healthcare, and technology. In contrast, Virginia Beach focuses more on defense, tourism, agriculture, and aquaculture.
Most common male industries
Industry DetroitVirginia Beach
Manufacturing 23.1% 9.7%
Administrative and support and waste management services 10.8% 4.7%
Retail trade 10.6% 10.6%
Construction 8.6% 7.7%
Transportation and warehousing 8.1% 5.1%
Accommodation and food services 6.9% 8.5%
Health care and social assistance 6.2% 5.8%
Other services, except public administration 4.6% 5.0%
Educational services 4.4% 6.6%
Professional, scientific, and technical services 3.7% 12.9%
Finance and insurance 2.7% 3.5%
Public administration 2.6% 11.1%
Arts, entertainment, and recreation 2.3% 2.6%
Wholesale trade 1.7% 1.9%
Real estate and rental and leasing 1.7% 1.7%
Utilities 0.9% 0.8%
Information 0.8% 1.4%
Agriculture, forestry, fishing and hunting 0.2% 0.2%
Management of companies and enterprises 0.1% 0.0%
Most common female industries
Industry DetroitVirginia Beach
Health care and social assistance 24.8% 21.3%
Retail trade 11.1% 11.1%
Manufacturing 10.8% 3.1%
Accommodation and food services 8.6% 8.6%
Educational services 8.0% 13.5%
Finance and insurance 6.7% 6.8%
Administrative and support and waste management services 5.9% 3.2%
Public administration 5.0% 5.1%
Other services, except public administration 4.8% 5.3%
Transportation and warehousing 3.9% 2.8%
Professional, scientific, and technical services 3.7% 9.4%
Arts, entertainment, and recreation 1.7% 3.2%
Information 1.3% 2.1%
Real estate and rental and leasing 1.2% 1.7%
Utilities 0.9% 0.4%
Wholesale trade 0.9% 1.1%
Construction 0.5% 1.3%
Agriculture, forestry, fishing and hunting 0.2% 0.0%
Management of companies and enterprises 0.1% 0.0%
Most common male occupations
Occupation DetroitVirginia Beach
Production occupations 15.1% 5.6%
Material moving occupations 12.2% 5.2%
Transportation occupations 8.5% 3.8%
Construction and extraction occupations 8.2% 5.8%
Building and grounds cleaning and maintenance occupations 7.2% 4.0%
Management occupations 6.4% 11.7%
Food preparation and serving related occupations 6.3% 6.1%
Sales and related occupations 6.1% 8.3%
Office and administrative support occupations 5.4% 5.0%
Firefighting and prevention, and other protective service workers including supervisors 3.6% 2.5%
Installation, maintenance, and repair occupations 3.5% 7.2%
Computer and mathematical occupations 2.6% 7.8%
Architecture and engineering occupations 2.2% 5.7%
Educational instruction, and library occupations 2.2% 3.4%
Business and financial operations occupations 2.2% 5.4%
Arts, design, entertainment, sports, and media occupations 1.5% 2.9%
Healthcare support occupations 1.5% 0.5%
Personal care and service occupations 1.3% 1.4%
Community and social service occupations 1.0% 1.2%
Health diagnosing and treating practitioners and other technical occupations 0.8% 2.7%
Most common female occupations
Occupation DetroitVirginia Beach
Office and administrative support occupations 16.6% 16.1%
Sales and related occupations 10.1% 10.1%
Healthcare support occupations 9.9% 3.6%
Production occupations 6.8% 2.7%
Management occupations 6.3% 9.4%
Building and grounds cleaning and maintenance occupations 6.1% 2.3%
Educational instruction, and library occupations 5.8% 11.6%
Food preparation and serving related occupations 5.7% 6.3%
Material moving occupations 4.7% 1.7%
Business and financial operations occupations 4.3% 7.8%
Community and social service occupations 4.2% 1.9%
Health diagnosing and treating practitioners and other technical occupations 3.7% 8.6%
Health technologists and technicians 3.2% 3.2%
Personal care and service occupations 2.8% 4.8%
Transportation occupations 1.8% 1.2%
Firefighting and prevention, and other protective service workers including supervisors 1.6% 0.6%
Arts, design, entertainment, sports, and media occupations 1.4% 2.3%
Computer and mathematical occupations 1.2% 1.9%
Legal occupations 1.0% 1.1%
Food environment data per 10,000 residents
Food environment statistics DetroitVirginia Beach
Number of convenience stores (no gas) 2.6 2.4
Number of convenience stores (with gas) 1.5 1.6
Number of full-service restaurants 5.1 9.9
Number of grocery stores 2.8 1.6
Number of supercenters and club stores 0.1 0.1
Food environment - absolute values
Food environment statistics DetroitVirginia Beach
Number of convenience stores (no gas) 523 106
Number of convenience stores (with gas) 294 69
Number of full-service restaurants 1,019 430
Number of grocery stores 556 71
Number of supercenters and club stores 18 6
Obesity and diabetes
Food environment statistics rate DetroitVirginia Beach
Adult diabetes rate 11.6% 9.6%
Adult obesity rate 33.2% 25.4%
Low-income preschool obesity rate 12.9% 13.1%

Health Care

Detroit has reputable healthcare institutions, including the Detroit Medical Center and Henry Ford Health System. Virginia Beach also boasts prominent health systems such as Sentara Healthcare.
Health (county statistics)
Type Detroit Virginia Beach
General health status score of residents in this county from 1 (poor) to 5 (excellent) 3.3 3.5
Average weight of females (lbs) 170 lbs 167.4 lbs
Average weight of males (lbs) 198.3 lbs 199.8 lbs
Residents visited a dentist within the past year 67.5% 72.5%
Residents exercised in the past month 69.5% 73.3%
Adult residents drank alcohol in the past 30 days 70.7% 53.2%
Residents smoked 100+ cigarettes in their lives 49.9% 43.6%

Fatal vehicle accidents per 100,000 residents
Type Total count per 100,000Drunk per 100,000Fatal count per 100,000Pedestrian count per 100,000Person count per 100,000Vehicle count per 100,000
Year DetroitVirginia BeachDetroitVirginia BeachDetroitVirginia BeachDetroitVirginia BeachDetroitVirginia BeachDetroitVirginia Beach
2021 21.7 7.2 0.0 0.0 23.7 7.4 7.4 1.7 46.0 13.5 33.8 12.5
2020 27.3 5.4 6.1 2.2 29.9 5.7 9.1 2.0 62.8 10.0 45.1 8.3
2019 15.5 4.2 6.0 1.6 17.2 4.9 4.6 0.4 37.3 10.4 25.4 8.2
2018 15.0 7.3 6.1 2.2 15.9 8.2 5.9 0.9 34.1 17.8 23.6 14.0
2017 14.5 5.3 5.8 2.9 15.4 5.6 5.0 1.3 35.3 8.9 23.9 7.8
2016 16.1 3.8 4.7 0.9 17.6 4.2 5.5 0.9 37.2 9.3 23.3 6.4
2015 16.9 3.6 5.4 1.8 19.1 3.6 8.1 1.3 38.4 7.3 27.1 4.7
2014 16.2 5.8 3.1 1.6 18.4 6.4 6.8 2.2 35.0 10.9 23.5 8.4
2013 15.2 5.8 3.2 2.2 16.6 6.0 7.8 0.2 32.4 14.3 24.1 9.1
2012 13.7 3.4 3.6 1.1 14.8 3.4 5.3 0.9 29.5 6.0 21.4 4.9
2011 10.2 5.4 1.7 1.6 11.0 5.4 3.8 0.7 23.4 8.1 16.3 7.2
2010 12.3 4.1 4.9 1.1 13.0 4.3 3.5 1.1 28.3 8.7 18.1 6.6
2009 10.8 6.0 3.5 3.0 12.4 6.7 4.2 1.4 32.2 12.7 18.1 8.8
2008 9.6 6.7 3.9 3.7 10.4 7.2 3.4 1.2 25.1 13.0 14.2 9.5
2007 11.7 5.5 3.7 2.5 13.2 5.8 3.9 1.2 31.0 11.5 17.7 7.8
2006 9.9 4.6 3.8 3.2 11.0 5.0 3.6 0.9 24.2 10.3 14.7 8.2
2005 11.3 6.6 4.5 1.6 12.3 7.1 4.8 2.1 31.0 16.2 18.3 10.5
2004 12.4 4.8 4.2 2.3 13.3 5.0 5.1 1.6 29.7 10.5 17.0 7.3
2003 14.0 5.7 3.7 2.5 15.4 6.2 5.2 1.4 38.4 13.5 21.0 7.6
2002 15.1 5.8 6.7 2.3 16.1 6.5 6.6 1.2 40.4 13.7 22.3 9.3
2001 15.1 6.3 5.2 3.0 16.2 7.3 4.9 2.1 41.6 15.7 23.4 9.6
2000 14.3 5.6 4.9 1.6 15.8 5.6 6.0 0.5 38.5 15.3 22.2 9.6
1999 15.4 5.3 5.7 2.3 16.1 5.3 6.9 1.6 44.5 9.5 23.5 6.9
1998 16.1 4.4 4.5 0.9 17.7 4.6 6.2 1.4 45.5 10.0 24.1 6.3
1997 14.7 5.8 3.9 2.1 16.8 7.0 4.6 1.4 45.8 13.5 23.3 8.8
1996 15.6 7.0 3.8 3.0 16.2 7.5 5.6 0.9 46.6 18.4 23.8 12.4
1995 15.6 4.7 4.9 1.2 17.1 5.1 5.7 0.7 41.5 12.4 23.8 7.5
1994 11.2 4.9 3.7 1.6 12.3 5.9 3.5 1.9 31.6 11.3 17.8 5.9
1993 11.8 6.6 3.4 3.8 12.4 7.3 3.8 1.2 31.9 17.0 17.3 9.2
1992 12.5 5.1 4.1 2.9 13.5 6.0 4.4 1.4 40.4 15.2 18.6 8.7
1991 12.0 5.7 2.1 4.0 12.6 6.5 4.6 1.7 30.9 14.4 17.0 8.2
1990 11.6 6.8 3.1 3.0 12.9 7.6 0.0 0.0 33.5 21.2 17.7 11.6
1989 11.2 8.4 3.3 4.5 12.1 8.7 0.0 0.0 29.9 24.5 16.9 13.2
1988 13.8 7.9 4.7 3.8 15.0 8.4 0.0 0.0 38.5 22.4 20.8 13.1
1987 11.2 11.0 4.2 6.2 11.8 12.7 0.0 0.0 34.9 31.1 16.8 18.7
1986 9.4 13.8 2.8 10.3 10.3 14.7 0.0 0.0 29.5 29.9 13.8 21.1
1985 13.3 8.2 3.7 6.1 14.3 9.2 0.0 0.0 35.2 18.6 18.6 12.5
1984 10.4 10.2 3.2 5.4 10.9 11.1 0.0 0.0 28.0 25.4 15.4 15.3
1983 9.0 11.6 3.6 7.6 9.4 11.9 0.0 0.0 24.7 23.6 13.6 14.3
1982 8.5 9.7 2.8 5.9 9.2 10.1 0.0 0.0 24.1 22.2 12.7 13.5
1981 11.2 12.0 4.0 8.0 12.1 13.1 0.0 0.0 28.9 27.2 14.9 17.1
1980 12.4 11.4 5.2 5.3 13.1 11.8 0.0 0.0 31.6 22.9 16.6 13.7
1979 13.3 14.6 5.3 6.3 13.6 16.6 0.0 0.0 33.6 33.6 17.7 17.8
1978 12.4 12.7 5.5 4.9 13.1 13.5 0.0 0.0 29.9 32.4 16.4 20.5
1977 13.5 12.8 4.9 6.0 14.3 14.0 0.0 0.0 35.2 30.2 17.8 17.0
1976 12.6 15.0 2.7 0.4 13.5 15.5 0.0 0.0 32.2 38.9 16.9 20.8
1975 12.3 15.7 2.7 0.5 13.2 16.1 0.0 0.0 31.4 40.5 16.6 21.6

Fatal vehicle accidents
Type Total countDrunkFatal countPedestrian countPerson countVehicle count
Year DetroitVirginia BeachDetroitVirginia BeachDetroitVirginia BeachDetroitVirginia BeachDetroitVirginia BeachDetroitVirginia Beach
1975 167 34 36 1 179 35 0 0 427 88 225 47
1976 167 34 36 1 179 35 0 0 427 88 225 47
1977 175 30 64 14 185 33 0 0 456 71 231 40
1978 157 31 69 12 166 33 0 0 379 79 208 50
1979 164 37 66 16 168 42 0 0 415 85 219 45
1980 149 30 62 14 158 31 0 0 380 60 200 36
1981 133 33 48 22 144 36 0 0 343 75 177 47
1982 99 28 33 17 108 29 0 0 281 64 148 39
1983 103 35 41 23 108 36 0 0 284 71 157 43
1984 118 32 36 17 124 35 0 0 317 80 175 48
1985 148 27 41 20 160 30 0 0 393 61 207 41
1986 103 47 31 35 113 50 0 0 324 102 151 72
1987 121 39 45 22 128 45 0 0 377 110 181 66
1988 147 29 50 14 159 31 0 0 409 82 221 48
1989 117 32 35 17 126 33 0 0 313 93 177 50
1990 119 27 32 12 133 30 0 0 345 84 182 46
1991 123 23 21 16 129 26 47 7 316 58 174 33
1992 127 21 42 12 137 25 45 6 411 63 189 36
1993 119 28 34 16 125 31 38 5 323 72 175 39
1994 113 21 37 7 124 25 35 8 319 48 179 25
1995 157 20 49 5 172 22 57 3 417 53 239 32
1996 155 30 38 13 161 32 56 4 464 79 237 53
1997 143 25 38 9 164 30 45 6 447 58 227 38
1998 156 19 44 4 171 20 60 6 440 43 233 27
1999 149 23 55 10 155 23 67 7 429 41 227 30
2000 136 24 47 7 150 24 57 2 366 65 211 41
2001 141 27 49 13 152 31 46 9 390 67 219 41
2002 140 25 62 10 150 28 61 5 375 59 207 40
2003 130 25 34 11 143 27 48 6 356 59 195 33
2004 115 21 39 10 123 22 47 7 274 46 157 32
2005 104 29 41 7 113 31 44 9 286 71 169 46
2006 91 20 35 14 101 22 33 4 222 45 135 36
2007 107 24 34 11 121 25 36 5 284 50 162 34
2008 88 29 36 16 95 31 31 5 229 56 130 41
2009 98 26 32 13 113 29 38 6 293 55 165 38
2010 88 18 35 5 93 19 25 5 202 38 129 29
2011 72 24 12 7 78 24 27 3 165 36 115 32
2012 96 15 25 5 104 15 37 4 207 27 150 22
2013 105 26 22 10 114 27 54 1 223 64 166 41
2014 110 26 21 7 125 29 46 10 238 49 160 38
2015 115 16 37 8 130 16 55 6 261 33 184 21
2016 109 17 32 4 119 19 37 4 252 42 158 29
2017 98 24 39 13 104 25 34 6 238 40 161 35
2018 101 33 41 10 107 37 40 4 230 80 159 63
2019 104 19 40 7 115 22 31 2 250 47 170 37
2020 174 25 39 10 191 26 58 9 401 46 288 38
2021 137 33 0 0 150 34 47 8 291 62 214 57
Police full-time law enforcement employees
Year DetroitVirginia Beach
2021 3,100 964
2020 3,149 925
2019 3,126 938
2018 3,019 953
2017 3,084 984
2016 2,855 951
2015 2,436 953
2014 2,675 964
2013 2,632 955
2012 2,883 955
2011 3,087 945
2010 3,210 938
2009 3,273 944
2008 3,401 968
2007 3,403 962
2006 3,509 955
2005 3,695 951
2004 4,612 931
2003 4,387 946
Police full-time law enforcement employees (per 1,000 residents)
Year DetroitVirginia Beach
2021 4.6 2.1
2020 4.8 2.1
2019 4.7 2.1
2018 4.5 2.1
2017 4.6 2.2
2016 4.3 2.1
2015 3.6 2.1
2014 3.9 2.1
2013 3.8 2.1
2012 4.1 2.1
2011 4.3 2.1
2010 4.5 2.1
2009 3.6 2.2
2008 3.8 2.2
2007 4.0 2.2
2006 4.0 2.2
2005 4.1 2.1
2004 5.0 2.1
2003 4.7 2.2
Local government: full-time employees
Job DetroitVirginia Beach
Airports 4 0
Financial administration 435 397
Firefighters 972 498
Fire - other 263 19
Health 38 623
Judicial and legal 435 260
Local libraries 302 188
Other and unallocable 763 419
Other government administration 377 228
Parks and recreation 221 676
Police - other 423 21
Police protection - officers 3,009 882
Sewerage 154 284
Solid waste management 154 144
Streets and highways 166 220
Totals for government 9,072 15,888
Transit 927 0
Water supply 309 259
Local government: part-time employees
Job Detroit
Correction 35
Elementary and secondary - instruction 1,509
Natural resources 2
Other and unallocable 1
Other government administration 12
Parks and recreation 865
Police - other 1
Police protection - officers 53
Streets and highways 1
Totals for government 3,896
Place of birth - Foreign born
Residents DetroitVirginia Beach
All residents 5.3% 8.4%
American Indian / Alaska Native residents 12.5% 13.2%
Asian residents 77.3% 53.8%
Black or African American residents 0.6% 3.0%
Native Hawaiian / Pacific Islander residents 6.1% 6.9%
Other race residents 31.1% 34.2%
Two or more races residents 12.2% 9.5%
White residents 11.6% 3.3%
White alone, not Hispanic / Latino residents 14.2% 3.2%
Place of birth - Native, outside of US
Residents DetroitVirginia Beach
All residents 1.3% 2.8%
American Indian / Alaska Native residents 0.0% 17.6%
Asian residents 0.0% 6.6%
Black or African American residents 0.3% 1.6%
Native Hawaiian / Pacific Islander residents 0.0% 15.4%
Other race residents 6.5% 7.0%
Two or more races residents 2.7% 7.7%
White residents 3.0% 1.9%
White alone, not Hispanic / Latino residents 3.1% 1.7%
Place of birth - Born in state of residence
Residents DetroitVirginia Beach
All residents 78.2% 44.2%
American Indian / Alaska Native residents 67.4% 23.8%
Asian residents 14.9% 24.5%
Black or African American residents 83.6% 56.0%
Native Hawaiian / Pacific Islander residents 77.1% 18.6%
Other race residents 49.9% 23.0%
Two or more races residents 72.0% 47.0%
White residents 66.9% 43.6%
White alone, not Hispanic / Latino residents 65.5% 41.8%
Place of birth - Born in other state
Residents DetroitVirginia Beach
All residents 15.3% 44.6%
American Indian / Alaska Native residents 20.1% 45.4%
Asian residents 7.8% 15.1%
Black or African American residents 15.5% 39.4%
Native Hawaiian / Pacific Islander residents 16.8% 59.1%
Other race residents 12.5% 35.8%
Two or more races residents 13.2% 35.9%
White residents 18.4% 51.2%
White alone, not Hispanic / Latino residents 17.3% 53.3%
English speakers (speaking English at home)
Type Detroit Virginia Beach
Born in the United States residents 94.1% 95.1%
Foreign born residents 15.1% 25%
Native, born elsewhere residents 29.8% 68.7%
Total residents 89.2% 87.8%
Mechanisms of homicide
Mechanism DetroitVirginia Beach
Homicides from 2000 to 2006 3,007 134
Cut / Pierce 231 0
Firearm 2,369 92
Fire / Burn 37 0
Suffocation 58 0
Mechanisms of homicide per 1,000,000 residents
Mechanism DetroitVirginia Beach
Homicides from 2000 to 2006 210.4 44.2
Cut / Pierce 16.2 0
Firearm 165.8 30.3
Fire / Burn 2.6 0
Suffocation 4.1 0
Mechanisms of suicide per 1,000,000 residents
Mechanism DetroitVirginia Beach
Suicides from 2000 to 2006 96.5 98.9
Cut / Pierce 2.2 0
Drowning 1.7 0
Firearm 46.7 49.5
Poisoning 17.1 22.4
Suffocation 25.5 21.1

Infrastructure

Detroit shows signs of aging infrastructure, though regeneration and renovations are underway. Virginia Beach boasts better-maintained infrastructure, benefitting from military and tourist income.
Infrastructure
Type Detroit Virginia Beach
Hospitals 41 7
TV stations 16 24
Bank branches located here 98 96
Bank institutions located here 12 16
Main business address for public companies 11 2
Drinking water stations with no reported violations in the past 5 6
Drinking water stations with reported violations in the past 4 17

Schools

School facilities
Type Detroit Virginia Beach
Private elementary/middle schools 14 17
Private high schools 7 9
Public elementary/middle schools 132 70
Public high schools 68 12
Colleges/Universities 13 13
HMDA - Conventional home purchase loans - Applications denied
Year DetroitVirginia Beach
1999 2,901 0
2000 4,079 0
2001 3,815 0
2002 3,247 0
2003 5,511 941
2004 9,068 1,388
2005 13,958 1,545
2006 16,654 1,502
2007 10,742 1,073
2008 2,823 340
2009 484 167

Culture and Food

Detroit is renowned for its robust arts scene, Motown heritage, and diverse food culture. Virginia Beach has a coastal culture with an emphasis on seafood and outdoor activities.

Sports Teams

Detroit boasts major league teams in every significant American sport. Virginia Beach doesn't have major league teams but residents support regional sports teams.