### Overview
The comparison between East San Gabriel Valley, CA, and Arlington, TX, illustrates distinct contrasts and similarities. Both are cherished destinations, offering unique attractions for tourists and locals alike. They show varying factors in crime rate, weather, cost of living, education, and other essential areas. These concepts will be dissected in our in-depth review.
### Crime/Safety
Crime and safety rates in East San Gabriel Valley, CA, and Arlington, TX, show variance. In East San Gabriel Valley, the crime rate is about the national average, meaning living there is relatively safe compared to other cities. In contrast, the crime rate in Arlington is slightly higher than the national average, although most crimes are property related, and a robust police presence is maintained.
### Weather
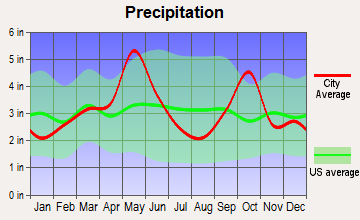
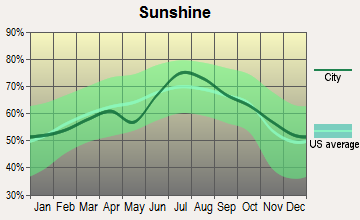
California and Texas, as expected, have significantly different climates. East San Gabriel Valley benefits from a Mediterranean climate with mild, wet winters and hot, dry summers. On the other hand, Arlington experiences a humid subtropical climate characterized by hot, humid summers and mild to cool winters. Both regions, however, enjoy plenty of sunshine throughout the year.
### Cost of Living
Cost of living in East San Gabriel Valley is substantially higher than in Arlington, largely due to California's high housing costs. While goods and services are more expensive in California than the national average, in Arlington, they are slightly below the national average, making it more affordable for living and entertainment.
### Education
Both East San Gabriel Valley and Arlington offer public and private education options. East San Gabriel Valley is served by several school districts and also boasts several colleges. Arlington is part of the Arlington Independent School District and is home to The University of Texas at Arlington. However, the average school ranking tends to be higher in East San Gabriel compared to Arlington.
### Work and Economy
The economies of both regions are vibrant and thriving. East San Gabriel Valley includes Arcadia and West Covina, renowned for their mixed economies that rely on retail, education, and health care. Arlington houses several multinational corporations, with a strong emphasis on entertainment, manufacturing, and educational services, boasting a healthier employment growth rate.
### Infrastructure
Infrastructure in East San Gabriel Valley is well developed with significant investment in public amenities. In Arlington, there has been a focus on development evident in the downtown revitalization projects and the district around AT&T Stadium. However, both cities could improve in the area of public transit infrastructure.
### Industries and Occupations
In East San Gabriel Valley, major industries include health care, education, and tourism. In contrast, Arlington's economy is buoyed by industries like entertainment, aerospace, education, and health services. Both cities have a diverse range of job opportunities across multiple sectors.
### Biggest Employers
The prominent employers in San Gabriel Valley are health care institutions, educational bodies, and local government. In Arlington, the biggest employers are in the public sector, with Arlington Independent School District and the University of Texas at Arlington contributing significantly to employment. Large commercial entities like General Motors and Texas Health Resources also play prominent roles.
### Real-Estate
The real estate market in East San Gabriel Valley is markedly more expensive than in Arlington, with the median home cost several times higher. Arlington has a much more accessible housing market, with a median home price well below the national average.
### Neighborhoods
Both regions boast of diverse and vibrant neighborhoods. East San Gabriel Valley has neighborhoods ranging from the upper-middle-class suburban Arcadia to the more urban West Covina. Arlington's neighborhoods range from the bustling downtown area to the quieter suburban zones.
### Transportation/Public Transit/Commuting
East San Gabriel Valley is served by numerous bus lines and the Metro Gold Line, offering several options for public transit. Arlington, while having comprehensive road networks and highways, lacks a substantial public transit system, often leading to traffic congestion.
### City/State Sales Tax
The sales tax in California is notably higher than in Texas. East San Gabriel Valley imposes a 9.5% sales tax, whereas Arlington has an 8% rate, meaning shopping can be slightly less expensive in the latter.
### City/State Income Tax
As for income tax, California has one of the highest state income taxes in the U.S. In contrast, Texas does not levy a state income tax, a significant relief to Arlington residents' wallets.
### City/State Property Tax
When it comes to property tax, both cities have relatively high rates. East San Gabriel Valley, being part of Los Angeles County, has a property tax rate around 1.16%. On the other hand, Arlington, situated in Tarrant County, has a property tax rate of about 2.32%.
### Culture/Food
East San Gabriel Valley has a rich culture due to its diversity, with a strong influence of Asian culture reflected in its cuisine and cultural events. Arlington, with its Texan charm, offers a combination of Southern hospitality and multicultural influences, with a food culture popular for BBQ, Mexican, and Southern staples.
### Sports Teams
For sports enthusiasts, Arlington is home to two Major League teams: the Texas Rangers (Baseball) and the Dallas Cowboys (Football). East San Gabriel Valley doesn't host any major sports teams directly but is within an easy reach of the considerable LA market that accommodates the Lakers, Dodgers, Rams, and more.
### Geographical Conditions
Geographically, East San Gabriel Valley benefits from being both coastal and mountainous, offering picturesque landscapes. Arlington, however, is part of the Texas prairie, with flat terrains and less dramatic landscapes.
### Health Care
Excellent health care options are available in both cities. East San Gabriel Valley is home to various reputed hospitals, including the City of Hope National Medical Center. On the other hand, Arlington has the Texas Health Arlington Memorial Hospital and several other top-rated medical facilities.
### Final Summary
East San Gabriel Valley, CA, and Arlington, TX both make appealing destinations for different reasons. East San Gabriel Valley stands out for its superior education, diverse culture, and excellent infrastructure. Its high cost of living and taxes, however, may deter some. In contrast, Arlington's lower living costs, professional sports, and lack of state income tax could be luring factors, despite a slightly higher crime rate and less effective public transportation. Both cities offer a rich life, with varying attractions, providing different, but still compelling life experiences.
In East San Gabriel Valley (Los Angeles County), 69.7% voted for Democrats and 27.8% for Republicans in 2012 Presidential Election. In Arlington (Tarrant County), 41.4% voted for Democrats and 57.1% for Republicans.
Elections
Type
Democrats
Republicans
Other
Year
East San Gabriel Valley
Arlington
East San Gabriel Valley
Arlington
East San Gabriel Valley
Arlington
2020
71.0%
49.3%
26.9%
49.1%
2.1%
1.6%
2016
72.0%
43.2%
22.5%
51.8%
5.5%
5.0%
2012
69.7%
41.4%
27.8%
57.1%
2.4%
1.4%
2008
69.2%
43.8%
28.8%
55.5%
1.9%
0.7%
2004
63.3%
37.0%
35.7%
62.5%
1.0%
0.5%
2000
63.6%
36.9%
32.4%
60.9%
4.0%
2.3%
1996
59.3%
41.6%
31.0%
50.9%
9.7%
7.5%
Breakdown of population affiliated with a religious congregation
Type
Adherents
Congregations
Religion
East San Gabriel Valley
Arlington
East San Gabriel Valley
Arlington
CATHOLIC CHURCH
36.1%
11.1%
4.7%
1.9%
SOUTHERN BAPTIST CONVENTION
1.0%
17.3%
9.0%
33.3%
MUSLIM ESTIMATE
0.7%
2.2%
1.0%
0.9%
AMERICAN BAPTIST CHURCHES IN THE USA
0.5%
0.0%
3.1%
0.1%
SEVENTH DAY ADVENTIST CHURCH
0.5%
0.4%
2.4%
1.6%
EPISCOPAL CHURCH
0.4%
0.3%
1.4%
0.8%
LUTHERAN CHURCH
0.2%
0.5%
1.6%
0.9%
Weather and climate
Type
East San Gabriel Valley
Arlington
Temperature - Average
62.7°F
65°F
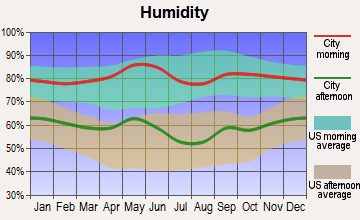
Humidity - Average morning or afternoon humidity
64.7%
71.4%
Humidity - Differences between morning and afternoon humidity
19.6%
34%
Humidity - Maximum monthly morning or afternoon humidity
70.7%
82%
Humidity - Minimum monthly morning or afternoon humidity
51%
48%
Precipitation - Yearly average
19.1 in
37.9 in
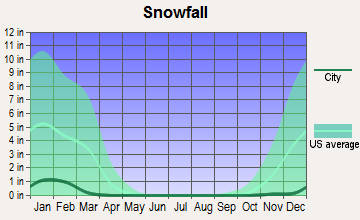
Snowfall - Yearly average
0 in
4.2 in
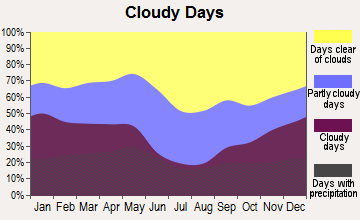
Clouds - Number of days clear of clouds
28.3%
22.7%
Sunshine amount - Average
78.4%
66.6%
Sunshine amount - Differences during a year
22%
20%
Sunshine amount - Maximum monthly
85%
74%
Sunshine amount - Minimum monthly
63%
54%
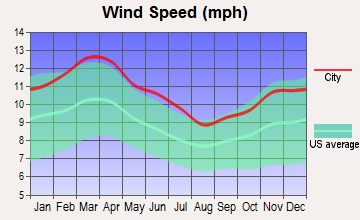
Wind speed - Average
3.7 mph
10.3 mph
Average climate in East San Gabriel Valley, California
Average climate in Arlington, Texas
Air pollution
Type
AQI
CO
NO2
OZONE
PB
PM10
PM25
SO2
Year
East San Gabriel Valley
Arlington
East San Gabriel Valley
Arlington
East San Gabriel Valley
Arlington
East San Gabriel Valley
Arlington
East San Gabriel Valley
East San Gabriel Valley
East San Gabriel Valley
Arlington
East San Gabriel Valley
Arlington
2018
143
86
0.36
N/A
14.1
5.8
29.2
27.1
0.007
N/A
29.6
N/A
13.4
9.4
0.3
0.4
2017
150
86
0.35
N/A
14.8
6.2
30.5
27.2
0.007
N/A
32.7
N/A
12.6
9.1
0.3
0.3
2016
141
76
0.31
N/A
15.5
6.3
29.3
25.5
0.007
N/A
30.3
N/A
12.0
8.2
0.3
0.2
2015
145
80
0.30
N/A
15.2
6.5
30.4
24.8
0.007
N/A
30.0
N/A
14.6
8.6
0.2
0.3
2014
142
78
0.32
0.22
16.8
6.8
29.7
26.6
0.008
N/A
33.6
N/A
11.7
9.3
0.3
0.3
2013
147
96
0.33
0.25
17.0
6.4
27.7
27.2
0.007
N/A
31.5
N/A
11.5
11.0
0.4
0.2
2012
149
108
0.39
0.26
18.3
7.8
27.5
30.3
0.005
N/A
30.9
N/A
15.6
10.5
0.6
0.3
2011
149
96
0.40
0.23
18.6
8.2
26.7
30.7
0.008
N/A
30.3
N/A
17.3
9.5
0.5
0.6
2010
139
76
0.44
0.23
19.3
8.9
26.8
27.7
N/A
N/A
26.6
N/A
14.8
8.4
0.4
0.7
2009
156
91
0.40
0.25
21.0
8.7
28.0
29.5
0.010
N/A
26.0
N/A
16.5
8.5
0.6
0.5
2008
156
92
0.48
0.25
22.7
9.6
27.7
25.8
0.012
N/A
27.0
N/A
15.1
10.7
1.0
0.5
2007
135
95
0.52
0.30
25.3
10.6
24.8
24.6
0.014
N/A
N/A
N/A
N/A
9.8
1.3
0.5
2006
128
102
0.55
0.34
25.1
10.4
24.0
29.7
0.009
N/A
N/A
N/A
N/A
9.9
1.9
0.8
2005
127
110
0.59
0.34
25.7
11.7
22.8
28.4
0.014
N/A
N/A
N/A
N/A
11.3
1.9
1.0
2004
132
90
0.68
0.39
25.4
10.8
24.6
25.4
0.016
N/A
N/A
N/A
N/A
N/A
1.7
0.9
2003
137
97
0.80
0.40
29.9
11.1
24.7
27.2
0.021
N/A
N/A
N/A
N/A
N/A
1.4
1.0
2002
134
97
0.83
0.37
31.4
11.8
23.1
25.8
0.021
N/A
N/A
N/A
N/A
N/A
2.0
0.6
2001
141
88
1.00
0.48
31.8
14.7
21.4
25.0
0.029
N/A
N/A
N/A
N/A
N/A
2.1
1.1
2000
150
104
1.05
0.55
34.7
14.5
20.7
26.2
0.027
N/A
N/A
N/A
N/A
N/A
2.0
1.3
Natural disasters
Type
East San Gabriel Valley
Arlington
Tornado activity compared to U.S. average
18.5%
254.3%
Earthquake activity compared to U.S. average
7,292.4%
558.3%
Natural disasters compared to U.S. average
57%
23%
Transport
Type
East San Gabriel Valley
Arlington
Amtrak stations nearby
3
2
FAA registered aircraft
0
362
FAA registered aircraft manufacturers and dealers
0
5
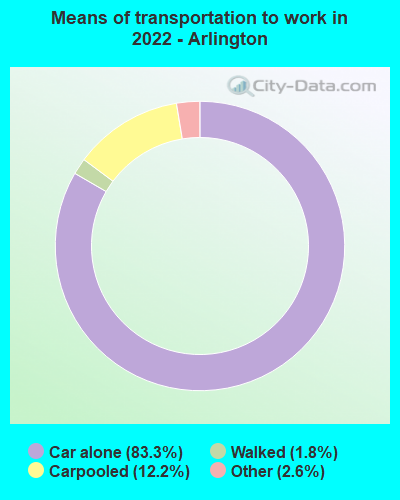
Means of transportation to work
Type
East San Gabriel Valley
Arlington
Bicycle
0.6%
0.2%
Bus
2.9%
0%
Carpooled
17.1%
11.9%
Car alone
73.3%
85%
Motorcycle
0.2%
0.1%
Railroad
0.6%
0%
Walked
2.2%
1.4%
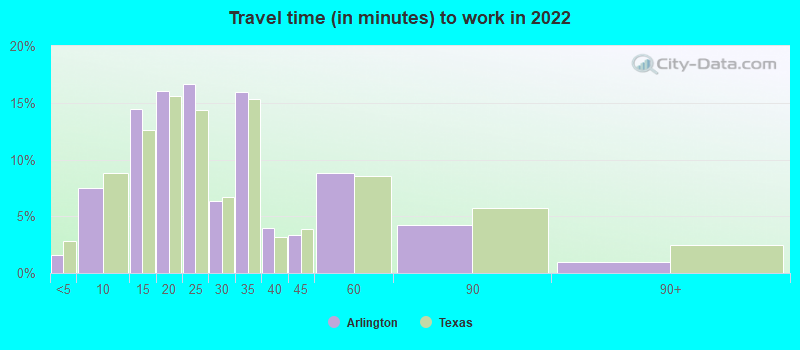
Average travel time to work
Type
East San Gabriel Valley
Arlington
Average
32.3 min
26.1 min
Houses and residents
Type
East San Gabriel Valley
Arlington
Houses
270,240
156,653
Average household size (people)
3.5
2.7
Houses occupied
263,338 (97.4%)
146,888 (93.8%)
Houses occupied by owners
180,683 (68.6%)
78,883 (53.7%)
Houses occupied by renters
82,655 (31.4%)
68,005 (46.3%)
Median rent asked for vacant for-rent units
$1,935
$1,609
Median price asked for vacant for-sale houses and condos
$1,138,428
$199,415
Estimated median house or condo value
$643,048
$254,700
Median number of rooms in apartments
3.7
4.1
Median number of rooms in houses and condos
5.9
6.5
Renting percentage
32.3%
42.6%
Housing density (houses/condos per square mile)
1,270.8
1,634.9
Household income disparities
40.3%
43.9%
Housing units without a mortgage
26,635 (16.4%)
948 (2%)
Housing units with both a second mortgage and home equity loan
515 (0.3%)
1,684 (3.6%)
Housing units with a mortgage
136,243 (83.6%)
46,456 (98%)
Housing units with a home equity loan
11,429 (7%)
0 (0%)
Housing units with a second mortgage
21,150 (13%)
1,967 (4.1%)
Housing units lacking complete kitchen facilities
1%
1.7%
Housing units lacking complete plumbing facilities
 East San Gabriel Valley, CA
 Arlington, TX