In this article, we will compare the East San Gabriel Valley, California, and Atlanta, Georgia, offering a comprehensive view of these locations for both potential residents and tourists alike. We will examine a comparator of their crime and safety rates, the differences in their climates, and the disparity in their cost of living. We will also consider education, the status of their respective economies, their infrastructures, and the primary industries and occupations. Following from this, we shall discuss each location's largest employers, the state of their real estate markets and neighborhoods, and the efficiency of their public transit. Lastly, we'll contrast their taxes, vibrant cultures and foods, sports teams, geographical conditions, and healthcare systems, providing a robust comparison of these two distinctive areas.
The crime rate in East San Gabriel Valley is considerably lower than Atlanta. According to data, residents of Atlanta are more likely to become victims of violent crimes compared to the national average. That said, in both cities, there are neighborhood-focused initiatives to improve safety and reduce crime. Nonetheless, for tourists, most attractions in both cities are in safe, well-policed areas.
Cost of Living
The cost of living in East San Gabriel Valley is higher than the national average and significantly more than in Atlanta. This is particularly true for housing. However, Atlanta has experienced an increase in living costs over the past years, especially in terms of housing as well.
Income Tax
Residents of California also face higher state income taxes compared to those in Georgia. California has a graduated income tax system with rates as high as 13.3% for the wealthiest individuals.
Property Tax
While the cost of living is higher in California, Georgia has a higher property tax rate than California. The average property tax rate in Georgia is around 0.93%, whereas in California, it's around 0.73%.
Sales Tax
California has a higher state sales tax than Georgia at 7.25% versus Georgia's 4%. However, local municipalities can add additional sales taxes in both states so the effective rate can vary.
Income
Type
East San Gabriel Valley
Atlanta
Estimated median household income
$95,242
$74,107
Estimated per capita income
$34,474
$55,051
Cost of living index (U.S. average is 100)
150.2
104.3
If you make $50,000 in Atlanta, you will have to make $72,004 in East San Gabriel Valley to maintain the same standard of living.
Geographical Conditions
East San Gabriel Valley is known for its beautiful hilly terrain and mild weather. Atlanta sits in the foothills of the Appalachian Mountains, featuring many hills and trees, with a landscape that offers a balance of urban and nature environments.
Geographical information
Type
East San Gabriel Valley
Atlanta
Land area
212.6 sq. miles
131.7 sq. miles
Population density
4,478.5 people per sq. mile
3,768.3 people per sq. mile
Relative area comparison
East San Gabriel Valley, CA Atlanta, GA
Education
Both areas offer access to high-quality education. East San Gabriel Valley has many top-rated schools and is close to several esteemed colleges. Atlanta is also renowned for its education system, hosting prestigious universities and a robust public school system with many options for charter and private schools.
The East San Gabriel Valley economy is diverse, with strong retail, healthcare, and educational sectors. Atlanta, as a significant transportation hub and business center, has a vibrant economy with strengths in logistics, professional and business services, media operations, and information technology.
Biggest Employers
In East San Gabriel Valley, the largest employers include healthcare providers like Citrus Valley Health Partners and educational institutions. Atlanta's largest employers cover a range, including corporations like The Home Depot, Delta Air Lines, and The Coca-Cola Company.
In East San Gabriel Valley (Los Angeles County), 69.7% voted for Democrats and 27.8% for Republicans in 2012 Presidential Election. In Atlanta (Fulton County), 64.3% voted for Democrats and 34.5% for Republicans.
Elections
Type
Democrats
Republicans
Other
Year
East San Gabriel Valley
Atlanta
East San Gabriel Valley
Atlanta
East San Gabriel Valley
Atlanta
2020
71.0%
72.6%
26.9%
26.2%
2.1%
1.2%
2016
72.0%
67.8%
22.5%
26.9%
5.5%
5.3%
2012
69.7%
64.3%
27.8%
34.5%
2.4%
1.2%
2008
69.2%
67.2%
28.8%
32.2%
1.9%
0.6%
2004
63.3%
59.4%
35.7%
40.0%
1.0%
0.7%
2000
63.6%
57.9%
32.4%
39.9%
4.0%
2.2%
1996
59.3%
58.9%
31.0%
36.9%
9.7%
4.1%
Breakdown of population affiliated with a religious congregation
Type
Adherents
Congregations
Religion
East San Gabriel Valley
Atlanta
East San Gabriel Valley
Atlanta
CATHOLIC CHURCH
36.1%
9.9%
4.7%
2.4%
SOUTHERN BAPTIST CONVENTION
1.0%
7.9%
9.0%
14.7%
MUSLIM ESTIMATE
0.7%
1.4%
1.0%
1.7%
AMERICAN BAPTIST CHURCHES IN THE USA
0.5%
0.8%
3.1%
1.1%
SEVENTH DAY ADVENTIST CHURCH
0.5%
1.2%
2.4%
1.5%
EPISCOPAL CHURCH
0.4%
2.1%
1.4%
2.1%
EVANGELICAL LUTHERAN CHURCH IN AMERICA
0.2%
0.6%
1.9%
1.5%
Weather
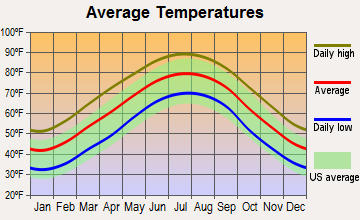
The weather in East San Gabriel Valley is typical of Southern California, offering warm, sunny days with little to no humidity. Atlanta, in contrast, has a more humid subtropical climate with hot, humid summers and mild to chilly winters. Severe weather conditions like thunderstorms are quite common in Atlanta, while in East San Gabriel, earthquakes could pose a risk.
Weather and climate
Type
East San Gabriel Valley
Atlanta
Temperature - Average
62.7°F
61.7°F
Humidity - Average morning or afternoon humidity
64.7%
73.9%
Humidity - Differences between morning and afternoon humidity
19.6%
38%
Humidity - Maximum monthly morning or afternoon humidity
70.7%
87%
Humidity - Minimum monthly morning or afternoon humidity
51%
49%
Precipitation - Yearly average
19.1 in
51.4 in
Snowfall - Yearly average
0 in
4 in
Clouds - Number of days clear of clouds
28.3%
18.3%
Sunshine amount - Average
78.4%
65.6%
Sunshine amount - Differences during a year
22%
17%
Sunshine amount - Maximum monthly
85%
67%
Sunshine amount - Minimum monthly
63%
50%
Wind speed - Average
3.7 mph
9 mph
Average climate in East San Gabriel Valley, California
Average climate in Atlanta, Georgia
Air pollution
Type
AQI
CO
NO2
OZONE
PB
PM10
PM25
SO2
Year
East San Gabriel Valley
Atlanta
East San Gabriel Valley
Atlanta
East San Gabriel Valley
Atlanta
East San Gabriel Valley
Atlanta
East San Gabriel Valley
Atlanta
East San Gabriel Valley
Atlanta
East San Gabriel Valley
Atlanta
East San Gabriel Valley
Atlanta
2018
143
84
0.36
0.27
14.1
N/A
29.2
24.7
0.007
N/A
29.6
17.5
13.4
10.6
0.3
0.8
2017
150
87
0.35
0.31
14.8
N/A
30.5
24.7
0.007
N/A
32.7
17.5
12.6
11.3
0.3
1.2
2016
141
105
0.31
0.31
15.5
N/A
29.3
25.9
0.007
N/A
30.3
17.2
12.0
11.1
0.3
1.0
2015
145
91
0.30
0.31
15.2
N/A
30.4
23.9
0.007
N/A
30.0
17.6
14.6
10.2
0.2
0.9
2014
142
88
0.32
0.31
16.8
N/A
29.7
24.0
0.008
N/A
33.6
18.4
11.7
9.1
0.3
1.1
2013
147
88
0.33
0.30
17.0
N/A
27.7
23.7
0.007
N/A
31.5
18.0
11.5
8.7
0.4
1.0
2012
149
109
0.39
0.33
18.3
N/A
27.5
26.2
0.005
N/A
30.9
19.5
15.6
9.8
0.6
1.1
2011
149
98
0.40
0.33
18.6
N/A
26.7
27.5
0.008
N/A
30.3
21.2
17.3
12.0
0.5
1.7
2010
139
102
0.44
0.35
19.3
N/A
26.8
25.8
N/A
N/A
26.6
18.5
14.8
12.5
0.4
1.9
2009
156
96
0.40
N/A
21.0
N/A
28.0
25.2
0.010
N/A
26.0
18.5
16.5
13.8
0.6
1.7
2008
156
99
0.48
0.53
22.7
15.3
27.7
31.2
0.012
0.003
27.0
22.5
15.1
16.3
1.0
2.5
2007
135
124
0.52
0.45
25.3
17.0
24.8
33.1
0.014
0.003
N/A
29.4
N/A
18.1
1.3
2.7
2006
128
129
0.55
0.58
25.1
17.9
24.0
31.3
0.009
0.003
N/A
22.9
N/A
19.7
1.9
3.4
2005
127
123
0.59
0.55
25.7
17.2
22.8
29.0
0.014
0.005
N/A
25.5
N/A
15.8
1.9
3.2
2004
132
118
0.68
0.54
25.4
16.9
24.6
28.8
0.016
0.004
N/A
22.9
N/A
14.6
1.7
2.8
2003
137
112
0.80
0.56
29.9
16.4
24.7
26.7
0.021
0.004
N/A
22.2
N/A
15.4
1.4
3.0
2002
134
120
0.83
0.60
31.4
19.4
23.1
27.9
0.021
N/A
N/A
23.2
N/A
13.1
2.0
3.0
2001
141
117
1.00
0.69
31.8
23.3
21.4
27.2
0.029
N/A
N/A
27.0
N/A
N/A
2.1
3.1
2000
150
132
1.05
0.50
34.7
22.9
20.7
31.2
0.027
N/A
N/A
28.4
N/A
N/A
2.0
3.2
Natural disasters
Type
East San Gabriel Valley
Atlanta
Tornado activity compared to U.S. average
18.5%
159.5%
Earthquake activity compared to U.S. average
7,292.4%
153.4%
Natural disasters compared to U.S. average
57%
15%
Transportation
Atlanta offers a comprehensive public transportation system with the Metropolitan Atlanta Rapid Transit Authority (MARTA), while commuting in East San Gabriel Valley primarily involves car travel. However, Los Angeles Metro Rail extends into the region, providing additional commuting options.
Transport
Type
East San Gabriel Valley
Atlanta
Amtrak stations
0
1
Amtrak stations nearby
3
1
FAA registered aircraft
0
1
FAA registered aircraft manufacturers and dealers
0
28
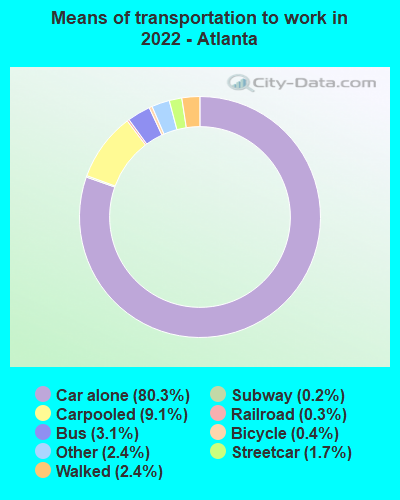
Means of transportation to work
Type
East San Gabriel Valley
Atlanta
Bicycle
0.6%
0.5%
Bus
2.9%
2.1%
Carpooled
17.1%
7.6%
Car alone
73.3%
84%
Motorcycle
0.2%
0.1%
Railroad
0.6%
0.2%
Streetcar
0%
1.1%
Subway
0.1%
0.4%
Taxicab
0%
0.3%
Walked
2.2%
1.9%
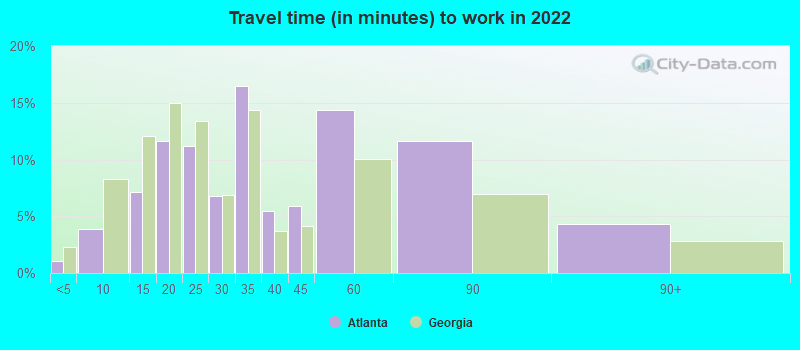
Average travel time to work
Type
East San Gabriel Valley
Atlanta
Average
32.3 min
34.9 min
Real Estate
The real estate market in East San Gabriel Valley is competitive, with home values well above the national average. Conversely, Atlanta has a more affordable housing market, but prices are on the rise due to increased demand.
Neighborhoods
East San Gabriel Valley encompasses many distinct neighborhoods, each with their own unique charm, including Walnut and Diamond Bar. Similarly, Atlanta offers a diverse range of neighborhoods from the chic Buckhead to the artsy Midtown.
Houses and residents
Type
East San Gabriel Valley
Atlanta
Houses
270,240
253,355
Average household size (people)
3.5
2.1
Houses occupied
263,338 (97.4%)
232,720 (91.9%)
Houses occupied by owners
180,683 (68.6%)
113,092 (48.6%)
Houses occupied by renters
82,655 (31.4%)
119,628 (51.4%)
Median rent asked for vacant for-rent units
$1,935
$1,226
Median price asked for vacant for-sale houses and condos
$1,138,428
$325,147
Estimated median house or condo value
$643,048
$375,500
Median number of rooms in apartments
3.7
3.5
Median number of rooms in houses and condos
5.9
6.2
Renting percentage
32.3%
55.1%
Housing density (houses/condos per square mile)
1,270.8
1,923
Household income disparities
40.3%
47.8%
Housing units without a mortgage
26,635 (16.4%)
1,022 (1.3%)
Housing units with both a second mortgage and home equity loan
515 (0.3%)
5,566 (7%)
Housing units with a mortgage
136,243 (83.6%)
78,250 (98.7%)
Housing units with a home equity loan
11,429 (7%)
58 (0.1%)
Housing units with a second mortgage
21,150 (13%)
7,203 (9.1%)
Housing units lacking complete kitchen facilities
1%
2%
Housing units lacking complete plumbing facilities
Self-employed workers in own not incorporated business
25,753
15,892
State government workers
13,845
13,288
Unpaid family workers
1,494
550
Industries and Occupations
Major industries in East San Gabriel Valley include retail trade, healthcare, and social assistance. On the other hand, Atlanta has strengths in logistics, media, IT and software, and the film industry, sometimes referred to as the "Hollywood of the South".
Both regions have access to high-quality healthcare. East San Gabriel Valley hosts several highly rated hospitals and healthcare centers, while Atlanta serves as a healthcare hub for the Southeastern US.
Health (county statistics)
Type
East San Gabriel Valley
Atlanta
General health status score of residents in this county from 1 (poor) to 5 (excellent)
Atlanta boasts advanced infrastructure, from high-speed internet access to an impressive network of highways and Hartsfield-Jackson Atlanta International Airport, the busiest airport in the world. Meanwhile, East San Gabriel Valley, being part of the Greater Los Angeles area, benefits from extensive infrastructure, but traffic congestion can be an issue.
Infrastructure
Type
East San Gabriel Valley
Atlanta
TV stations
24
22
Culture and Food
California's East San Gabriel Valley has a large Asian-American population, resulting in a diverse food scene with a wide variety of Asian cuisines. Meanwhile, Atlanta offers a "southern comfort" food heritage mixed with a diversity of cuisine from around the world, a nod to its status as a multicultural city.
Sports Teams
Atlanta is home to several major sports teams in basketball, football, baseball, and soccer. In contrast, while East San Gabriel Valley does not have its own major sports teams, Los Angeles teams are closely followed, including Lakers, Dodgers, and Rams.
 East San Gabriel Valley, CA
 Atlanta, GA