When comparing the lifestyle in East San Gabriel Valley, California to Buffalo, New York, various aspects need to be considered such as safety, weather, economic prospects, taxes, transportation, education, and cultural experiences. The Mediterranean climate of California and thriving digital economy contrasts sharply with the colder weather and advanced manufacturing economy in Buffalo. While both places offer unique advantages, the ultimate decision will depend on individual preferences, career prospects, and lifestyle choices.
Living in East San Gabriel Valley is generally safer in terms of crime rates compared to Buffalo, NY. Buffalo has a higher crime rate, which might concern those who prioritize safety when choosing a place to live or visit. However, as with any urban area, crime tends to cluster in specific neighborhoods, so experiences can vary significantly within each city.
Cost of Living
Cost of living in East San Gabriel Valley is notably higher compared to Buffalo, NY. This is largely due to California's high housing prices and costs associated with amenities and goods. On the other hand, Buffalo offers a relatively lower cost of living, which can be beneficial for families or individuals on a budget.
Income Tax
Both California and New York have progressive state income tax systems. However, California's top marginal tax rate is higher at 13.3% compared to New York's top rate of 8.82%.
Property Tax
Property taxes in both East San Gabriel Valley and Buffalo can vary significantly based on location, but on average, property taxes tend to be higher in New York. Buffalo, specifically, has a property tax rate of 2.55% compared to East San Gabriel Valley's average of about 0.77%.
Sales Tax
California has a higher state sales tax at 7.25% compared to New York's rate of 4%. However, local sales tax can add up in both places. East San Gabriel Valley has an added local tax that brings the total sales tax rate to 9.5%, whereas in Buffalo, the total can reach 8.75%.
Income
Type
East San Gabriel Valley
Buffalo
Estimated median household income
$95,242
$40,669
Estimated per capita income
$34,474
$27,269
Cost of living index (U.S. average is 100)
150.2
101.9
If you make $50,000 in Buffalo, you will have to make $73,700 in East San Gabriel Valley to maintain the same standard of living.
Geographical Conditions
East San Gabriel Valley, located in Southern California, has a mix of urban areas, parklands, and some hilly terrain, with proximity to beaches, mountain ranges, and desert. Buffalo is located in Western New York, off the shores of Lake Erie, and offers easy access to water-related activities and is close to the beautiful Niagara Falls.
Geographical information
Type
East San Gabriel Valley
Buffalo
Land area
212.6 sq. miles
40.6 sq. miles
Population density
4,478.5 people per sq. mile
6,815.7 people per sq. mile
Relative area comparison
East San Gabriel Valley, CA Buffalo, NY
Education
Both East San Gabriel Valley and Buffalo provide a range of educational opportunities. However, East San Gabriel Valley is close to top-ranking universities like Caltech and the Claremont Colleges. Buffalo, too, is home to prestigious colleges such as the University at Buffalo and Buffalo State College.
The economy in East San Gabriel Valley is diverse with strong sectors in healthcare, education, and professional services. On the other hand, Buffalo's economy historically focused on manufacturing, but recent advancements have led to growth in the healthcare and education sectors. Overall, the economic opportunities can be diverse in both regions depending on your professional background and skills.
Biggest Employers
In East San Gabriel Valley, some of the biggest employers include Citrus Valley Health Partners, Walmart, and Mt. San Antonio Community College. In Buffalo, The State University of New York (SUNY), Kaleida Health, and M&T Bank are among the largest employers.
In East San Gabriel Valley (Los Angeles County), 69.7% voted for Democrats and 27.8% for Republicans in 2012 Presidential Election. In Buffalo (Erie County), 57.4% voted for Democrats and 41.0% for Republicans.
Elections
Type
Democrats
Republicans
Other
Year
East San Gabriel Valley
Buffalo
East San Gabriel Valley
Buffalo
East San Gabriel Valley
Buffalo
2020
71.0%
56.3%
26.9%
41.6%
2.1%
2.1%
2016
72.0%
51.0%
22.5%
44.5%
5.5%
4.5%
2012
69.7%
57.4%
27.8%
41.0%
2.4%
1.6%
2008
69.2%
58.2%
28.8%
40.6%
1.9%
1.3%
2004
63.3%
56.5%
35.7%
41.5%
1.0%
1.9%
2000
63.6%
56.7%
32.4%
37.8%
4.0%
5.5%
1996
59.3%
54.7%
31.0%
32.3%
9.7%
13.0%
Breakdown of population affiliated with a religious congregation
Type
Adherents
Congregations
Religion
East San Gabriel Valley
Buffalo
East San Gabriel Valley
Buffalo
CATHOLIC CHURCH
36.1%
38.4%
4.7%
15.8%
SOUTHERN BAPTIST CONVENTION
1.0%
0.2%
9.0%
2.5%
MUSLIM ESTIMATE
0.7%
1.8%
1.0%
1.9%
AMERICAN BAPTIST CHURCHES IN THE USA
0.5%
0.8%
3.1%
3.6%
SEVENTH DAY ADVENTIST CHURCH
0.5%
0.1%
2.4%
0.6%
EPISCOPAL CHURCH
0.4%
0.8%
1.4%
4.4%
EVANGELICAL LUTHERAN CHURCH IN AMERICA
0.2%
1.7%
1.9%
4.9%
LUTHERAN CHURCH
0.2%
0.9%
1.6%
3.3%
Weather
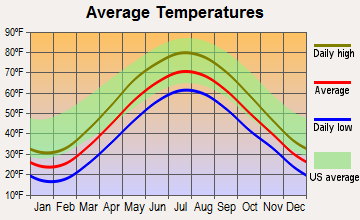
East San Gabriel Valley, CA, offers a warm Mediterranean climate with plenty of sunshine throughout the year, making it an appealing destination for those who prefer warmer weather. Buffalo, in contrast, experiences cold, snowy winter seasons due to its geographical location near the Great Lakes, but the summer season can be beautifully temperate and enjoyable.
Weather and climate
Type
East San Gabriel Valley
Buffalo
Temperature - Average
62.7°F
47.7°F
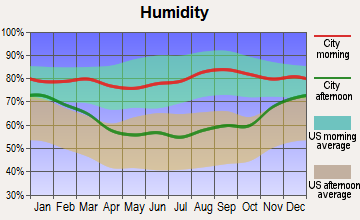
Humidity - Average morning or afternoon humidity
64.7%
76.3%
Humidity - Differences between morning and afternoon humidity
19.6%
28%
Humidity - Maximum monthly morning or afternoon humidity
70.7%
83%
Humidity - Minimum monthly morning or afternoon humidity
51%
55%
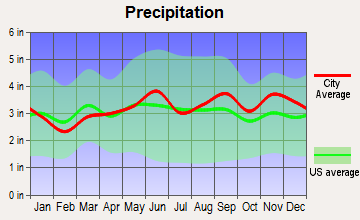
Precipitation - Yearly average
19.1 in
38.7 in
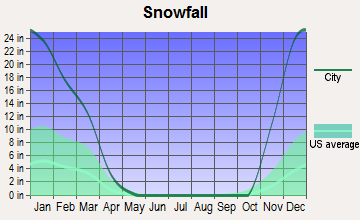
Snowfall - Yearly average
0 in
183.7 in
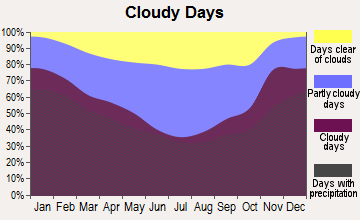
Clouds - Number of days clear of clouds
28.3%
8.9%
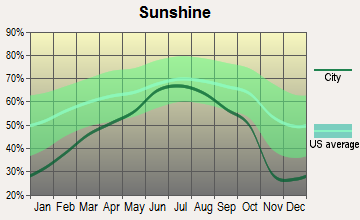
Sunshine amount - Average
78.4%
51.3%
Sunshine amount - Differences during a year
22%
43%
Sunshine amount - Maximum monthly
85%
66%
Sunshine amount - Minimum monthly
63%
23%
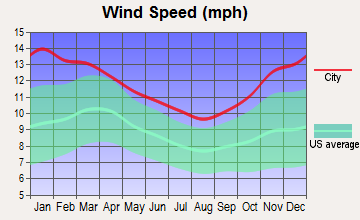
Wind speed - Average
3.7 mph
11.2 mph
Average climate in East San Gabriel Valley, California
Average climate in Buffalo, New York
Air pollution
Type
AQI
CO
NO2
OZONE
PB
PM10
PM25
SO2
Year
East San Gabriel Valley
Buffalo
East San Gabriel Valley
Buffalo
East San Gabriel Valley
Buffalo
East San Gabriel Valley
Buffalo
East San Gabriel Valley
Buffalo
East San Gabriel Valley
East San Gabriel Valley
Buffalo
East San Gabriel Valley
Buffalo
2018
143
62
0.36
0.26
14.1
N/A
29.2
30.2
0.007
N/A
29.6
N/A
13.4
7.5
0.3
0.4
2017
150
68
0.35
0.32
14.8
N/A
30.5
29.8
0.007
N/A
32.7
N/A
12.6
7.5
0.3
0.4
2016
141
71
0.31
0.30
15.5
N/A
29.3
31.7
0.007
N/A
30.3
N/A
12.0
7.7
0.3
0.5
2015
145
69
0.30
0.35
15.2
N/A
30.4
30.2
0.007
N/A
30.0
N/A
14.6
8.8
0.2
1.1
2014
142
69
0.32
0.39
16.8
N/A
29.7
30.7
0.008
N/A
33.6
N/A
11.7
8.6
0.3
1.5
2013
147
73
0.33
0.33
17.0
N/A
27.7
31.4
0.007
N/A
31.5
N/A
11.5
9.0
0.4
2.4
2012
149
83
0.39
0.34
18.3
6.4
27.5
30.5
0.005
N/A
30.9
N/A
15.6
9.4
0.6
2.7
2011
149
82
0.40
0.41
18.6
8.3
26.7
28.8
0.008
N/A
30.3
N/A
17.3
8.9
0.5
2.0
2010
139
85
0.44
0.35
19.3
8.3
26.8
30.6
N/A
N/A
26.6
N/A
14.8
10.3
0.4
1.5
2009
156
78
0.40
0.28
21.0
7.4
28.0
28.7
0.010
N/A
26.0
N/A
16.5
9.8
0.6
1.7
2008
156
90
0.48
0.36
22.7
9.5
27.7
29.5
0.012
N/A
27.0
N/A
15.1
11.4
1.0
2.3
2007
135
97
0.52
0.38
25.3
10.2
24.8
29.5
0.014
N/A
N/A
N/A
N/A
12.4
1.3
2.7
2006
128
76
0.55
0.38
25.1
10.5
24.0
27.4
0.009
N/A
N/A
N/A
N/A
N/A
1.9
2.8
2005
127
94
0.59
0.41
25.7
12.3
22.8
29.7
0.014
N/A
N/A
N/A
N/A
N/A
1.9
3.8
2004
132
76
0.68
0.43
25.4
11.9
24.6
27.6
0.016
N/A
N/A
N/A
N/A
N/A
1.7
3.4
2003
137
89
0.80
0.50
29.9
13.0
24.7
27.6
0.021
0.005
N/A
N/A
N/A
N/A
1.4
5.5
2002
134
100
0.83
0.46
31.4
13.4
23.1
30.5
0.021
0.008
N/A
N/A
N/A
N/A
2.0
5.8
2001
141
93
1.00
0.46
31.8
15.2
21.4
27.9
0.029
0.021
N/A
N/A
N/A
N/A
2.1
7.2
2000
150
85
1.05
0.53
34.7
15.3
20.7
25.6
0.027
0.023
N/A
N/A
N/A
N/A
2.0
6.8
Natural disasters
Type
East San Gabriel Valley
Buffalo
Tornado activity compared to U.S. average
18.5%
26.3%
Earthquake activity compared to U.S. average
7,292.4%
32.9%
Natural disasters compared to U.S. average
57%
22%
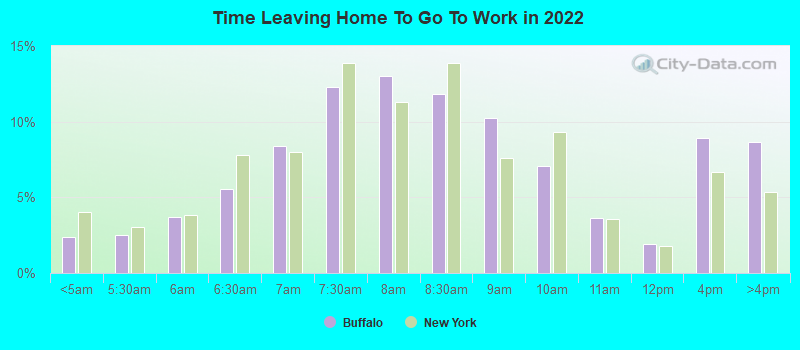
Transportation
Both East San Gabriel Valley and Buffalo offer public transportation systems. East San Gabriel Valley, being part of the larger Los Angeles metro area, has access to the extensive metro and bus system of LA. Buffalo has its NFTA Metro system which includes buses and a light rail transit system.
Transport
Type
East San Gabriel Valley
Buffalo
Amtrak stations nearby
3
3
FAA registered aircraft
0
87
FAA registered aircraft manufacturers and dealers
0
1
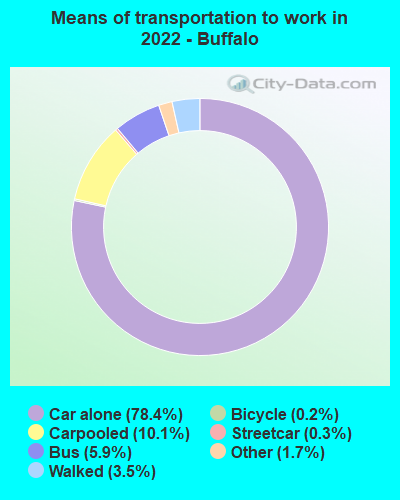
Means of transportation to work
Type
East San Gabriel Valley
Buffalo
Bicycle
0.6%
0.5%
Bus
2.9%
5.8%
Carpooled
17.1%
7.8%
Car alone
73.3%
80.5%
Motorcycle
0.2%
0.1%
Railroad
0.6%
0.2%
Streetcar
0%
0.3%
Subway
0.1%
0.6%
Taxicab
0%
0.3%
Walked
2.2%
3.1%
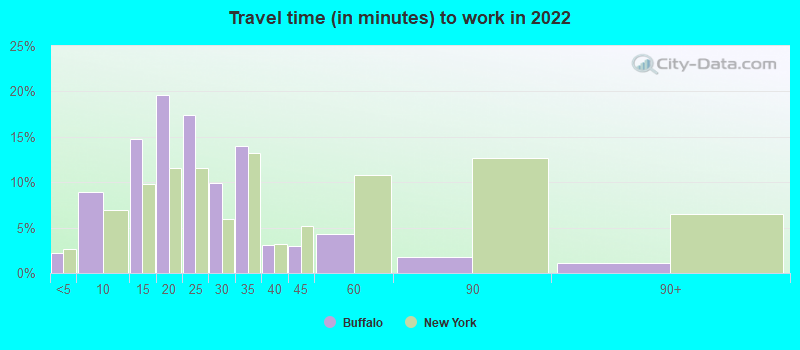
Average travel time to work
Type
East San Gabriel Valley
Buffalo
Average
32.3 min
23.8 min
Real Estate
Real estate in East San Gabriel Valley is considerably more expensive compared to Buffalo, which offers more affordable housing options. Whether you’re looking to buy or rent, you’re likely to find cheaper costs in Buffalo.
Neighborhoods
East San Gabriel Valley has multiple desirable neighborhoods including Walnut, Diamond Bar, and Claremont, known for good schools, safety, and community feel. Buffalo neighborhoods like Elmwood Village and Parkside are praised for their historic architecture, walkability, and strong sense of community.
Houses and residents
Type
East San Gabriel Valley
Buffalo
Houses
270,240
137,222
Average household size (people)
3.5
2.2
Houses occupied
263,338 (97.4%)
122,569 (89.3%)
Houses occupied by owners
180,683 (68.6%)
54,108 (44.1%)
Houses occupied by renters
82,655 (31.4%)
68,461 (55.9%)
Median rent asked for vacant for-rent units
$1,935
$372.33
Median price asked for vacant for-sale houses and condos
$1,138,428
$283,454
Estimated median house or condo value
$643,048
$155,200
Median number of rooms in apartments
3.7
4.9
Median number of rooms in houses and condos
5.9
6.5
Renting percentage
32.3%
59.3%
Housing density (houses/condos per square mile)
1,270.8
3,378.8
Household income disparities
40.3%
50.4%
Housing units without a mortgage
26,635 (16.4%)
2,243 (7.7%)
Housing units with both a second mortgage and home equity loan
515 (0.3%)
1,953 (6.7%)
Housing units with a mortgage
136,243 (83.6%)
26,930 (92.3%)
Housing units with a home equity loan
11,429 (7%)
69 (0.2%)
Housing units with a second mortgage
21,150 (13%)
2,377 (8.1%)
Housing units lacking complete kitchen facilities
1%
5.5%
Housing units lacking complete plumbing facilities
Self-employed workers in own not incorporated business
25,753
5,576
State government workers
13,845
6,135
Unpaid family workers
1,494
313
Industries and Occupations
East San Gabriel Valley is known for its healthcare and professional services sectors, while Buffalo, once a manufacturing hub, now sees a growing presence of education, healthcare, and service jobs. The technology sector is also growing in Buffalo, though it doesn't compare to the tech presence around San Gabriel Valley and Greater Los Angeles.
As for healthcare, both East San Gabriel Valley and Buffalo offer quality medical services. East San Gabriel Valley residents typically use the broader Los Angeles County's robust healthcare system, including highly-rated facilities like Cedars-Sinai and UCLA Medical Center. Buffalo is home to several quality health facilities as well, including Buffalo General Medical Center and Roswell Park Comprehensive Cancer Center.
Health (county statistics)
Type
East San Gabriel Valley
Buffalo
General health status score of residents in this county from 1 (poor) to 5 (excellent)
In terms of infrastructure, both cities offer modern conveniences and amenities, though they each face their own challenges. East San Gabriel Valley, being part of the greater Los Angeles area, sometimes struggles with traffic congestion. Buffalo, despite its size, grapples with ongoing revitalization efforts in certain neighborhoods.
Infrastructure
Type
East San Gabriel Valley
Buffalo
TV stations
24
14
Culture and Food
Both regions offer rich cultural experiences. East San Gabriel Valley has a diverse food scene with strong influences from various Asian cuisines, due to a large Asian-American population. Buffalo has its own rich food culture, famous for Buffalo wings and beef on weck, and the region is culturally linked to the Great Lakes region and Canada, offering a blend of influences in its local festivals, arts, and theater scenes.
Sports Teams
Sports enthusiasts will enjoy either location. East San Gabriel Valley residents support LA teams like the Dodgers (MLB), Lakers (NBA), and Kings (NHL). Buffalo, on the other hand, cheers for the Bills (NFL) and Sabres (NHL), with both teams generating passionate local support.
 East San Gabriel Valley, CA
 Buffalo, NY