The East San Gabriel Valley and the Central Coast in California both offer unique lifestyles, with distinct characteristics in terms of crime and safety, weather, cost of living, and other areas of interest. The former is a mainly suburban area near Los Angeles, while the latter is a scenic region known for its coastline and wine production. This comparison will examine these two locations in a comprehensive manner, providing a detailed picture to those considering relocation or just a visit.
East San Gabriel Valley has crime rates that are much lower than the LA County average, given its suburban nature. Still, it's important to consider the specific neighborhood when evaluating safety. In contrast, the Central Coast has one of the lowest crime rates in California, given its smaller population and more rural character.
Cost of Living
The cost of living in East San Gabriel Valley is relatively high, being part of the LA metropolitan area. This is reflected in various sectors including housing, food, and transportation. On the other hand, the Central Coast is also expensive, particularly due to high housing costs although it generally offers a slightly lower cost of living than East San Gabriel Valley.
Income Tax
California’s income tax is progressive, with rates ranging from 1% to 13.3% depending on income. This applies to both East San Gabriel Valley and the Central Coast.
Property Tax
Typically, properties in California are taxed at a rate of 1% of their assessed value. However, additional levies usually bring the effective property tax rate to around 1.2%.
Sales Tax
Both locations are subject to California’s base state sales tax rate of 7.25%. However, some cities in each location may impose additional local sales taxes.
Income
Type
East San Gabriel Valley
Central Coast
Estimated median household income
$95,242
$106,582
Estimated per capita income
$34,474
$70,103
Cost of living index (U.S. average is 100)
150.2
101.8
If you make $50,000 in Central Coast, you will have to make $73,772 in East San Gabriel Valley to maintain the same standard of living.
Geographical Conditions
East San Gabriel Valley has a mix of suburbs, hills, and valleys offering a wide range of outdoor activities. Central Coast, known for its stunning coastline and wine country, offers plenty of outdoor options from beaches to vineyards.
Geographical information
Type
East San Gabriel Valley
Central Coast
Land area
212.6 sq. miles
50.4 sq. miles
Population density
4,478.5 people per sq. mile
4,732.1 people per sq. mile
Relative area comparison
East San Gabriel Valley, CA Central Coast, CA
Education
East San Gabriel Valley is known for its well-rated schools, particularly in towns like San Marino and Arcadia. Colleges such as the University of La Verne and Mt. San Antonio College are also situated here. The Central Coast is home to several prominent educational institutions including California Polytechnic State University and the University of California, Santa Cruz.
The economy in East San Gabriel Valley is characterized by business services, healthcare, and retail industries. The Central Coast, meanwhile, has a diverse economy focusing on tourism, wine production, and agriculture, alongside a growing tech industry.
Biggest Employers
Major employers in the East San Gabriel Valley include Kaiser Permanente, Citrus Valley Health Partners, and Metro Gold Line. In the Central Coast, significant employers include agriculture companies such as Dole, Driscoll's, and tech firms like Mindbody.
In East San Gabriel Valley (Los Angeles County), 69.7% voted for Democrats and 27.8% for Republicans in 2012 Presidential Election. In Central Coast (Orange County), 45.8% voted for Democrats and 52.0% for Republicans.
Elections
Type
Democrats
Republicans
Other
Year
East San Gabriel Valley
Central Coast
East San Gabriel Valley
Central Coast
East San Gabriel Valley
Central Coast
2020
71.0%
53.6%
26.9%
44.6%
2.1%
1.8%
2016
72.0%
50.9%
22.5%
42.4%
5.5%
6.7%
2012
69.7%
45.8%
27.8%
52.0%
2.4%
2.3%
2008
69.2%
47.8%
28.8%
50.3%
1.9%
1.9%
2004
63.3%
39.3%
35.7%
60.2%
1.0%
0.5%
2000
63.6%
40.4%
32.4%
55.9%
4.0%
3.7%
1996
59.3%
37.9%
31.0%
51.7%
9.7%
10.5%
Breakdown of population affiliated with a religious congregation
Type
Adherents
Congregations
Religion
East San Gabriel Valley
Central Coast
East San Gabriel Valley
Central Coast
CATHOLIC CHURCH
36.1%
26.5%
4.7%
4.4%
SOUTHERN BAPTIST CONVENTION
1.0%
2.3%
9.0%
8.8%
MUSLIM ESTIMATE
0.7%
0.8%
1.0%
1.3%
AMERICAN BAPTIST CHURCHES IN THE USA
0.5%
0.2%
3.1%
1.7%
SEVENTH DAY ADVENTIST CHURCH
0.5%
0.4%
2.4%
1.3%
EPISCOPAL CHURCH
0.4%
0.4%
1.4%
1.4%
EVANGELICAL LUTHERAN CHURCH IN AMERICA
0.2%
0.4%
1.9%
2.3%
LUTHERAN CHURCH
0.2%
0.6%
1.6%
2.0%
REFORMED CHURCH IN AMERICA
0.1%
0.3%
0.2%
0.2%
Weather
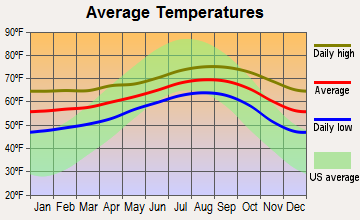
The weather in East San Gabriel Valley is typically warm, with temperatures ranging from the 60s to the 80s year-round. However, it can experience sweltering periods during the summer. The Central Coast has a more temperate climate with generally cooler temperatures, particularly appealing to those who prefer mild weather all year long.
Weather and climate
Type
East San Gabriel Valley
Central Coast
Temperature - Average
62.7°F
62.4°F
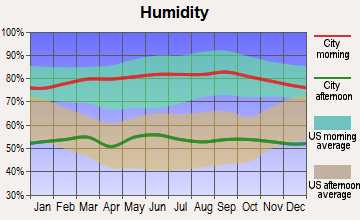
Humidity - Average morning or afternoon humidity
64.7%
69.7%
Humidity - Differences between morning and afternoon humidity
19.6%
26%
Humidity - Maximum monthly morning or afternoon humidity
70.7%
78.1%
Humidity - Minimum monthly morning or afternoon humidity
51%
52%
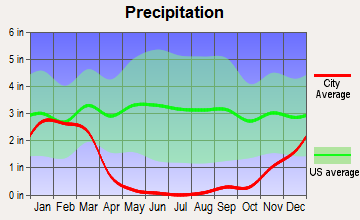
Precipitation - Yearly average
19.1 in
12.1 in
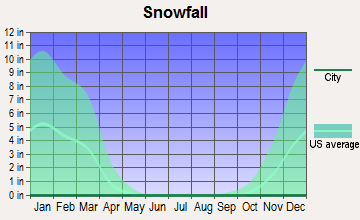
Snowfall - Yearly average
0 in
0 in
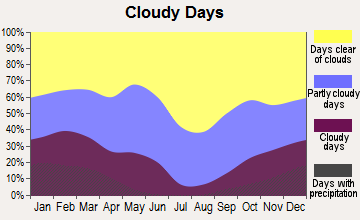
Clouds - Number of days clear of clouds
28.3%
26.6%
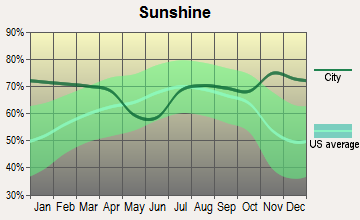
Sunshine amount - Average
78.4%
78.3%
Sunshine amount - Differences during a year
22%
21.7%
Sunshine amount - Maximum monthly
85%
84.4%
Sunshine amount - Minimum monthly
63%
62.7%
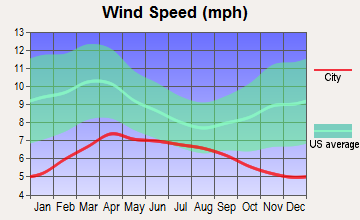
Wind speed - Average
3.7 mph
5.8 mph
Average climate in East San Gabriel Valley, California
Average climate in Central Coast, California
Air pollution
Type
AQI
CO
NO2
OZONE
PB
PM10
PM25
SO2
Year
East San Gabriel Valley
Central Coast
East San Gabriel Valley
Central Coast
East San Gabriel Valley
Central Coast
East San Gabriel Valley
Central Coast
East San Gabriel Valley
Central Coast
East San Gabriel Valley
Central Coast
East San Gabriel Valley
Central Coast
East San Gabriel Valley
Central Coast
2018
143
119
0.36
0.29
14.1
14.2
29.2
28.9
0.007
N/A
29.6
27.5
13.4
12.6
0.3
0.7
2017
150
116
0.35
0.27
14.8
12.9
30.5
31.6
0.007
N/A
32.7
26.7
12.6
13.8
0.3
0.5
2016
141
102
0.31
0.26
15.5
10.6
29.3
31.2
0.007
N/A
30.3
24.1
12.0
12.5
0.3
0.1
2015
145
106
0.30
0.26
15.2
11.8
30.4
31.8
0.007
N/A
30.0
25.0
14.6
14.5
0.2
0.1
2014
142
109
0.32
0.23
16.8
11.3
29.7
30.2
0.008
N/A
33.6
26.7
11.7
15.6
0.3
0.3
2013
147
107
0.33
0.27
17.0
12.3
27.7
29.3
0.007
0.003
31.5
29.4
11.5
14.1
0.4
0.2
2012
149
103
0.39
0.21
18.3
10.6
27.5
28.0
0.005
0.004
30.9
28.1
15.6
14.4
0.6
0.1
2011
149
109
0.40
0.25
18.6
12.7
26.7
28.2
0.008
0.006
30.3
27.7
17.3
15.9
0.5
0.6
2010
139
102
0.44
0.26
19.3
12.0
26.8
27.6
N/A
0.011
26.6
23.6
14.8
14.1
0.4
0.6
2009
156
118
0.40
0.29
21.0
13.6
28.0
29.2
0.010
0.009
26.0
24.3
16.5
14.5
0.6
1.1
2008
156
124
0.48
0.35
22.7
14.0
27.7
30.1
0.012
0.008
27.0
29.5
15.1
21.6
1.0
1.1
2007
135
100
0.52
0.32
25.3
14.0
24.8
28.5
0.014
0.010
N/A
N/A
N/A
N/A
1.3
0.8
2006
128
109
0.55
0.35
25.1
15.1
24.0
27.2
0.009
0.005
N/A
N/A
N/A
N/A
1.9
1.3
2005
127
91
0.59
0.32
25.7
14.6
22.8
29.4
0.014
0.011
N/A
N/A
N/A
N/A
1.9
1.3
2004
132
118
0.68
0.46
25.4
16.3
24.6
31.5
0.016
0.012
N/A
N/A
N/A
N/A
1.7
1.6
2003
137
116
0.80
0.59
29.9
19.1
24.7
32.5
0.021
0.046
N/A
N/A
N/A
N/A
1.4
1.1
2002
134
103
0.83
0.58
31.4
18.8
23.1
28.2
0.021
0.010
N/A
N/A
N/A
N/A
2.0
1.6
2001
141
109
1.00
0.67
31.8
18.2
21.4
27.8
0.029
0.011
N/A
N/A
N/A
N/A
2.1
1.5
2000
150
116
1.05
0.79
34.7
20.6
20.7
26.0
0.027
0.016
N/A
N/A
N/A
N/A
2.0
1.9
Natural disasters
Type
East San Gabriel Valley
Central Coast
Tornado activity compared to U.S. average
18.5%
18.4%
Earthquake activity compared to U.S. average
7,292.4%
6,801.5%
Natural disasters compared to U.S. average
57%
32%
Transportation
In East San Gabriel Valley, commuting is often done by car, with several public transit options. In the Central Coast, given the spread-out nature of the area, a car is almost a necessity for commuting.
Transport
Type
East San Gabriel Valley
Central Coast
Amtrak stations nearby
3
3
Means of transportation to work
Type
East San Gabriel Valley
Central Coast
Bicycle
0.6%
1.8%
Bus
2.9%
2.4%
Carpooled
17.1%
9%
Car alone
73.3%
75.9%
Motorcycle
0.2%
0.2%
Railroad
0.6%
0.1%
Walked
2.2%
4.4%
Average travel time to work
Type
East San Gabriel Valley
Central Coast
Average
32.3 min
23.2 min
Real Estate
Real estate in East San Gabriel Valley is generally pricier given its proximity to LA. The Central Coast offers a mix of high-priced coastal properties and more affordable inland options.
Neighborhoods
Neighborhoods in East-San Gabriel Valley range from upscale communities like Bradbury and San Marino to mid-range options like Glendora and Covina. The Central Coast offers both coastal towns like Santa Barbara and more rural areas.
Houses and residents
Type
East San Gabriel Valley
Central Coast
Houses
270,240
96,674
Average household size (people)
3.5
2.4
Houses occupied
263,338 (97.4%)
90,435 (93.5%)
Houses occupied by owners
180,683 (68.6%)
43,559 (48.2%)
Houses occupied by renters
82,655 (31.4%)
46,876 (51.8%)
Median rent asked for vacant for-rent units
$1,935
$2,849
Median price asked for vacant for-sale houses and condos
$1,138,428
$1,099,558
Estimated median house or condo value
$643,048
Over $1,000,000
Median number of rooms in apartments
3.7
3.9
Median number of rooms in houses and condos
5.9
6.1
Renting percentage
32.3%
53.9%
Housing density (houses/condos per square mile)
1,270.8
1,918.7
Household income disparities
40.3%
38.4%
Housing units without a mortgage
26,635 (16.4%)
8,041 (21.3%)
Housing units with both a second mortgage and home equity loan
515 (0.3%)
100 (0.3%)
Housing units with a mortgage
136,243 (83.6%)
29,764 (78.7%)
Housing units with a home equity loan
11,429 (7%)
3,303 (8.7%)
Housing units with a second mortgage
21,150 (13%)
3,451 (9.1%)
Housing units lacking complete kitchen facilities
1%
0.7%
Housing units lacking complete plumbing facilities
0.8%
0.4%
Housing units in structures
Housing units in structures
East San Gabriel Valley
Central Coast
One, detached
68.5%
38.4%
One, attached
8.2%
16.3%
Two
1.0%
5.0%
3 or 4
3.9%
8.7%
5 to 9
3.0%
5.9%
10 to 19
2.4%
5.3%
20 to 49
2.8%
4.7%
50 or more
6.5%
13.4%
Mobile homes
3.6%
2.0%
Boats, RVs, vans, etc.
0.1%
0.2%
Median real estate property taxes paid for housing units
Self-employed workers in own not incorporated business
25,753
13,281
State government workers
13,845
6,404
Unpaid family workers
1,494
456
Industries and Occupations
The dominant industries in East San Gabriel Valley are healthcare, retail, and professional services. The Central Coast emphasizes tourism, agriculture, wine production, and tech.
Healthcare in East San Gabriel Valley is primarily provided by large healthcare providers and several hospitals. The Central Coast also offers excellent healthcare facilities, with cottage hospitals and community clinics scattered across its cities and towns.
Health (county statistics)
Type
East San Gabriel Valley
Central Coast
General health status score of residents in this county from 1 (poor) to 5 (excellent)
Being part of the LA metro area, East San Gabriel Valley is well-served by major highways and public transit infrastructures. The Central Coast is reasonably served by highways, but its public transit options are somewhat limited due to its more rural characteristics.
Infrastructure
Type
East San Gabriel Valley
Central Coast
TV stations
24
2
Culture and Food
East San Gabriel Valley is known for its diverse food scene, particularly for its Asian cuisine. Central Coast, meanwhile, is renowned for its wine culture and fresh local produce reflected in its cuisine.
Sports Teams
Being close to LA, residents of East San Gabriel Valley follow teams like the Lakers, Dodgers, and Rams. Central Coast residents might follow LA or San Francisco teams given its geographical location.
 East San Gabriel Valley, CA
 Central Coast, CA