The comparison between East San Gabriel Valley, California, and Cincinnati, Ohio, covers a range of aspects for those seeking to relocate or just visiting. These include crime and safety, weather, cost of living, and other elements crucial in evaluating the characteristics of the cities. Here we investigate these aspects to provide a detailed comparison intended to aid informed decision making according to individual preferences.
East San Gabriel Valley, California, has a lower crime rate compared to Cincinnati, Ohio. Both cities have consistent law enforcement measures, but the rate of violent and property crimes in Cincinnati is higher. However, it's important to consider that crime rates vary by neighborhood within each city.
Cost of Living
The cost of living in East San Gabriel Valley is markedly higher than in Cincinnati, primarily driven by housing costs. While this may be a consideration for permanent relocation, it can also impact the cost of visiting, including hotel prices and restaurant costs.
Income Tax
Ohio has a progressive income tax, and Cincinnati additionally imposes a city income tax. California also has a progressive income tax which is one of the highest in the nation.
Property Tax
Property taxes in both areas differ significantly, with Cincinnati's being higher than California's due to the state's Proposition 13, which limits property tax rates.
Sales Tax
The sales tax in Cincinnati, Ohio is 7.8%, which is lower than the combined sales tax rate of 9.5% in the East San Gabriel Valley, California.
Income
Type
East San Gabriel Valley
Cincinnati
Estimated median household income
$95,242
$42,733
Estimated per capita income
$34,474
$34,519
Cost of living index (U.S. average is 100)
150.2
89
If you make $50,000 in Cincinnati, you will have to make $84,382 in East San Gabriel Valley to maintain the same standard of living.
Geographical Conditions
San Gabriel Valley is characterized by its scenic hilly landscape and proximity to the Pacific Ocean. On the other hand, Cincinnati is situated on the Ohio River and boasts beautiful riverfront views and rolling hills.
Geographical information
Type
East San Gabriel Valley
Cincinnati
Land area
212.6 sq. miles
78 sq. miles
Population density
4,478.5 people per sq. mile
3,962.4 people per sq. mile
Relative area comparison
East San Gabriel Valley, CA Cincinnati, OH
Education
Both areas have strong educational systems. East San Gabriel Valley is home to several top-rated public and private schools and colleges, including the University of La Verne. Cincinnati also boasts several renowned institutions, such as the University of Cincinnati and Xavier University.
Both regions have strong economies, but they differ in dominant industries. East San Gabriel Valley is within the sprawling Los Angeles metro area, creating opportunities in entertainment, technology, and tourism. Cincinnati's economy is diverse with strengths in manufacturing, finance, and healthcare sectors.
Biggest Employers
In the East San Gabriel Valley, some of the biggest employers include universities, school districts, and entertainment companies. Conversely, in Cincinnati, large corporations such as Proctor & Gamble, Kroger Company, and Fifth Third Bancorp are among the top employers.
In East San Gabriel Valley (Los Angeles County), 69.7% voted for Democrats and 27.8% for Republicans in 2012 Presidential Election. In Cincinnati (Hamilton County), 52.7% voted for Democrats and 46.4% for Republicans.
Elections
Type
Democrats
Republicans
Other
Year
East San Gabriel Valley
Cincinnati
East San Gabriel Valley
Cincinnati
East San Gabriel Valley
Cincinnati
2020
71.0%
57.2%
26.9%
41.3%
2.1%
1.5%
2016
72.0%
52.8%
22.5%
42.5%
5.5%
4.8%
2012
69.7%
52.7%
27.8%
46.4%
2.4%
0.9%
2008
69.2%
53.1%
28.8%
46.1%
1.9%
0.7%
2004
63.3%
47.3%
35.7%
52.7%
1.0%
0.0%
2000
63.6%
42.8%
32.4%
54.1%
4.0%
3.1%
1996
59.3%
43.1%
31.0%
50.1%
9.7%
6.8%
Breakdown of population affiliated with a religious congregation
Type
Adherents
Congregations
Religion
East San Gabriel Valley
Cincinnati
East San Gabriel Valley
Cincinnati
CATHOLIC CHURCH
36.1%
25.6%
4.7%
12.5%
SOUTHERN BAPTIST CONVENTION
1.0%
1.2%
9.0%
6.5%
MUSLIM ESTIMATE
0.7%
0.2%
1.0%
0.6%
AMERICAN BAPTIST CHURCHES IN THE USA
0.5%
1.3%
3.1%
2.6%
SEVENTH DAY ADVENTIST CHURCH
0.5%
0.2%
2.4%
0.9%
EPISCOPAL CHURCH
0.4%
1.1%
1.4%
3.0%
EVANGELICAL LUTHERAN CHURCH IN AMERICA
0.2%
0.6%
1.9%
1.8%
LUTHERAN CHURCH
0.2%
0.3%
1.6%
1.5%
VINEYARD USA
0.1%
1.8%
0.3%
1.1%
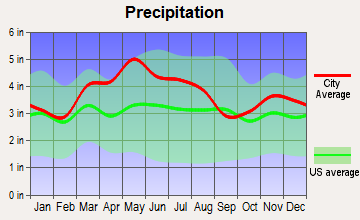
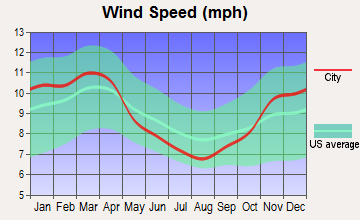
Weather
East San Gabriel Valley typically experiences a Mediterranean climate, characterized by warm, dry summers and mild, wet winters. On the other hand, Cincinnati has a humid subtropical climate, with hot, muggy summers and chilly winters. Depending on personal preference, the weather can have a significant impact on comfort and lifestyle.
Weather and climate
Type
East San Gabriel Valley
Cincinnati
Temperature - Average
62.7°F
52.9°F
Humidity - Average morning or afternoon humidity
64.7%
75.8%
Humidity - Differences between morning and afternoon humidity
19.6%
34%
Humidity - Maximum monthly morning or afternoon humidity
70.7%
87%
Humidity - Minimum monthly morning or afternoon humidity
51%
53%
Precipitation - Yearly average
19.1 in
45 in
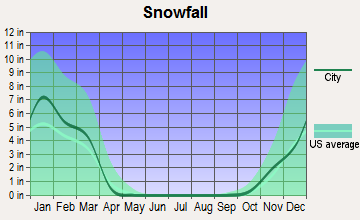
Snowfall - Yearly average
0 in
47.6 in
Clouds - Number of days clear of clouds
28.3%
13.5%
Sunshine amount - Average
78.4%
57.8%
Sunshine amount - Differences during a year
22%
33.1%
Sunshine amount - Maximum monthly
85%
67%
Sunshine amount - Minimum monthly
63%
33.9%
Wind speed - Average
3.7 mph
9 mph
Average climate in East San Gabriel Valley, California
Average climate in Cincinnati, Ohio
Air pollution
Type
AQI
CO
NO2
OZONE
PB
PM10
PM25
SO2
Year
East San Gabriel Valley
Cincinnati
East San Gabriel Valley
Cincinnati
East San Gabriel Valley
Cincinnati
East San Gabriel Valley
Cincinnati
East San Gabriel Valley
East San Gabriel Valley
Cincinnati
East San Gabriel Valley
Cincinnati
East San Gabriel Valley
Cincinnati
2018
143
87
0.36
0.20
14.1
9.6
29.2
27.8
0.007
N/A
29.6
18.3
13.4
10.5
0.3
0.8
2017
150
81
0.35
0.23
14.8
8.5
30.5
29.2
0.007
N/A
32.7
18.8
12.6
9.2
0.3
1.1
2016
141
88
0.31
0.24
15.5
9.4
29.3
28.4
0.007
N/A
30.3
21.2
12.0
8.4
0.3
1.1
2015
145
91
0.30
0.26
15.2
11.0
30.4
26.4
0.007
N/A
30.0
21.5
14.6
9.5
0.2
1.5
2014
142
89
0.32
0.24
16.8
11.4
29.7
27.3
0.008
N/A
33.6
19.5
11.7
12.0
0.3
2.0
2013
147
92
0.33
0.24
17.0
11.5
27.7
27.0
0.007
N/A
31.5
22.9
11.5
11.9
0.4
2.6
2012
149
97
0.39
0.26
18.3
4.8
27.5
27.6
0.005
N/A
30.9
23.4
15.6
13.6
0.6
3.4
2011
149
102
0.40
0.26
18.6
12.9
26.7
28.1
0.008
N/A
30.3
22.1
17.3
13.1
0.5
4.0
2010
139
113
0.44
N/A
19.3
14.7
26.8
29.7
N/A
N/A
26.6
26.6
14.8
18.7
0.4
3.7
2009
156
77
0.40
N/A
21.0
14.4
28.0
25.6
0.010
N/A
26.0
22.6
16.5
8.2
0.6
2.2
2008
156
85
0.48
N/A
22.7
16.0
27.7
26.5
0.012
N/A
27.0
N/A
15.1
9.4
1.0
3.0
2007
135
100
0.52
N/A
25.3
17.1
24.8
30.2
0.014
N/A
N/A
N/A
N/A
12.7
1.3
4.0
2006
128
83
0.55
N/A
25.1
18.0
24.0
29.3
0.009
N/A
N/A
21.9
N/A
N/A
1.9
4.2
2005
127
110
0.59
0.49
25.7
20.6
22.8
30.9
0.014
N/A
N/A
N/A
N/A
N/A
1.9
5.6
2004
132
91
0.68
0.36
25.4
18.7
24.6
27.7
0.016
N/A
N/A
N/A
N/A
N/A
1.7
5.5
2003
137
86
0.80
0.33
29.9
21.9
24.7
27.6
0.021
N/A
N/A
N/A
N/A
N/A
1.4
4.9
2002
134
98
0.83
0.32
31.4
21.4
23.1
29.4
0.021
N/A
N/A
20.0
N/A
N/A
2.0
4.5
2001
141
102
1.00
0.41
31.8
21.4
21.4
29.4
0.029
N/A
N/A
22.9
N/A
N/A
2.1
5.0
2000
150
104
1.05
0.40
34.7
22.1
20.7
28.0
0.027
N/A
N/A
N/A
N/A
N/A
2.0
6.3
Natural disasters
Type
East San Gabriel Valley
Cincinnati
Tornado activity compared to U.S. average
18.5%
166.3%
Earthquake activity compared to U.S. average
7,292.4%
148.2%
Natural disasters compared to U.S. average
57%
15%
Transportation
Both cities offer public transit options. San Gabriel Valley, being within the Los Angeles metro area, benefits from the extensive Metro bus and rail system. Cincinnati offers bus transit via the Metro and a streetcar system running downtown.
Transport
Type
East San Gabriel Valley
Cincinnati
Amtrak stations
0
1
Amtrak stations nearby
3
2
FAA registered aircraft
0
454
FAA registered aircraft manufacturers and dealers
0
16
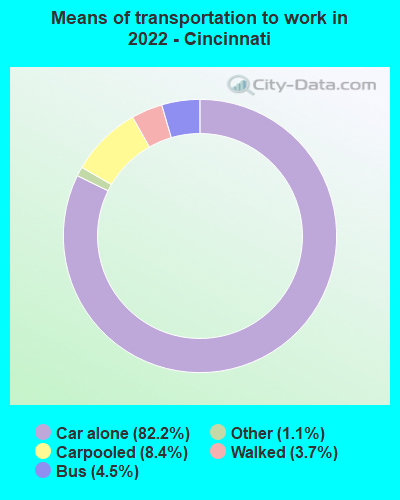
Means of transportation to work
Type
East San Gabriel Valley
Cincinnati
Bicycle
0.6%
0.3%
Bus
2.9%
3.2%
Carpooled
17.1%
7.2%
Car alone
73.3%
84.7%
Motorcycle
0.2%
0.1%
Railroad
0.6%
0%
Taxicab
0%
0.3%
Walked
2.2%
3.4%
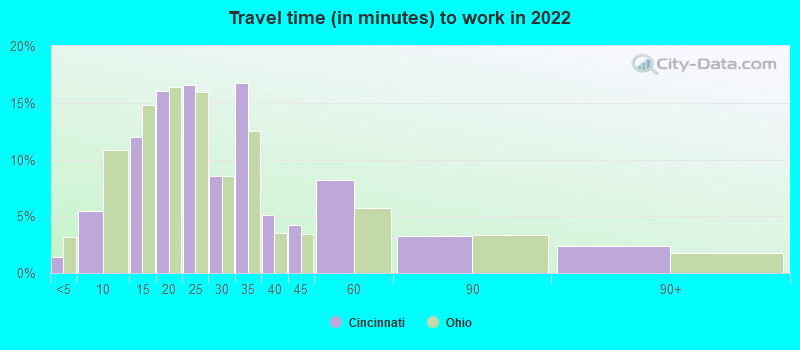
Average travel time to work
Type
East San Gabriel Valley
Cincinnati
Average
32.3 min
26.9 min
Real Estate
The real estate market in both regions is competitive but serves different price points. East San Gabriel Valley's real estate market is much pricier than Cincinnati's, reflecting the higher general cost of living in Southern California.
Neighborhoods
East San Gabriel Valley features several upscale neighborhoods, filled with diverse cultures and vibrant community scenes. Cincinnati also has diverse neighborhoods, each with a unique character, including Over-the-Rhine, Mount Adams, and Hyde Park.
Houses and residents
Type
East San Gabriel Valley
Cincinnati
Houses
270,240
160,420
Average household size (people)
3.5
2.1
Houses occupied
263,338 (97.4%)
144,929 (90.3%)
Houses occupied by owners
180,683 (68.6%)
55,411 (38.2%)
Houses occupied by renters
82,655 (31.4%)
89,518 (61.8%)
Median rent asked for vacant for-rent units
$1,935
$823.02
Median price asked for vacant for-sale houses and condos
$1,138,428
$55,446
Estimated median house or condo value
$643,048
$190,300
Median number of rooms in apartments
3.7
3.7
Median number of rooms in houses and condos
5.9
6.5
Renting percentage
32.3%
61.1%
Housing density (houses/condos per square mile)
1,270.8
2,057.5
Household income disparities
40.3%
51.8%
Housing units without a mortgage
26,635 (16.4%)
1,063 (2.8%)
Housing units with both a second mortgage and home equity loan
515 (0.3%)
2,466 (6.5%)
Housing units with a mortgage
136,243 (83.6%)
36,710 (97.2%)
Housing units with a home equity loan
11,429 (7%)
116 (0.3%)
Housing units with a second mortgage
21,150 (13%)
3,803 (10.1%)
Housing units lacking complete kitchen facilities
1%
2.4%
Housing units lacking complete plumbing facilities
Self-employed workers in own not incorporated business
25,753
6,809
State government workers
13,845
4,546
Unpaid family workers
1,494
42
Industries and Occupations
The dominant industries in East San Gabriel Valley include tech, entertainment, and services, while in Cincinnati, manufacturing, finance, and healthcare are more prevalent. Both areas offer a wide range of roles for workers of all experience levels.
Both cities hold well-regarded medical facilities. Cincinnati is home to the renowned Cincinnati Children's Hospital, while San Gabriel Valley residents have access to the broader Los Angeles area's robust healthcare system, including UCLA Health and Cedars-Sinai.
Health (county statistics)
Type
East San Gabriel Valley
Cincinnati
General health status score of residents in this county from 1 (poor) to 5 (excellent)
Cincinnati benefits from being a well-established city with a robust infrastructure. Comparably, San Gabriel Valley, situated within the Los Angeles metro area, offers a well-developed infrastructure accommodating a larger population with a broad range of amenities.
Infrastructure
Type
East San Gabriel Valley
Cincinnati
TV stations
24
16
Culture and Food
Both areas offer rich cultural scenes. East San Gabriel Valley has a diverse blend of cultures, reflected in its food, festivals, and music. Cincinnati, on the other hand, is known for its German and Irish heritage, arts scene, and unique food like Cincinnati-style chili.
Sports Teams
Cincinnati boasts professional sports teams including the Cincinnati Reds (MLB) and Cincinnati Bengals (NFL). East San Gabriel Valley, while not home to major sports teams itself, is within reach of Los Angeles’ famed teams like the Lakers (NBA), Dodgers (MLB), and Rams (NFL).
 East San Gabriel Valley, CA
 Cincinnati, OH