East San Gabriel Valley and Fort Wayne are two world's apart residing on the different sides of the United States, each offering unique lifestyle opportunities for both residents and tourists alike. Between the California sunshine and Indiana heartland, these locations provide contrasting experiences in aspects of crime, weather, cost of living, and the overall quality of life. This comprehensive comparative analysis will delve into the salient features of these two regions to aid your decision-making process.
East San Gabriel Valley, CA has lower crime rates compared to national averages, contributing to a safer living environment. On the other hand, Fort Wayne, IN has a slightly higher rate of crime, particularly in property crime. However, both cities have put measures in place to work towards improving safety, making them relatively safe when compared to other USA cities.
Cost of Living
Living in California is generally expensive than the Midwest. East San Gabriel Valley has a significantly higher cost of living, driven by high housing costs, groceries, and utilities. Conversely, Fort Wayne, IN offers a lower cost of living which is below the national average predominantly due to affordable housing and the cost of groceries being lower.
Income Tax
California has a progressive income tax system, known for being one of the highest in the nation, while Indiana has a flat state income tax. Counting the lows and highs, California's state income tax can be significantly higher than Indiana's.
Property Tax
Indiana's residential property taxes are relatively higher than California's. However, California's higher real estate value means homeowners can end up paying more in absolute dollar terms.
Sales Tax
California's state sales tax rate is notably higher than Indiana's. Therefore, day-to-day shopping in East San Gabriel Valley would be more expensive.
Income
Type
East San Gabriel Valley
Fort Wayne
Estimated median household income
$95,242
$54,737
Estimated per capita income
$34,474
$29,282
Cost of living index (U.S. average is 100)
150.2
82.8
If you make $50,000 in Fort Wayne, you will have to make $90,700 in East San Gabriel Valley to maintain the same standard of living.
Geographical Conditions
East San Gabriel Valley is geographically diverse, featuring valleys, mountains, and proximity to the Pacific Ocean. Conversely, Fort Wayne is fairly flat, characterized by its fertile farmland and network of rivers.
Geographical information
Type
East San Gabriel Valley
Fort Wayne
Land area
212.6 sq. miles
79 sq. miles
Population density
4,478.5 people per sq. mile
3,368.8 people per sq. mile
Relative area comparison
East San Gabriel Valley, CA Fort Wayne, IN
Education
Both regions value education, with several reputable schools and colleges. East San Gabriel Valley has renowned educational institutions including the Claremont Colleges. Fort Wayne, on the other hand, homes Indiana University–Purdue University Fort Wayne (IPFW), the largest university in northeast Indiana.
East San Gabriel Valley's economy is driven by a diverse range of sectors such as healthcare, education, and retail trade. It boasts a higher median household income compared to Fort Wayne. Despite a lower median income, Fort Wayne's economy is robust, driven by manufacturing, healthcare, and retail trade.
Biggest Employers
Among the biggest employers in East San Gabriel Valley are City of Hope, Land's End, and Trader Joe's, while in Fort Wayne, major employers include Parkview Health System, General Motors, and Lutheran Health Network.
In East San Gabriel Valley (Los Angeles County), 69.7% voted for Democrats and 27.8% for Republicans in 2012 Presidential Election. In Fort Wayne (Allen County), 40.9% voted for Democrats and 57.6% for Republicans.
Elections
Type
Democrats
Republicans
Other
Year
East San Gabriel Valley
Fort Wayne
East San Gabriel Valley
Fort Wayne
East San Gabriel Valley
Fort Wayne
2020
71.0%
43.3%
26.9%
54.5%
2.1%
2.2%
2016
72.0%
37.3%
22.5%
56.6%
5.5%
6.1%
2012
69.7%
40.9%
27.8%
57.6%
2.4%
1.5%
2008
69.2%
47.5%
28.8%
51.8%
1.9%
0.7%
2004
63.3%
36.1%
35.7%
63.4%
1.0%
0.6%
2000
63.6%
36.4%
32.4%
61.6%
4.0%
2.0%
1996
59.3%
37.8%
31.0%
54.1%
9.7%
8.0%
Breakdown of population affiliated with a religious congregation
Type
Adherents
Congregations
Religion
East San Gabriel Valley
Fort Wayne
East San Gabriel Valley
Fort Wayne
CATHOLIC CHURCH
36.1%
16.0%
4.7%
5.6%
SOUTHERN BAPTIST CONVENTION
1.0%
1.2%
9.0%
3.8%
MUSLIM ESTIMATE
0.7%
0.3%
1.0%
0.5%
AMERICAN BAPTIST CHURCHES IN THE USA
0.5%
1.1%
3.1%
2.0%
SEVENTH DAY ADVENTIST CHURCH
0.5%
0.2%
2.4%
0.8%
EPISCOPAL CHURCH
0.4%
0.2%
1.4%
0.8%
EVANGELICAL LUTHERAN CHURCH IN AMERICA
0.2%
2.3%
1.9%
3.5%
LUTHERAN CHURCH
0.2%
6.8%
1.6%
8.9%
Weather
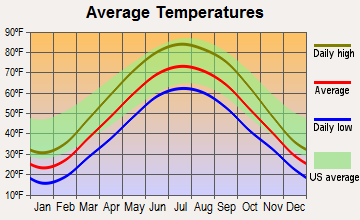
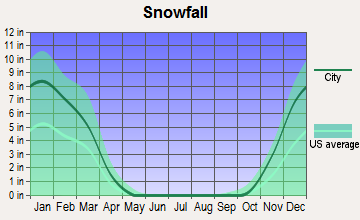
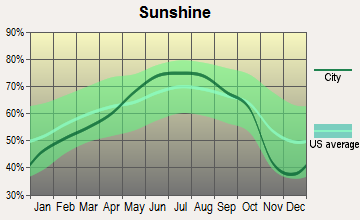
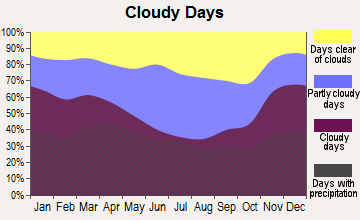
Weather dramatically differs between these two locations. East San Gabriel Valley boasts a Mediterranean climate, featuring warm, dry summers, and mild, wet winters. Conversely, Fort Wayne experiences a humid continental climate punctuated with hot, humid summers and cold winters, which can go down to freezing temperatures.
Weather and climate
Type
East San Gabriel Valley
Fort Wayne
Temperature - Average
62.7°F
49.9°F
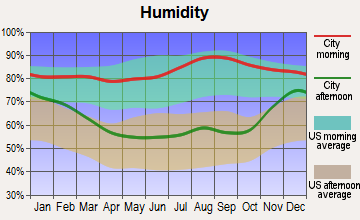
Humidity - Average morning or afternoon humidity
64.7%
77.5%
Humidity - Differences between morning and afternoon humidity
19.6%
33%
Humidity - Maximum monthly morning or afternoon humidity
70.7%
87%
Humidity - Minimum monthly morning or afternoon humidity
51%
54%
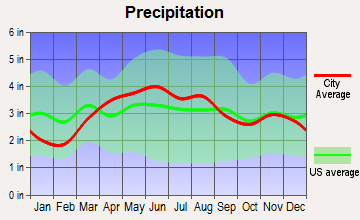
Precipitation - Yearly average
19.1 in
36.5 in
Snowfall - Yearly average
0 in
64.8 in
Clouds - Number of days clear of clouds
28.3%
13.1%
Sunshine amount - Average
78.4%
65.2%
Sunshine amount - Differences during a year
22%
40%
Sunshine amount - Maximum monthly
85%
76%
Sunshine amount - Minimum monthly
63%
36%
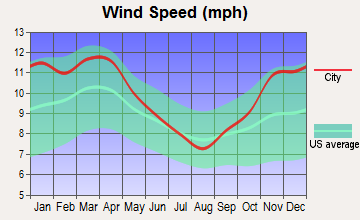
Wind speed - Average
3.7 mph
9.9 mph
Average climate in East San Gabriel Valley, California
Average climate in Fort Wayne, Indiana
Air pollution
Type
AQI
CO
NO2
OZONE
PB
PM10
PM25
SO2
Year
East San Gabriel Valley
Fort Wayne
East San Gabriel Valley
Fort Wayne
East San Gabriel Valley
East San Gabriel Valley
Fort Wayne
East San Gabriel Valley
East San Gabriel Valley
East San Gabriel Valley
Fort Wayne
East San Gabriel Valley
2018
143
74
0.36
N/A
14.1
N/A
29.2
27.2
0.007
N/A
29.6
N/A
13.4
8.8
0.3
N/A
2017
150
68
0.35
N/A
14.8
N/A
30.5
28.3
0.007
N/A
32.7
N/A
12.6
8.2
0.3
N/A
2016
141
78
0.31
N/A
15.5
N/A
29.3
N/A
0.007
N/A
30.3
N/A
12.0
8.8
0.3
N/A
2015
145
85
0.30
N/A
15.2
N/A
30.4
N/A
0.007
N/A
30.0
N/A
14.6
10.8
0.2
N/A
2014
142
93
0.32
N/A
16.8
N/A
29.7
N/A
0.008
N/A
33.6
N/A
11.7
13.1
0.3
N/A
2013
147
74
0.33
0.45
17.0
N/A
27.7
N/A
0.007
N/A
31.5
N/A
11.5
9.9
0.4
N/A
2012
149
91
0.39
0.64
18.3
N/A
27.5
N/A
0.005
N/A
30.9
N/A
15.6
13.9
0.6
N/A
2011
149
87
0.40
0.37
18.6
N/A
26.7
N/A
0.008
N/A
30.3
N/A
17.3
12.2
0.5
N/A
2010
139
98
0.44
0.34
19.3
N/A
26.8
N/A
N/A
N/A
26.6
N/A
14.8
15.8
0.4
N/A
2009
156
96
0.40
0.62
21.0
N/A
28.0
N/A
0.010
N/A
26.0
N/A
16.5
16.5
0.6
N/A
2008
156
96
0.48
0.79
22.7
N/A
27.7
N/A
0.012
N/A
27.0
N/A
15.1
15.7
1.0
N/A
2007
135
103
0.52
0.47
25.3
N/A
24.8
N/A
0.014
N/A
N/A
N/A
N/A
13.4
1.3
N/A
2006
128
81
0.55
0.61
25.1
N/A
24.0
N/A
0.009
N/A
N/A
N/A
N/A
11.8
1.9
N/A
2005
127
107
0.59
0.67
25.7
N/A
22.8
N/A
0.014
N/A
N/A
N/A
N/A
14.4
1.9
N/A
2004
132
75
0.68
0.85
25.4
N/A
24.6
N/A
0.016
N/A
N/A
N/A
N/A
N/A
1.7
N/A
2003
137
101
0.80
0.70
29.9
N/A
24.7
N/A
0.021
N/A
N/A
N/A
N/A
12.2
1.4
N/A
2002
134
101
0.83
0.71
31.4
N/A
23.1
N/A
0.021
N/A
N/A
N/A
N/A
13.2
2.0
N/A
2001
141
65
1.00
0.65
31.8
N/A
21.4
N/A
0.029
N/A
N/A
N/A
N/A
N/A
2.1
N/A
2000
150
73
1.05
0.83
34.7
N/A
20.7
N/A
0.027
N/A
N/A
N/A
N/A
N/A
2.0
N/A
Natural disasters
Type
East San Gabriel Valley
Fort Wayne
Tornado activity compared to U.S. average
18.5%
174.8%
Earthquake activity compared to U.S. average
7,292.4%
101.2%
Natural disasters compared to U.S. average
57%
14%
Transportation
Both areas have developed public transportation systems. East San Gabriel Valley is served by Foothill Transit, while Fort Wayne's Citilink provides citywide bus service.
Transport
Type
East San Gabriel Valley
Fort Wayne
Amtrak stations nearby
3
0
FAA registered aircraft
0
209
FAA registered aircraft manufacturers and dealers
0
1
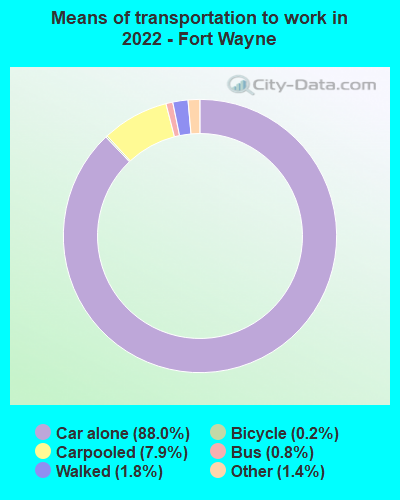
Means of transportation to work
Type
East San Gabriel Valley
Fort Wayne
Bicycle
0.6%
0.4%
Bus
2.9%
0.4%
Carpooled
17.1%
7.4%
Car alone
73.3%
89.6%
Motorcycle
0.2%
0.1%
Railroad
0.6%
0%
Walked
2.2%
1.4%
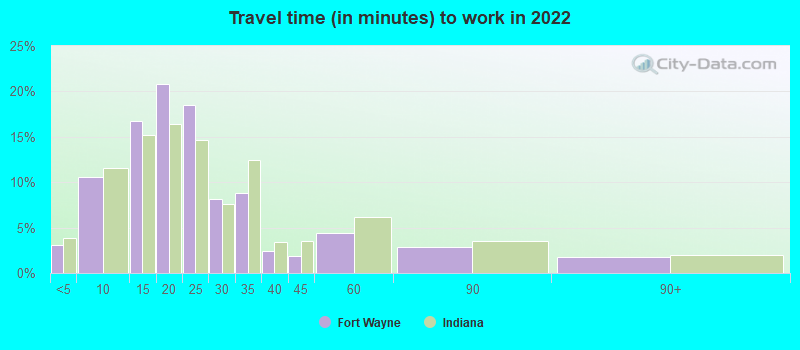
Average travel time to work
Type
East San Gabriel Valley
Fort Wayne
Average
32.3 min
23.9 min
Real Estate
The real estate market in East San Gabriel Valley is notoriously high, with soaring property prices partially due to its geographical location. On the other hand, Fort Wayne has more reasonably priced homes, making home ownership more attainable.
Neighborhoods
Neighborhoods in both areas offer a diverse range of living experiences. East San Gabriel Valley is known for plush neighborhoods, such as San Marino, whereas Fort Wayne offers areas like West Central which are rich in history and character.
Houses and residents
Type
East San Gabriel Valley
Fort Wayne
Houses
270,240
117,245
Average household size (people)
3.5
2.4
Houses occupied
263,338 (97.4%)
109,640 (93.5%)
Houses occupied by owners
180,683 (68.6%)
68,004 (62%)
Houses occupied by renters
82,655 (31.4%)
41,636 (38%)
Median rent asked for vacant for-rent units
$1,935
$729.05
Median price asked for vacant for-sale houses and condos
$1,138,428
$135,711
Estimated median house or condo value
$643,048
$155,600
Median number of rooms in apartments
3.7
4.2
Median number of rooms in houses and condos
5.9
6.8
Renting percentage
32.3%
36.7%
Housing density (houses/condos per square mile)
1,270.8
1,485
Household income disparities
40.3%
42.5%
Housing units without a mortgage
26,635 (16.4%)
811 (1.8%)
Housing units with both a second mortgage and home equity loan
515 (0.3%)
3,282 (7.3%)
Housing units with a mortgage
136,243 (83.6%)
43,922 (98.2%)
Housing units with a home equity loan
11,429 (7%)
0 (0%)
Housing units with a second mortgage
21,150 (13%)
3,996 (8.9%)
Housing units lacking complete kitchen facilities
1%
1%
Housing units lacking complete plumbing facilities
Self-employed workers in own not incorporated business
25,753
6,040
State government workers
13,845
2,352
Unpaid family workers
1,494
430
Industries and Occupations
East San Gabriel Valley has a competitive job market with industries such as healthcare, retail, and education leading the way. Alternatively, Fort Wayne has a strong presence in automotive manufacturing besides healthcare and retail.
Top-notch healthcare is a common feature for both cities, with numerous state-of-the-art hospitals. East San Gabriel is home to institutions like City of Hope, while Fort Wayne’s hospitals including Parkview and Lutheran health systems are well-regarded in the region.
Health (county statistics)
Type
East San Gabriel Valley
Fort Wayne
General health status score of residents in this county from 1 (poor) to 5 (excellent)
East San Gabriel Valley has robust infrastructure, marked by well-built freeways, access to markets, and state-of-the-art healthcare facilities. Conversely, Fort Wayne has its strengths in infrastructure, showcasing efficient waste management, airports, and a budding highway system.
Infrastructure
Type
East San Gabriel Valley
Fort Wayne
TV stations
24
11
Culture and Food
Both regions boast vibrant cultures and food scenes. East San Gabriel Valley is known for its eclectic mix of Asian and Mexican cuisines, while Fort Wayne is famous for its heartland dishes and burgeoning culinary scene.
Sports Teams
Sports enthusiasts would love both regions. In East San Gabriel Valley, a short drive will lead you to Los Angeles, home to famous teams like LA Lakers, Clippers, and Dodgers. Fort Wayne, on the other hand, is home to minor league teams like the Fort Wayne TinCaps baseball team and Komets hockey team.
 East San Gabriel Valley, CA
 Fort Wayne, IN