When comparing East San Gabriel Valley, California, to Garland, Texas, a number of factors come into play encompassing diverse aspects such as crime/safety, weather, and cost of living. Other crucial elements like education, work and economy, infrastructure, and industries and occupations also play a significant role. Both regions distinctively stand out in areas such as biggest employers, real estate, neighborhoods, among others. This comprehensive comparison aims to provide an insightful overview of what to expect in either location, whether considering relocation or simply visiting.
The crime rate in East San Gabriel Valley is slightly higher than the national average, particularly in violent crimes. On the other hand, Garland, Texas, has a considerably lower crime rate, making it a safer option in terms of overall safety. It's worth considering, however, that safer neighborhoods are often found in both locations, as is the case with any city.
Cost of Living
The cost of living in East San Gabriel Valley, California, is significantly higher than in Garland, Texas, due to California's high property and income taxes. Prices for goods and services are generally higher in California as well, making day-to-day living pricier than in Texas.
Income Tax
California imposes state income tax, which is a consideration if you're thinking of living in East San Gabriel Valley. Texas, on the other hand, has no state income tax, which is beneficial for those living in Garland.
Property Tax
Although Texas has no income tax, it makes up for it with higher property taxes. Garland is not an exception. California, however, has a property tax rate that's below the national average, which applies to East San Gabriel Valley.
Sales Tax
California has a higher sales tax rate compared to Texas. East San Gabriel Valley falls under California's rate of 7.25%, whereas Garland falls under Texas's state rate of 6.25% before any additional local taxes.
Income
Type
East San Gabriel Valley
Garland
Estimated median household income
$95,242
$61,607
Estimated per capita income
$34,474
$24,936
Cost of living index (U.S. average is 100)
150.2
95.5
If you make $50,000 in Garland, you will have to make $78,639 in East San Gabriel Valley to maintain the same standard of living.
Geographical Conditions
Geographically, East San Gabriel Valley is characterized by its pleasant Mediterranean climate, attractive landscapes, and coastal proximity, which offers stunning ocean views. Garland is located in the humid subtropical region of Texas, featuring flat grasslands and fewer natural landmarks.
Geographical information
Type
East San Gabriel Valley
Garland
Land area
212.6 sq. miles
57.1 sq. miles
Population density
4,478.5 people per sq. mile
4,238 people per sq. mile
Relative area comparison
East San Gabriel Valley, CA Garland, TX
Education
Education in both locations is commendable. East San Gabriel Valley has a collection of notable schools and sits near many prestigious universities, such as Caltech and the Claremont Colleges. Garland, Texas, also offers good education facilities and is close to several reputed higher education institutions, including the University of Texas at Dallas.
East San Gabriel Valley's economy primarily hinges on the healthcare, retail, and manufacturing sectors, while Garland's economy is diversified among telecommunications, manufacturing, and food processing industries. Both areas offer ample employment opportunities with their growing economies.
Biggest Employers
Biggest employers in East San Gabriel Valley include Citrus Valley Health Partners, West Covina Unified School District, and Queen of the Valley Hospital. In Garland, large employers such as Kraft Foods, US Food Service, and Ecolab provide numerous jobs for the local community.
In East San Gabriel Valley (Los Angeles County), 69.7% voted for Democrats and 27.8% for Republicans in 2012 Presidential Election. In Garland (Dallas County), 57.3% voted for Democrats and 41.8% for Republicans.
Elections
Type
Democrats
Republicans
Other
Year
East San Gabriel Valley
Garland
East San Gabriel Valley
Garland
East San Gabriel Valley
Garland
2020
71.0%
65.1%
26.9%
33.4%
2.1%
1.4%
2016
72.0%
60.8%
22.5%
34.7%
5.5%
4.5%
2012
69.7%
57.3%
27.8%
41.8%
2.4%
1.0%
2008
69.2%
57.4%
28.8%
42.0%
1.9%
0.6%
2004
63.3%
49.0%
35.7%
50.4%
1.0%
0.5%
2000
63.6%
45.0%
32.4%
52.7%
4.0%
2.4%
1996
59.3%
46.0%
31.0%
46.8%
9.7%
7.2%
Breakdown of population affiliated with a religious congregation
Type
Adherents
Congregations
Religion
East San Gabriel Valley
Garland
East San Gabriel Valley
Garland
CATHOLIC CHURCH
36.1%
18.9%
4.7%
2.4%
SOUTHERN BAPTIST CONVENTION
1.0%
11.0%
9.0%
31.1%
MUSLIM ESTIMATE
0.7%
3.6%
1.0%
1.1%
AMERICAN BAPTIST CHURCHES IN THE USA
0.5%
0.1%
3.1%
0.2%
SEVENTH DAY ADVENTIST CHURCH
0.5%
0.5%
2.4%
1.7%
EPISCOPAL CHURCH
0.4%
1.0%
1.4%
1.5%
EVANGELICAL LUTHERAN CHURCH IN AMERICA
0.2%
0.3%
1.9%
0.9%
Weather
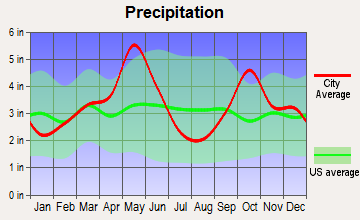
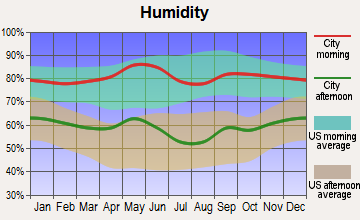
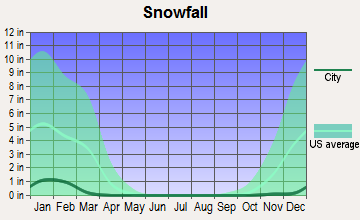
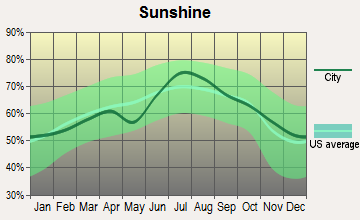
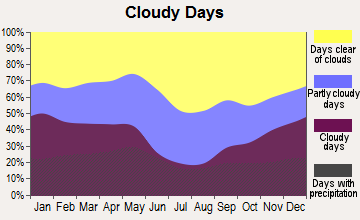
Weather in East San Gabriel Valley, California, is Mediterranean, with wet, mild winters and hotter, dry summers. It’s generally pleasant year-round, with average temperatures ranging from 66°F to 77°F. Garland, Texas, experiences a humid subtropical climate. Summers can be fiercely hot and humid, while winters are mild to cool.
Weather and climate
Type
East San Gabriel Valley
Garland
Temperature - Average
62.7°F
64.5°F
Humidity - Average morning or afternoon humidity
64.7%
71.3%
Humidity - Differences between morning and afternoon humidity
19.6%
34%
Humidity - Maximum monthly morning or afternoon humidity
70.7%
82%
Humidity - Minimum monthly morning or afternoon humidity
51%
48%
Precipitation - Yearly average
19.1 in
40 in
Snowfall - Yearly average
0 in
4.2 in
Clouds - Number of days clear of clouds
28.3%
22.8%
Sunshine amount - Average
78.4%
66.6%
Sunshine amount - Differences during a year
22%
20%
Sunshine amount - Maximum monthly
85%
74%
Sunshine amount - Minimum monthly
63%
54%
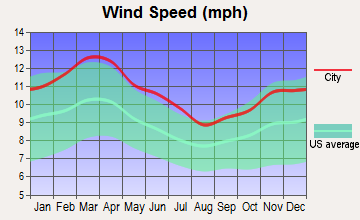
Wind speed - Average
3.7 mph
10.3 mph
Average climate in East San Gabriel Valley, California
Average climate in Garland, Texas
Air pollution
Type
AQI
CO
NO2
OZONE
PB
PM10
PM25
SO2
Year
East San Gabriel Valley
Garland
East San Gabriel Valley
East San Gabriel Valley
Garland
East San Gabriel Valley
Garland
East San Gabriel Valley
Garland
East San Gabriel Valley
East San Gabriel Valley
Garland
East San Gabriel Valley
Garland
2018
143
86
0.36
N/A
14.1
5.8
29.2
28.4
0.007
N/A
29.6
N/A
13.4
9.7
0.3
0.4
2017
150
84
0.35
N/A
14.8
5.7
30.5
29.7
0.007
N/A
32.7
N/A
12.6
9.1
0.3
0.3
2016
141
78
0.31
N/A
15.5
6.3
29.3
28.7
0.007
N/A
30.3
N/A
12.0
8.4
0.3
0.2
2015
145
84
0.30
N/A
15.2
6.9
30.4
29.1
0.007
N/A
30.0
N/A
14.6
8.9
0.2
0.3
2014
142
83
0.32
N/A
16.8
6.3
29.7
30.1
0.008
N/A
33.6
N/A
11.7
9.9
0.3
0.3
2013
147
95
0.33
N/A
17.0
7.1
27.7
31.2
0.007
N/A
31.5
N/A
11.5
13.0
0.4
0.2
2012
149
113
0.39
N/A
18.3
8.6
27.5
32.8
0.005
N/A
30.9
N/A
15.6
12.0
0.6
0.3
2011
149
98
0.40
N/A
18.6
9.2
26.7
32.8
0.008
N/A
30.3
N/A
17.3
11.9
0.5
0.6
2010
139
79
0.44
N/A
19.3
9.6
26.8
30.0
N/A
N/A
26.6
N/A
14.8
N/A
0.4
0.7
2009
156
87
0.40
N/A
21.0
9.4
28.0
30.8
0.010
N/A
26.0
N/A
16.5
N/A
0.6
0.5
2008
156
86
0.48
N/A
22.7
9.9
27.7
30.9
0.012
0.121
27.0
N/A
15.1
N/A
1.0
0.5
2007
135
94
0.52
N/A
25.3
10.6
24.8
27.6
0.014
0.070
N/A
N/A
N/A
N/A
1.3
0.3
2006
128
107
0.55
N/A
25.1
10.6
24.0
32.3
0.009
0.106
N/A
N/A
N/A
N/A
1.9
0.7
2005
127
105
0.59
N/A
25.7
13.1
22.8
31.4
0.014
0.142
N/A
N/A
N/A
11.0
1.9
0.9
2004
132
96
0.68
N/A
25.4
12.0
24.6
28.5
0.016
0.099
N/A
N/A
N/A
N/A
1.7
0.8
2003
137
102
0.80
N/A
29.9
13.8
24.7
29.8
0.021
0.121
N/A
N/A
N/A
N/A
1.4
1.0
2002
134
97
0.83
N/A
31.4
14.2
23.1
27.7
0.021
0.080
N/A
N/A
N/A
N/A
2.0
0.4
2001
141
100
1.00
N/A
31.8
13.8
21.4
29.0
0.029
0.069
N/A
N/A
N/A
N/A
2.1
1.0
2000
150
109
1.05
N/A
34.7
14.5
20.7
29.6
0.027
0.092
N/A
N/A
N/A
N/A
2.0
1.1
Natural disasters
Type
East San Gabriel Valley
Garland
Tornado activity compared to U.S. average
18.5%
252%
Earthquake activity compared to U.S. average
7,292.4%
577.9%
Natural disasters compared to U.S. average
57%
21%
Transportation
East San Gabriel Valley provides a good public transit system with numerous bus and rail lines, making commuting easy. Garland, however, is more car-dependent with public transportation being limited, although it still features a light rail service connecting to Dallas.
Transport
Type
East San Gabriel Valley
Garland
Amtrak stations nearby
3
1
FAA registered aircraft
0
75
FAA registered aircraft manufacturers and dealers
0
1
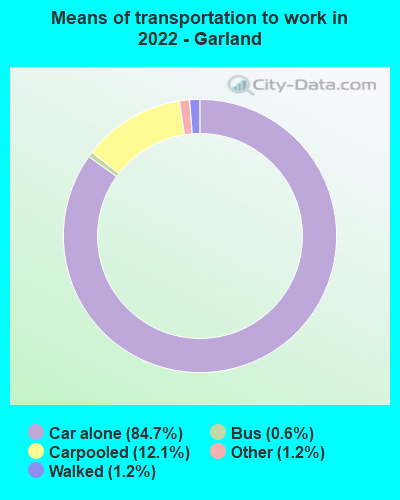
Means of transportation to work
Type
East San Gabriel Valley
Garland
Bicycle
0.6%
0.1%
Bus
2.9%
1%
Carpooled
17.1%
11.2%
Car alone
73.3%
85.3%
Motorcycle
0.2%
0.1%
Railroad
0.6%
0%
Walked
2.2%
1.4%
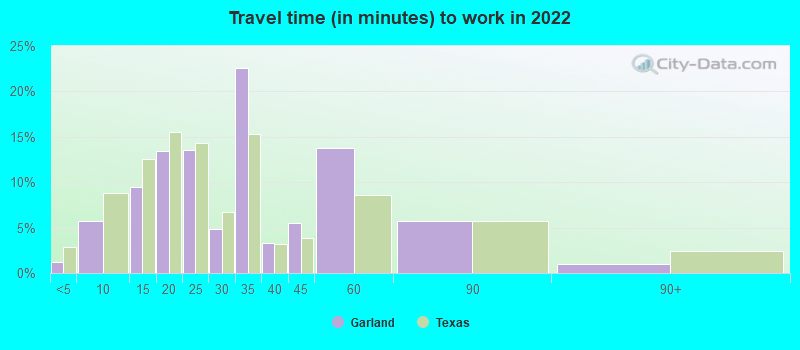
Average travel time to work
Type
East San Gabriel Valley
Garland
Average
32.3 min
30.2 min
Real Estate
Real estate costs are significantly higher in East San Gabriel Valley than in Garland, Texas due mainly to California's high overall cost of living. Rent and property prices can be steep, which is important to consider for anyone thinking about moving there. On the contrary, housing in Garland is more affordable.
Neighborhoods
East San Gabriel Valley is made up of many small, diverse cities and communities, each with its unique charm and character. Garland's neighborhoods offer a blend of suburban comfort with city amenities, making it attractive for both families and singles.
Houses and residents
Type
East San Gabriel Valley
Garland
Houses
270,240
80,577
Average household size (people)
3.5
3
Houses occupied
263,338 (97.4%)
77,777 (96.5%)
Houses occupied by owners
180,683 (68.6%)
46,943 (60.4%)
Houses occupied by renters
82,655 (31.4%)
30,834 (39.6%)
Median rent asked for vacant for-rent units
$1,935
$605.67
Median price asked for vacant for-sale houses and condos
$1,138,428
$176,480
Estimated median house or condo value
$643,048
$232,300
Median number of rooms in apartments
3.7
4
Median number of rooms in houses and condos
5.9
6
Renting percentage
32.3%
34.8%
Housing density (houses/condos per square mile)
1,270.8
1,410.9
Household income disparities
40.3%
41%
Housing units without a mortgage
26,635 (16.4%)
537 (1.9%)
Housing units with both a second mortgage and home equity loan
515 (0.3%)
674 (2.3%)
Housing units with a mortgage
136,243 (83.6%)
28,234 (98.1%)
Housing units with a home equity loan
11,429 (7%)
0 (0%)
Housing units with a second mortgage
21,150 (13%)
794 (2.8%)
Housing units lacking complete kitchen facilities
1%
1.2%
Housing units lacking complete plumbing facilities
Self-employed workers in own not incorporated business
25,753
8,212
State government workers
13,845
2,298
Unpaid family workers
1,494
81
Industries and Occupations
Prominent industries in East San Gabriel Valley include health care and social assistance, retail trade, and manufacturing. In Garland, primary industries encompass manufacturing, retail trade, and health care. Occupations are typically tied to these industries in both locations.
Healthcare is robust in both East San Gabriel Valley and Garland. East San Gabriel Valley benefits from California's overall high-quality healthcare system. Meanwhile, in Garland, access to world-class health facilities is provided by Texas Health Presbyterian Hospital and Baylor Scott & White Medical Center.
Health (county statistics)
Type
East San Gabriel Valley
Garland
General health status score of residents in this county from 1 (poor) to 5 (excellent)
Both East San Gabriel Valley and Garland have well-established infrastructures. In East San Gabriel Valley, this includes a robust network of highways and public transit, and tech-ready buildings. In Garland, you'll find good highway connectivity and abundant logistical facilities due to its strategic geographical location.
Infrastructure
Type
East San Gabriel Valley
Garland
TV stations
24
25
Culture and Food
East San Gabriel Valley is celebrated for its diverse cultural scene and has a rich variety of food choices, ranging from traditional American cuisines to ethnic foods. The culture in Garland is slightly less diverse but still offers a blend of Tex-Mex, Barbecues, and standard American fare.
Sports Teams
While there aren't any major professional teams in East San Gabriel Valley, the Los Angeles area teams are close by for sports lovers. Garland doesn't host major league teams either, but it’s close to Dallas, where you'll find several professional sports teams.
 East San Gabriel Valley, CA
 Garland, TX