East San Gabriel Valley, CA vs Huntington Beach, CA
This comparative analysis between East San Gabriel Valley and Huntington Beach takes into consideration various influential factors for both residents looking to relocate and tourists. The comparison evaluates various factors such as crime and safety, weather, cost of living, education, work and economy, infrastructure, industries and occupations, and many more. Both regions have unique features and experiences to offer which are distinctly Californian in their own terms.
Both East San Gabriel Valley and Huntington Beach boast crime rates that are lower than the national average. Nevertheless, Huntington Beach maintains a slightly lower rate of crime compared to East San Gabriel Valley. While both areas are generally safe, tourists and residents alike should always practice standard precautions.
Cost of Living
California has a reputation for a high cost of living and both these areas are no exception. Huntington Beach is considerably pricier when it comes to expenses like housing, groceries, and transport. On the other hand, East San Gabriel Valley is slightly more affordable but still exhibits higher costs compared to the national average.
Income Tax
California has a progressive tax system, and both areas fall within this state taxation system. High earners will have a higher income tax rate compared to those with lower income.
Property Tax
Property tax in California is generally lower than most states, however, due to high property values, the overall tax paid can be quite high. Both Huntington Beach and East San Gabriel Valley adheres to California's general property tax laws.
Sales Tax
In terms of sales tax, both East San Gabriel Valley and Huntington Beach county’s rates are relatively similar. Their rates are slightly above the national average, which is typical for most California cities due to the high cost of public services.
Income
Type
East San Gabriel Valley
Huntington Beach
Estimated median household income
$95,242
$107,808
Estimated per capita income
$34,474
$56,934
Cost of living index (U.S. average is 100)
150.2
89.5
If you make $50,000 in Huntington Beach, you will have to make $83,911 in East San Gabriel Valley to maintain the same standard of living.
Geographical Conditions
Geographical conditions also differ - with Huntington Beach located on the coastline, it offers beachfront living, while East San Gabriel Valley is landlocked but with beautiful green spaces and parks.
Geographical information
Type
East San Gabriel Valley
Huntington Beach
Land area
212.6 sq. miles
26.4 sq. miles
Population density
4,478.5 people per sq. mile
7,451.1 people per sq. mile
Relative area comparison
East San Gabriel Valley, CA Huntington Beach, CA
Education
East San Gabriel Valley prides itself on its exceptional education system, particularly in the area of higher education. Conversely, Huntington Beach also places a strong emphasis on education, offering a variety of highly rated primary and secondary schools.
Both regions have strong economies with low unemployment rates. Huntington Beach is particularly lucrative for those in medical professions, retail, and education sectors. The East San Gabriel Valley area also offers good work opportunities, particularly in sectors like manufacturing, retail trade, and healthcare.
Biggest Employers
In Huntington Beach, some of the largest employers are Boeing, Quiksilver, and Huntington Beach Hospital. East San Gabriel's largest employers are Citrus College, the Hacienda La Puente Unified School District, and the Northview Intermediate School District.
In East San Gabriel Valley (Los Angeles County), 69.7% voted for Democrats and 27.8% for Republicans in 2012 Presidential Election. In Huntington Beach (Orange County), 45.8% voted for Democrats and 52.0% for Republicans.
Elections
Type
Democrats
Republicans
Other
Year
East San Gabriel Valley
Huntington Beach
East San Gabriel Valley
Huntington Beach
East San Gabriel Valley
Huntington Beach
2020
71.0%
53.6%
26.9%
44.6%
2.1%
1.8%
2016
72.0%
50.9%
22.5%
42.4%
5.5%
6.7%
2012
69.7%
45.8%
27.8%
52.0%
2.4%
2.3%
2008
69.2%
47.8%
28.8%
50.3%
1.9%
1.9%
2004
63.3%
39.3%
35.7%
60.2%
1.0%
0.5%
2000
63.6%
40.4%
32.4%
55.9%
4.0%
3.7%
1996
59.3%
37.9%
31.0%
51.7%
9.7%
10.5%
Breakdown of population affiliated with a religious congregation
Type
Adherents
Congregations
Religion
East San Gabriel Valley
Huntington Beach
East San Gabriel Valley
Huntington Beach
CATHOLIC CHURCH
36.1%
26.5%
4.7%
4.4%
SOUTHERN BAPTIST CONVENTION
1.0%
2.3%
9.0%
8.8%
MUSLIM ESTIMATE
0.7%
0.8%
1.0%
1.3%
AMERICAN BAPTIST CHURCHES IN THE USA
0.5%
0.2%
3.1%
1.7%
SEVENTH DAY ADVENTIST CHURCH
0.5%
0.4%
2.4%
1.3%
EPISCOPAL CHURCH
0.4%
0.4%
1.4%
1.4%
EVANGELICAL LUTHERAN CHURCH IN AMERICA
0.2%
0.4%
1.9%
2.3%
LUTHERAN CHURCH
0.2%
0.6%
1.6%
2.0%
REFORMED CHURCH IN AMERICA
0.1%
0.3%
0.2%
0.2%
Weather
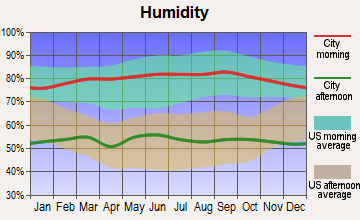
Both regions benefit from stunning California weather. If you crave warm, mild winters, and hot, dry summers, both locations will suit you perfectly. However, Huntington Beach generally enjoys a bit cooler temperatures due to its coastal location, making it a popular destination for beach lovers.
Weather and climate
Type
East San Gabriel Valley
Huntington Beach
Temperature - Average
62.7°F
64.3°F
Humidity - Average morning or afternoon humidity
64.7%
70.1%
Humidity - Differences between morning and afternoon humidity
19.6%
26.7%
Humidity - Maximum monthly morning or afternoon humidity
70.7%
78.7%
Humidity - Minimum monthly morning or afternoon humidity
51%
52%
Precipitation - Yearly average
19.1 in
12.9 in
Snowfall - Yearly average
0 in
0 in
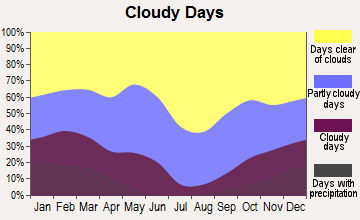
Clouds - Number of days clear of clouds
28.3%
26.5%
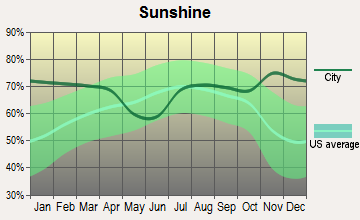
Sunshine amount - Average
78.4%
78.4%
Sunshine amount - Differences during a year
22%
21.9%
Sunshine amount - Maximum monthly
85%
84.8%
Sunshine amount - Minimum monthly
63%
62.9%
Wind speed - Average
3.7 mph
6 mph
Average climate in East San Gabriel Valley, California
Average climate in Huntington Beach, California
Air pollution
Type
AQI
CO
NO2
OZONE
PB
PM10
PM25
SO2
Year
East San Gabriel Valley
Huntington Beach
East San Gabriel Valley
Huntington Beach
East San Gabriel Valley
Huntington Beach
East San Gabriel Valley
Huntington Beach
East San Gabriel Valley
Huntington Beach
East San Gabriel Valley
Huntington Beach
East San Gabriel Valley
Huntington Beach
East San Gabriel Valley
Huntington Beach
2018
143
119
0.36
0.35
14.1
14.5
29.2
26.2
0.007
N/A
29.6
27.5
13.4
12.7
0.3
0.7
2017
150
116
0.35
0.33
14.8
13.6
30.5
29.3
0.007
N/A
32.7
26.7
12.6
13.9
0.3
0.5
2016
141
102
0.31
0.31
15.5
11.8
29.3
29.9
0.007
N/A
30.3
24.1
12.0
12.4
0.3
0.2
2015
145
106
0.30
0.30
15.2
12.8
30.4
30.4
0.007
N/A
30.0
25.0
14.6
14.4
0.2
0.2
2014
142
110
0.32
0.27
16.8
12.4
29.7
29.0
0.008
N/A
33.6
26.7
11.7
15.4
0.3
0.4
2013
147
107
0.33
0.32
17.0
13.4
27.7
28.2
0.007
0.003
31.5
29.7
11.5
14.2
0.4
0.3
2012
149
103
0.39
0.27
18.3
12.1
27.5
27.1
0.005
0.004
30.9
28.3
15.6
14.3
0.6
0.1
2011
149
109
0.40
0.30
18.6
14.2
26.7
27.3
0.008
0.006
30.3
27.7
17.3
15.8
0.5
0.7
2010
139
102
0.44
0.31
19.3
13.6
26.8
26.5
N/A
0.011
26.6
23.6
14.8
13.9
0.4
0.6
2009
156
118
0.40
0.33
21.0
14.9
28.0
28.1
0.010
0.009
26.0
24.3
16.5
14.4
0.6
1.1
2008
156
124
0.48
0.38
22.7
15.7
27.7
28.7
0.012
0.010
27.0
29.3
15.1
21.6
1.0
1.1
2007
135
100
0.52
0.35
25.3
15.6
24.8
27.4
0.014
0.012
N/A
N/A
N/A
N/A
1.3
0.8
2006
128
114
0.55
0.39
25.1
16.6
24.0
26.6
0.009
0.007
N/A
N/A
N/A
N/A
1.9
1.3
2005
127
95
0.59
0.37
25.7
16.8
22.8
28.2
0.014
0.012
N/A
N/A
N/A
N/A
1.9
1.3
2004
132
119
0.68
0.49
25.4
18.5
24.6
30.6
0.016
0.014
N/A
N/A
N/A
N/A
1.7
1.6
2003
137
122
0.80
0.63
29.9
21.1
24.7
30.0
0.021
0.030
N/A
N/A
N/A
N/A
1.4
1.1
2002
134
106
0.83
0.63
31.4
21.2
23.1
26.3
0.021
0.018
N/A
N/A
N/A
N/A
2.0
1.7
2001
141
116
1.00
0.71
31.8
21.0
21.4
26.0
0.029
0.033
N/A
N/A
N/A
N/A
2.1
1.5
2000
150
125
1.05
0.80
34.7
23.3
20.7
24.6
0.027
0.027
N/A
N/A
N/A
N/A
2.0
1.9
Natural disasters
Type
East San Gabriel Valley
Huntington Beach
Tornado activity compared to U.S. average
18.5%
18.5%
Earthquake activity compared to U.S. average
7,292.4%
6,818%
Natural disasters compared to U.S. average
57%
32%
Transportation
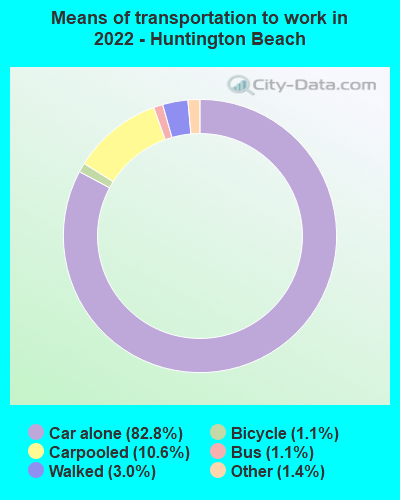
Despite being well-situated with access to major freeways and transportation hubs, both areas do experience their share of California traffic, particularly during peak commuting hours. However, both Huntington Beach and East San Gabriel Valley offer reliable public transit options including buses, light rail, and accessible pedestrian and bicycle routes.
Transport
Type
East San Gabriel Valley
Huntington Beach
Amtrak stations nearby
3
3
FAA registered aircraft
0
156
FAA registered aircraft manufacturers and dealers
0
6
Means of transportation to work
Type
East San Gabriel Valley
Huntington Beach
Bicycle
0.6%
0.4%
Bus
2.9%
1.1%
Carpooled
17.1%
9.8%
Car alone
73.3%
85.3%
Motorcycle
0.2%
0.2%
Railroad
0.6%
0%
Walked
2.2%
2%
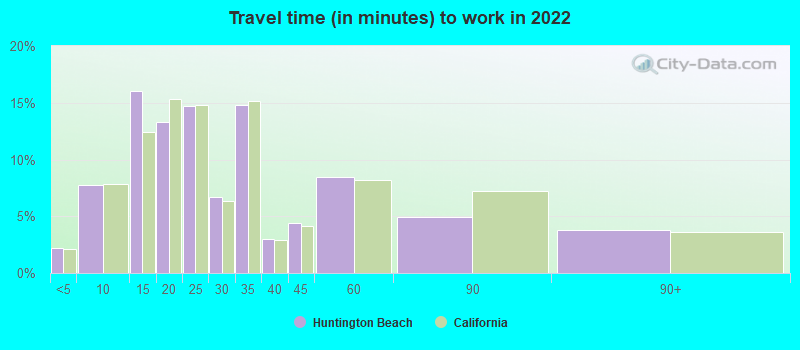
Average travel time to work
Type
East San Gabriel Valley
Huntington Beach
Average
32.3 min
25.6 min
Real Estate
Real estate in both areas tends to be quite pricey due to the attractive amenities and desirable California lifestyle. That said, property in Huntington Beach is generally more expensive due to its beach location, while East San Gabriel Valley offers slightly more affordable options.
Neighborhoods
In both Huntington Beach and East San Gabriel Valley, you'll find a diversity of neighborhoods ranging from upscale, gated communities to more affordable, family-friendly areas. Both areas are known for their safe, clean, and pleasant neighborhoods.
Houses and residents
Type
East San Gabriel Valley
Huntington Beach
Houses
270,240
83,658
Average household size (people)
3.5
2.6
Houses occupied
263,338 (97.4%)
79,930 (95.5%)
Houses occupied by owners
180,683 (68.6%)
45,454 (56.9%)
Houses occupied by renters
82,655 (31.4%)
34,476 (43.1%)
Median rent asked for vacant for-rent units
$1,935
$2,370
Median price asked for vacant for-sale houses and condos
$1,138,428
$672,773
Estimated median house or condo value
$643,048
$937,200
Median number of rooms in apartments
3.7
4.1
Median number of rooms in houses and condos
5.9
6.2
Renting percentage
32.3%
39.5%
Housing density (houses/condos per square mile)
1,270.8
3,169.8
Household income disparities
40.3%
40.7%
Housing units without a mortgage
26,635 (16.4%)
644 (2.2%)
Housing units with both a second mortgage and home equity loan
Self-employed workers in own not incorporated business
25,753
7,644
State government workers
13,845
2,609
Unpaid family workers
1,494
245
Industries and Occupations
The most popular industries in Huntington Beach include healthcare, retail trade and education, while in East San Gabriel Valley, retail trade, healthcare and manufacturing are most prominent. Employment opportunities may therefore be more abundant in these sectors for those considering a move.
Both regions offer advanced healthcare facilities with a high standard of care. With numerous hospitals, clinics, and specialized health centers, residents have ample healthcare options.
Health (county statistics)
Type
East San Gabriel Valley
Huntington Beach
General health status score of residents in this county from 1 (poor) to 5 (excellent)
Infrastructure in both regions is well-developed to support the growing population and economy. Huntington Beach boasts striking ocean views and maintained beaches, while East San Gabriel Valley is characterized by its beautiful parks and open spaces. Both areas have good road and public transit systems.
Infrastructure
Type
East San Gabriel Valley
Huntington Beach
TV stations
24
2
Culture and Food
Both regions enjoy a rich cultural landscape and a varied food scene. Huntington Beach is known for its vibrant surf culture, while East San Gabriel Valley is noted for its diverse Asian influences that are reflected in numerous local eateries.
Sports Teams
Neither East San Gabriel Valley nor Huntington Beach are home to major league sports teams, but both have proximity to such teams in nearby Los Angeles including the Lakers (NBA), Dodgers (MLB), and Rams (NFL).
 East San Gabriel Valley, CA
 Huntington Beach, CA