Living in East San Gabriel Valley, CA and Irving, TX brings unique experiences shaped by factors ranging from weather patterns to local amenities. Both regions offer opportunities for career advancement, education, and personal growth, although the differences in cost of living, state taxes, and cultural traditions may sway your decision. The focus of this comparison is to explore the specifics of each area, providing perspective for potential residents, and a quick guide for tourists too.
The crime rates in East San Gabriel Valley, CA are higher than the national average, much like those in Irving, TX. However, the East San Gabriel Valley reported relatively fewer violent crimes. Both areas prioritize safety, with local law enforcement agencies aiming to combat crime and ensure resident and visitor safety.
Cost of Living
Living in East San Gabriel Valley, CA is generally more expensive than in Irving, TX due to the high cost of housing. Irving's lower cost of living might be an appealing feature for potential residents looking to stretch their dollar further.
Income Tax
The cost of living in Irving, TX, is considerably reduced due to the absence of a state income tax, unlike in East San Gabriel Valley, CA, where state income tax ranges from 1% to 13.3%.
Property Tax
Property taxes in Texas are significantly higher than in California. This factor should be considered when assessing the affordability of housing between the two locations.
Sales Tax
California state imposes a higher sales tax than Texas. Therefore, depending on the resident’s purchasing habits, living in Irving, TX, could lead to significant savings.
Income
Type
East San Gabriel Valley
Irving
Estimated median household income
$95,242
$70,340
Estimated per capita income
$34,474
$36,210
Cost of living index (U.S. average is 100)
150.2
95.5
If you make $50,000 in Irving, you will have to make $78,639 in East San Gabriel Valley to maintain the same standard of living.
Geographical Conditions
The East San Gabriel Valley is characterized by beautiful mountain ranges, while Irving, TX, is a flat area with a few lakes scattered throughout the city.
Geographical information
Type
East San Gabriel Valley
Irving
Land area
212.6 sq. miles
67.2 sq. miles
Population density
4,478.5 people per sq. mile
3,781.1 people per sq. mile
Relative area comparison
East San Gabriel Valley, CA Irving, TX
Education
Both regions offer a wide range of educational opportunities with a multitude of public and private schools. Yet, East San Gabriel Valley, CA schools consistently rank higher than Irving, TX, indicating better education standards.
East San Gabriel Valley, CA, and Irving, TX, have robust economies. Several Fortune 500 companies have headquarters in Irving, attracting professionals from various fields. However, San Gabriel Valley is not far behind with its diversity of industries and potential job opportunities.
Biggest Employers
In East San Gabriel Valley, the biggest employers are healthcare institutions and school districts. Irving, TX, boasts headquarters for several Fortune 500 companies, providing numerous opportunities for employment.
In East San Gabriel Valley (Los Angeles County), 69.7% voted for Democrats and 27.8% for Republicans in 2012 Presidential Election. In Irving (Dallas County), 57.3% voted for Democrats and 41.8% for Republicans.
Elections
Type
Democrats
Republicans
Other
Year
East San Gabriel Valley
Irving
East San Gabriel Valley
Irving
East San Gabriel Valley
Irving
2020
71.0%
65.1%
26.9%
33.4%
2.1%
1.4%
2016
72.0%
60.8%
22.5%
34.7%
5.5%
4.5%
2012
69.7%
57.3%
27.8%
41.8%
2.4%
1.0%
2008
69.2%
57.4%
28.8%
42.0%
1.9%
0.6%
2004
63.3%
49.0%
35.7%
50.4%
1.0%
0.5%
2000
63.6%
45.0%
32.4%
52.7%
4.0%
2.4%
1996
59.3%
46.0%
31.0%
46.8%
9.7%
7.2%
Breakdown of population affiliated with a religious congregation
Type
Adherents
Congregations
Religion
East San Gabriel Valley
Irving
East San Gabriel Valley
Irving
CATHOLIC CHURCH
36.1%
18.9%
4.7%
2.4%
SOUTHERN BAPTIST CONVENTION
1.0%
11.0%
9.0%
31.1%
MUSLIM ESTIMATE
0.7%
3.6%
1.0%
1.1%
AMERICAN BAPTIST CHURCHES IN THE USA
0.5%
0.1%
3.1%
0.2%
SEVENTH DAY ADVENTIST CHURCH
0.5%
0.5%
2.4%
1.7%
EPISCOPAL CHURCH
0.4%
1.0%
1.4%
1.5%
EVANGELICAL LUTHERAN CHURCH IN AMERICA
0.2%
0.3%
1.9%
0.9%
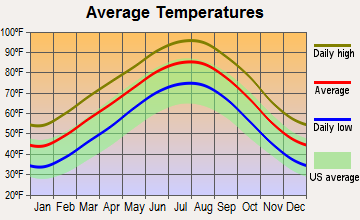
Weather
The East San Gabriel Valley has a comfortable year-round climate, which is one of the main draws for residents and tourists. On the other hand, Irving, Texas, has a more varied climate with hot summers and mild winters. But, for those who enjoy hot weather, Texas might be preferable.
Weather and climate
Type
East San Gabriel Valley
Irving
Temperature - Average
62.7°F
65.6°F
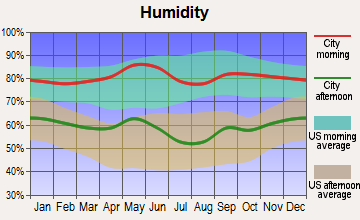
Humidity - Average morning or afternoon humidity
64.7%
71.3%
Humidity - Differences between morning and afternoon humidity
19.6%
34%
Humidity - Maximum monthly morning or afternoon humidity
70.7%
82%
Humidity - Minimum monthly morning or afternoon humidity
51%
48%
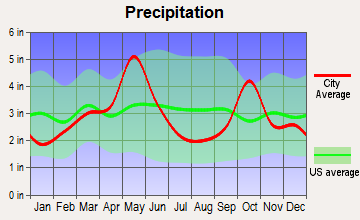
Precipitation - Yearly average
19.1 in
35.2 in
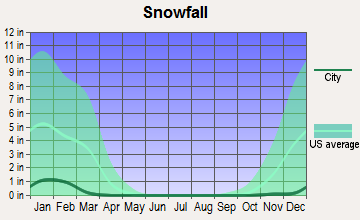
Snowfall - Yearly average
0 in
4.2 in
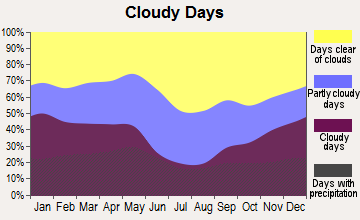
Clouds - Number of days clear of clouds
28.3%
22.8%
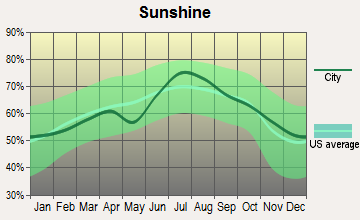
Sunshine amount - Average
78.4%
66.6%
Sunshine amount - Differences during a year
22%
20%
Sunshine amount - Maximum monthly
85%
74%
Sunshine amount - Minimum monthly
63%
54%
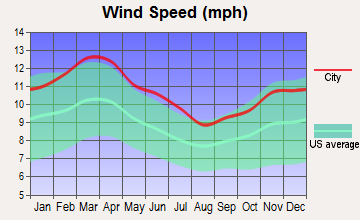
Wind speed - Average
3.7 mph
10.3 mph
Average climate in East San Gabriel Valley, California
Average climate in Irving, Texas
Air pollution
Type
AQI
CO
NO2
OZONE
PB
PM10
PM25
SO2
Year
East San Gabriel Valley
Irving
East San Gabriel Valley
Irving
East San Gabriel Valley
Irving
East San Gabriel Valley
Irving
East San Gabriel Valley
Irving
East San Gabriel Valley
East San Gabriel Valley
Irving
East San Gabriel Valley
Irving
2018
143
86
0.36
N/A
14.1
5.8
29.2
28.6
0.007
N/A
29.6
N/A
13.4
9.7
0.3
0.4
2017
150
84
0.35
N/A
14.8
5.7
30.5
28.9
0.007
N/A
32.7
N/A
12.6
9.1
0.3
0.3
2016
141
81
0.31
N/A
15.5
6.2
29.3
27.3
0.007
N/A
30.3
N/A
12.0
8.4
0.3
0.2
2015
145
83
0.30
N/A
15.2
6.6
30.4
26.9
0.007
N/A
30.0
N/A
14.6
8.9
0.2
0.3
2014
142
83
0.32
0.22
16.8
6.4
29.7
28.0
0.008
N/A
33.6
N/A
11.7
9.9
0.3
0.3
2013
147
96
0.33
0.25
17.0
7.0
27.7
29.1
0.007
N/A
31.5
N/A
11.5
13.0
0.4
0.2
2012
149
112
0.39
0.26
18.3
8.4
27.5
31.4
0.005
N/A
30.9
N/A
15.6
12.0
0.6
0.3
2011
149
97
0.40
0.23
18.6
8.9
26.7
31.3
0.008
N/A
30.3
N/A
17.3
11.9
0.5
0.6
2010
139
76
0.44
0.23
19.3
9.2
26.8
28.5
N/A
N/A
26.6
N/A
14.8
N/A
0.4
0.7
2009
156
88
0.40
0.25
21.0
9.1
28.0
29.3
0.010
N/A
26.0
N/A
16.5
N/A
0.6
0.5
2008
156
88
0.48
0.25
22.7
9.8
27.7
29.0
0.012
0.121
27.0
N/A
15.1
N/A
1.0
0.5
2007
135
94
0.52
0.30
25.3
10.8
24.8
26.0
0.014
0.070
N/A
N/A
N/A
N/A
1.3
0.3
2006
128
105
0.55
0.34
25.1
10.7
24.0
30.8
0.009
0.106
N/A
N/A
N/A
N/A
1.9
0.7
2005
127
110
0.59
0.34
25.7
12.7
22.8
30.0
0.014
0.142
N/A
N/A
N/A
11.1
1.9
0.9
2004
132
96
0.68
0.39
25.4
11.9
24.6
26.6
0.016
0.099
N/A
N/A
N/A
N/A
1.7
0.8
2003
137
102
0.80
0.40
29.9
13.0
24.7
27.9
0.021
0.121
N/A
N/A
N/A
N/A
1.4
1.0
2002
134
100
0.83
0.37
31.4
13.6
23.1
26.0
0.021
0.080
N/A
N/A
N/A
N/A
2.0
0.4
2001
141
100
1.00
0.48
31.8
14.1
21.4
27.2
0.029
0.069
N/A
N/A
N/A
N/A
2.1
1.0
2000
150
109
1.05
0.55
34.7
14.5
20.7
28.1
0.027
0.092
N/A
N/A
N/A
N/A
2.0
1.1
Natural disasters
Type
East San Gabriel Valley
Irving
Tornado activity compared to U.S. average
18.5%
255.8%
Earthquake activity compared to U.S. average
7,292.4%
574.6%
Natural disasters compared to U.S. average
57%
21%
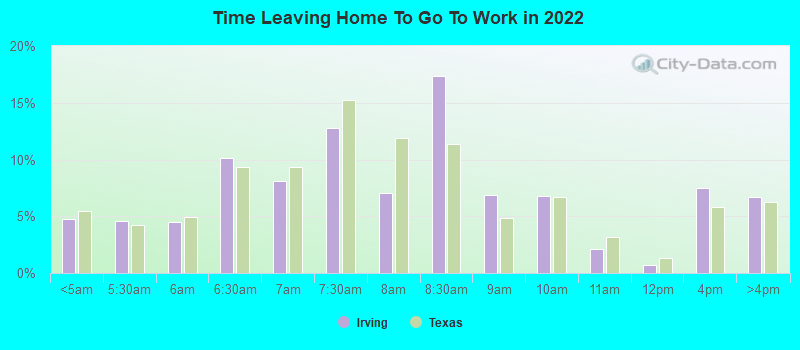
Transportation
Both regions fare well in transportation services. However, East San Gabriel Valley, CA has a slightly better public transit system and shorter commute times than Irving, TX.
Transport
Type
East San Gabriel Valley
Irving
Amtrak stations nearby
3
1
FAA registered aircraft
0
112
FAA registered aircraft manufacturers and dealers
0
5
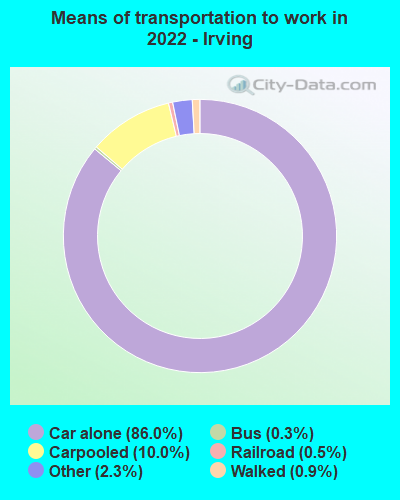
Means of transportation to work
Type
East San Gabriel Valley
Irving
Bicycle
0.6%
0%
Bus
2.9%
0.4%
Carpooled
17.1%
9.9%
Car alone
73.3%
85.5%
Motorcycle
0.2%
0.1%
Railroad
0.6%
0.4%
Subway
0.1%
0.1%
Taxicab
0%
0.2%
Walked
2.2%
1.3%
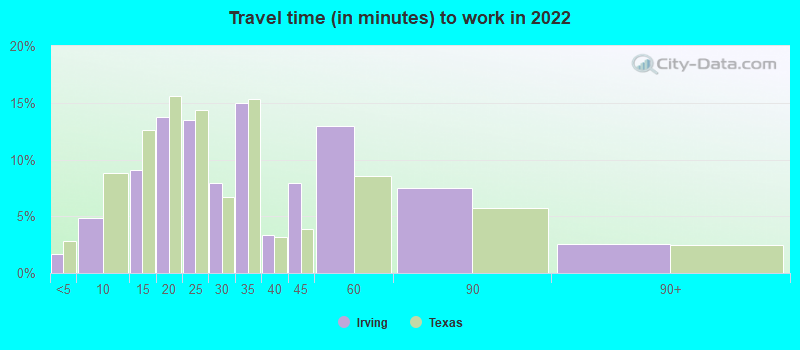
Average travel time to work
Type
East San Gabriel Valley
Irving
Average
32.3 min
31.5 min
Real Estate
The real estate market in East San Gabriel Valley is expensive, with homes being priced well above the national average. Conversely, in Irving, the real estate market is more accessible, with more reasonably priced housing options.
Neighborhoods
East San Gabriel Valley boasts affluent neighborhoods with upscale amenities and breathtaking views. Irving, TX, also has its share of charming neighborhoods, but with a more down-to-earth and family-friendly atmosphere.
Houses and residents
Type
East San Gabriel Valley
Irving
Houses
270,240
100,800
Average household size (people)
3.5
2.6
Houses occupied
263,338 (97.4%)
95,309 (94.6%)
Houses occupied by owners
180,683 (68.6%)
34,544 (36.2%)
Houses occupied by renters
82,655 (31.4%)
60,765 (63.8%)
Median rent asked for vacant for-rent units
$1,935
$1,063
Median price asked for vacant for-sale houses and condos
$1,138,428
$665,016
Estimated median house or condo value
$643,048
$274,100
Median number of rooms in apartments
3.7
3.5
Median number of rooms in houses and condos
5.9
6.1
Renting percentage
32.3%
61.6%
Housing density (houses/condos per square mile)
1,270.8
1,499.4
Household income disparities
40.3%
42.4%
Housing units without a mortgage
26,635 (16.4%)
261 (1.2%)
Housing units with both a second mortgage and home equity loan
515 (0.3%)
547 (2.6%)
Housing units with a mortgage
136,243 (83.6%)
21,104 (98.8%)
Housing units with a home equity loan
11,429 (7%)
79 (0.4%)
Housing units with a second mortgage
21,150 (13%)
681 (3.2%)
Housing units lacking complete kitchen facilities
1%
2.2%
Housing units lacking complete plumbing facilities
Self-employed workers in own not incorporated business
25,753
9,391
State government workers
13,845
2,329
Unpaid family workers
1,494
283
Industries and Occupations
East San Gabriel Valley, CA has a diversified economy with industries such as healthcare, education, and retail. Meanwhile, Irving, TX, home to several large corporations, leans towards finance, tech industries, and telecommunications.
Both regions offer excellent healthcare facilities. The East San Gabriel Valley is a hub for several renowned healthcare institutions, while Irving, TX, also boasts numerous quality hospitals and clinics.
Health (county statistics)
Type
East San Gabriel Valley
Irving
General health status score of residents in this county from 1 (poor) to 5 (excellent)
Both regions have strong infrastructure systems with continual development projects in place. East San Gabriel Valley, CA, provides a somewhat superior quality of public services compared to Irving, TX.
Infrastructure
Type
East San Gabriel Valley
Irving
TV stations
24
26
Culture and Food
East San Gabriel Valley offers a diverse cultural palette with food from different nationalities, while Irving, Texas, thrives on traditional American and Tex-Mex cuisine.
Sports Teams
While Irving, TX, is home to well-known sports teams such as the Dallas Cowboys, the East San Gabriel Valley stands out for its accessibility to Los Angeles' vast sports landscape.
 East San Gabriel Valley, CA
 Irving, TX