Looking to compare the lifestyles of East San Gabriel Valley, CA, and Laredo, TX? When considering these two locations, one must understand their different climates, economies, cost of living, and educational systems among other things. Both have unique characteristics, making them attractive to various people. By contrasting East San Gabriel Valley's suburban atmosphere to Laredo's border town charm, future residents or tourists can find information pertinent to their interests.
Comparatively, East San Gabriel Valley has a lower crime rate than Laredo. Though the former has a slightly higher property crime rate, violent crimes are more prevalent in Laredo. Both areas, however, have comprehensive police departments ensuring safety and enforcing laws. Tourists and potential residents should still stay vigilant and practice the usual safety measures.
Cost of Living
The cost of living in the East San Gabriel Valley generally exceeds that of Laredo. From housing to groceries, prices are considerably higher in the California area. Those considering relocating should factor in these costs, though wage rates tend to be higher in California to compensate.
Income Tax
In terms of income tax, Texas has a clear advantage as it does not levy state income tax. California, however, imposes a progressive income tax which could be as high as 13.3% for the highest earners.
Property Tax
Property taxes are also significantly different. California's average property tax rate is lower at around 0.73%, but higher property values can lead to larger bills. Alternatively, Texas has higher property tax rates, around 1.83% in Webb County where Laredo is located, but lower property values.
Sales Tax
Sales tax rates in California are higher than those in Texas. For East San Gabriel Valley, these rates can be up to 10.25%, while in Laredo, the combined state and city sales tax rate is 8.25%.
Income
Type
East San Gabriel Valley
Laredo
Estimated median household income
$95,242
$52,438
Estimated per capita income
$34,474
$21,785
Cost of living index (U.S. average is 100)
150.2
82.6
If you make $50,000 in Laredo, you will have to make $90,920 in East San Gabriel Valley to maintain the same standard of living.
Geographical Conditions
In terms of geography, East San Gabriel Valley sits within the wider Los Angeles Basin and has a mix of suburban and mountainous terrain. Laredo, on the Rio Grande River, has a flat landscape and is located in a significant wildlife corridor known for its biodiversity.
Geographical information
Type
East San Gabriel Valley
Laredo
Land area
212.6 sq. miles
78.5 sq. miles
Population density
4,478.5 people per sq. mile
3,264.8 people per sq. mile
Relative area comparison
East San Gabriel Valley, CA Laredo, TX
Education
Both areas have a range of educational opportunities. East San Gabriel Valley hosts several quality school districts and is proximate to higher institutions like the University of Southern California. Laredo houses Texas A&M International University and Laredo College. Both meet various educational needs, but overall, California often ranks higher for education.
The work and economic outlook in these areas varies. East San Gabriel Valley, part of the wider Los Angeles metro area, offers a diverse economy with opportunities in entertainment, technology, logistics and more. Laredo's economy centers more on international trade due to its prime location on the U.S-Mexican border.
Biggest Employers
In East San Gabriel Valley, the Los Angeles County, local school districts and Kaiser Permanente are among the largest employers. Laredo's international trade sector significantly influences its job market, with top employers being Laredo Independent School District, U.S. Customs and Border Protection and Universal Logistics Holdings.
In East San Gabriel Valley (Los Angeles County), 69.7% voted for Democrats and 27.8% for Republicans in 2012 Presidential Election. In Laredo (Webb County), 76.4% voted for Democrats and 22.5% for Republicans.
Elections
Type
Democrats
Republicans
Other
Year
East San Gabriel Valley
Laredo
East San Gabriel Valley
Laredo
East San Gabriel Valley
Laredo
2020
71.0%
61.1%
26.9%
37.9%
2.1%
1.0%
2016
72.0%
74.4%
22.5%
22.8%
5.5%
2.9%
2012
69.7%
76.4%
27.8%
22.5%
2.4%
1.1%
2008
69.2%
71.5%
28.8%
28.0%
1.9%
0.4%
2004
63.3%
57.0%
35.7%
42.7%
1.0%
0.3%
2000
63.6%
57.6%
32.4%
41.6%
4.0%
0.8%
1996
59.3%
76.7%
31.0%
19.0%
9.7%
4.3%
Breakdown of population affiliated with a religious congregation
Type
Adherents
Congregations
Religion
East San Gabriel Valley
Laredo
East San Gabriel Valley
Laredo
CATHOLIC CHURCH
36.1%
50.6%
4.7%
18.8%
SOUTHERN BAPTIST CONVENTION
1.0%
1.2%
9.0%
21.0%
MUSLIM ESTIMATE
0.7%
1.0%
1.0%
0.7%
AMERICAN BAPTIST CHURCHES IN THE USA
0.5%
0.0%
3.1%
0.0%
SEVENTH DAY ADVENTIST CHURCH
0.5%
0.3%
2.4%
2.9%
EPISCOPAL CHURCH
0.4%
0.1%
1.4%
0.7%
Weather
Climate-wise, East San Gabriel Valley enjoys a Mediterranean climate with mild winters and warm summers, making it a pleasant location for individuals valuing sunshine and moderate weather. On the contrary, Laredo experiences a hot semi-arid climate, marked by long, hot summers and mild winters. If heat tolerance is a factor, consider these weather markers.
Weather and climate
Type
East San Gabriel Valley
Laredo
Temperature - Average
62.7°F
73.9°F
Humidity - Average morning or afternoon humidity
64.7%
80%
Humidity - Differences between morning and afternoon humidity
19.6%
36.1%
Humidity - Maximum monthly morning or afternoon humidity
70.7%
91.2%
Humidity - Minimum monthly morning or afternoon humidity
51%
55.1%
Precipitation - Yearly average
19.1 in
21.5 in
Snowfall - Yearly average
0 in
0.3 in
Clouds - Number of days clear of clouds
28.3%
17.3%
Sunshine amount - Average
78.4%
64.3%
Sunshine amount - Differences during a year
22%
35.1%
Sunshine amount - Maximum monthly
85%
78.3%
Sunshine amount - Minimum monthly
63%
43.1%
Wind speed - Average
3.7 mph
12.1 mph
Average climate in East San Gabriel Valley, California
Average climate in Laredo, Texas
Air pollution
Type
AQI
CO
NO2
OZONE
PB
PM10
PM25
SO2
Year
East San Gabriel Valley
Laredo
East San Gabriel Valley
Laredo
East San Gabriel Valley
East San Gabriel Valley
Laredo
East San Gabriel Valley
Laredo
East San Gabriel Valley
Laredo
East San Gabriel Valley
East San Gabriel Valley
2018
143
44
0.36
0.20
14.1
N/A
29.2
24.2
0.007
N/A
29.6
N/A
13.4
N/A
0.3
N/A
2017
150
N/A
0.35
N/A
14.8
N/A
30.5
N/A
0.007
N/A
32.7
N/A
12.6
N/A
0.3
N/A
2016
141
37
0.31
0.37
15.5
N/A
29.3
20.0
0.007
N/A
30.3
N/A
12.0
N/A
0.3
N/A
2015
145
41
0.30
0.26
15.2
N/A
30.4
21.1
0.007
N/A
30.0
N/A
14.6
N/A
0.2
N/A
2014
142
43
0.32
0.24
16.8
N/A
29.7
22.6
0.008
N/A
33.6
N/A
11.7
N/A
0.3
N/A
2013
147
51
0.33
0.12
17.0
N/A
27.7
23.5
0.007
N/A
31.5
N/A
11.5
N/A
0.4
N/A
2012
149
N/A
0.39
N/A
18.3
N/A
27.5
N/A
0.005
N/A
30.9
N/A
15.6
N/A
0.6
N/A
2011
149
55
0.40
N/A
18.6
N/A
26.7
28.3
0.008
N/A
30.3
N/A
17.3
N/A
0.5
N/A
2010
139
54
0.44
0.40
19.3
N/A
26.8
22.4
N/A
N/A
26.6
22.3
14.8
N/A
0.4
N/A
2009
156
50
0.40
0.41
21.0
N/A
28.0
22.3
0.010
N/A
26.0
25.1
16.5
N/A
0.6
N/A
2008
156
62
0.48
0.40
22.7
N/A
27.7
20.5
0.012
0.009
27.0
28.0
15.1
N/A
1.0
N/A
2007
135
63
0.52
0.54
25.3
N/A
24.8
22.2
0.014
0.009
N/A
29.5
N/A
N/A
1.3
N/A
2006
128
116
0.55
0.52
25.1
N/A
24.0
21.6
0.009
0.010
N/A
39.3
N/A
N/A
1.9
N/A
2005
127
66
0.59
0.53
25.7
N/A
22.8
22.3
0.014
0.013
N/A
27.5
N/A
N/A
1.9
N/A
2004
132
57
0.68
0.57
25.4
N/A
24.6
22.4
0.016
0.012
N/A
24.2
N/A
N/A
1.7
N/A
2003
137
62
0.80
0.79
29.9
N/A
24.7
24.0
0.021
0.011
N/A
N/A
N/A
N/A
1.4
N/A
2002
134
58
0.83
0.84
31.4
N/A
23.1
24.5
0.021
0.008
N/A
N/A
N/A
N/A
2.0
N/A
2001
141
55
1.00
0.85
31.8
N/A
21.4
22.8
0.029
0.013
N/A
N/A
N/A
N/A
2.1
N/A
2000
150
60
1.05
0.95
34.7
N/A
20.7
22.5
0.027
0.020
N/A
N/A
N/A
N/A
2.0
N/A
Natural disasters
Type
East San Gabriel Valley
Laredo
Tornado activity compared to U.S. average
18.5%
9.6%
Earthquake activity compared to U.S. average
7,292.4%
58.7%
Natural disasters compared to U.S. average
57%
16%
Transportation
Transportation and commute times depend greatly upon the specific location within each of these regions. East San Gabriel Valley, as part of the Greater L.A. region, has extensive public transit systems and highways but also high traffic congestion. Laredo, on the other hand, with smaller populations and less traffic congestion, may allow for easier commutes.
Transport
Type
East San Gabriel Valley
Laredo
Amtrak stations
0
1
Amtrak stations nearby
3
1
FAA registered aircraft
0
135
FAA registered aircraft manufacturers and dealers
0
7
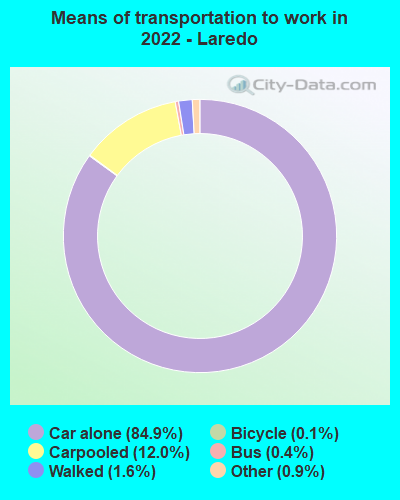
Means of transportation to work
Type
East San Gabriel Valley
Laredo
Bicycle
0.6%
0.1%
Bus
2.9%
1.2%
Carpooled
17.1%
12%
Car alone
73.3%
83.1%
Motorcycle
0.2%
0.1%
Railroad
0.6%
0%
Streetcar
0%
0.1%
Walked
2.2%
1.2%
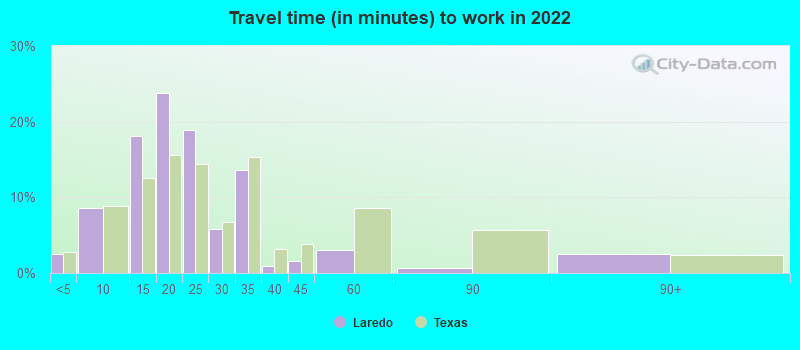
Average travel time to work
Type
East San Gabriel Valley
Laredo
Average
32.3 min
21.3 min
Real Estate
Housing significantly varies between the two areas. Real estate in the East San Gabriel Valley is costly, given the overall high property values in Southern California. Alternatively, Laredo offers more affordable options, which may appeal to those seeking lower housing costs.
Neighborhoods
East San Gabriel Valley encompasses many neighborhoods with strong community ties and excellent amenities. Laredo, whilst smaller, has a rich history represented in neighborhoods like San Agustin de Laredo Historic District.
Houses and residents
Type
East San Gabriel Valley
Laredo
Houses
270,240
82,105
Average household size (people)
3.5
3.7
Houses occupied
263,338 (97.4%)
76,095 (92.7%)
Houses occupied by owners
180,683 (68.6%)
48,145 (63.3%)
Houses occupied by renters
82,655 (31.4%)
27,950 (36.7%)
Median rent asked for vacant for-rent units
$1,935
$660.71
Median price asked for vacant for-sale houses and condos
$1,138,428
$131,192
Estimated median house or condo value
$643,048
$157,400
Median number of rooms in apartments
3.7
4.1
Median number of rooms in houses and condos
5.9
5.7
Renting percentage
32.3%
36.3%
Housing density (houses/condos per square mile)
1,270.8
1,046.5
Household income disparities
40.3%
46.4%
Housing units without a mortgage
26,635 (16.4%)
313 (1.2%)
Housing units with both a second mortgage and home equity loan
515 (0.3%)
431 (1.6%)
Housing units with a mortgage
136,243 (83.6%)
25,985 (98.8%)
Housing units with a home equity loan
11,429 (7%)
3 (0%)
Housing units with a second mortgage
21,150 (13%)
605 (2.3%)
Housing units lacking complete kitchen facilities
1%
3%
Housing units lacking complete plumbing facilities
Self-employed workers in own not incorporated business
25,753
5,131
State government workers
13,845
4,703
Unpaid family workers
1,494
395
Industries and Occupations
The key industries in East San Gabriel Valley are health care, education, arts, entertainment, and professional services. Laredo's economy relies heavily on trade, transportation, utilities, and education.
Health care options are plentiful in East San Gabriel Valley, including many highly rated hospitals. Laredo also has several healthcare facilities, but its options may not be as extensive due to its smaller size.
Health (county statistics)
Type
East San Gabriel Valley
Laredo
General health status score of residents in this county from 1 (poor) to 5 (excellent)
Infrastructure-wise, both areas have their pros and cons. East San Gabriel Valley benefits from the expansive infrastructure of the Greater L.A. region, which includes well-maintained roads, utilities, and public facilities. Laredo, as a smaller city, may lack some of this extensive infrastructure but is rapidly developing due to increasing investment.
Infrastructure
Type
East San Gabriel Valley
Laredo
TV stations
24
7
Culture and Food
Culturally, East San Gabriel Valley offers a diverse blend of culture with numerous options of food, entertainment, and arts influenced by its multicultural population. Laredo's Mexican-American culture profoundly influences the food, music, and festivals in the city, reflecting its rich border-town heritage.
Sports Teams
East San Gabriel Valley is near many major sports franchises in Los Angeles, including the Lakers (NBA), Dodgers (MLB), Rams (NFL), and Kings (NHL). Laredo does not host any major sports teams but does have minor league and college sports.
 East San Gabriel Valley, CA
 Laredo, TX