East San Gabriel Valley, California, and Little Rock, Arkansas, offer distinctive lifestyles, each with its unique attributes and challenges. East San Gabriel Valley boasts of a more temperate climate and a highly diverse cultural landscape. In contrast, Little Rock provides a more affordable cost of living and a stronger sense of community. Various aspects like crime and safety, the cost of living, education, work and economy, and culture make these two locations substantially different yet appealing for different reasons, whether for relocation or travel purposes.
East San Gabriel Valley generally reports lower crime rates than Little Rock, which can make it feel safer for both residents and tourists. It is important to note, however, that crime rates can vary widely from neighborhood to neighborhood in both locations. Little Rock tends to have higher crime rates compared to the national average, which can be a concern for potential residents and visitors.
Cost of Living
The cost of living is significantly higher in East San Gabriel Valley compared to Little Rock. Housing, in particular, is much more expensive in East San Gabriel Valley, while the costs for groceries, utilities, and transportation are also somewhat higher. Little Rock, on the other hand, is known for its affordability, particularly in housing expenses, making it an attractive option for those on a tight budget.
Income Tax
California has a progressive income tax system where rates range from 1% to 13.3%. Arkansas has a marginal tax rate ranging from 0.9% to 6.6%.
Property Tax
Arkansas has lower property tax rates (0.63%) than California (0.77%). However, given the higher property values in East San Gabriel Valley, property owners likely pay considerably more than their counterparts in Little Rock.
Sales Tax
Sales tax rates are higher in California (7.25%) than in Arkansas (6.5%). However, specific local taxes may also apply in both locales.
Income
Type
East San Gabriel Valley
Little Rock
Estimated median household income
$95,242
$53,565
Estimated per capita income
$34,474
$39,600
Cost of living index (U.S. average is 100)
150.2
85.1
If you make $50,000 in Little Rock, you will have to make $88,249 in East San Gabriel Valley to maintain the same standard of living.
Geographical Conditions
East San Gabriel Valley features beautiful mountain views and beaches not too far away, while Little Rock is located by the Arkansas River with a variety of parklands and recreational spots in the vicinity.
Geographical information
Type
East San Gabriel Valley
Little Rock
Land area
212.6 sq. miles
116.2 sq. miles
Population density
4,478.5 people per sq. mile
1,738.3 people per sq. mile
Relative area comparison
East San Gabriel Valley, CA Little Rock, AR
Education
Both areas have a decent range of educational opportunities. East San Gabriel Valley is home to several high-ranked public and private schools, along with esteemed higher education institutions like the Pomona College. Little Rock, conversely, has a rich blend of public schools and is home to the University of Arkansas at Little Rock.
East San Gabriel Valley has a strong economy with healthcare, entertainment, and professional services being key sectors. Meanwhile, Little Rock serves as a regional hub for government, healthcare, and financial services. Both cities offer different yet robust job landscapes.
Biggest Employers
In East San Gabriel Valley, some of the biggest employers include City of Hope National Medical Center and Los Angeles County Department of Health Services. Little Rock is home to large employers such as the State of Arkansas, University of Arkansas for Medical Sciences, and Baptist Health Medical Center.
In East San Gabriel Valley (Los Angeles County), 69.7% voted for Democrats and 27.8% for Republicans in 2012 Presidential Election. In Little Rock (Pulaski County), 54.7% voted for Democrats and 43.3% for Republicans.
Elections
Type
Democrats
Republicans
Other
Year
East San Gabriel Valley
Little Rock
East San Gabriel Valley
Little Rock
East San Gabriel Valley
Little Rock
2020
71.0%
60.5%
26.9%
37.8%
2.1%
1.7%
2016
72.0%
56.1%
22.5%
38.3%
5.5%
5.6%
2012
69.7%
54.7%
27.8%
43.3%
2.4%
2.0%
2008
69.2%
55.3%
28.8%
43.7%
1.9%
0.9%
2004
63.3%
55.2%
35.7%
44.4%
1.0%
0.4%
2000
63.6%
53.8%
32.4%
44.0%
4.0%
2.2%
1996
59.3%
58.8%
31.0%
35.1%
9.7%
6.2%
Breakdown of population affiliated with a religious congregation
Type
Adherents
Congregations
Religion
East San Gabriel Valley
Little Rock
East San Gabriel Valley
Little Rock
CATHOLIC CHURCH
36.1%
6.3%
4.7%
2.7%
SOUTHERN BAPTIST CONVENTION
1.0%
17.8%
9.0%
21.0%
MUSLIM ESTIMATE
0.7%
0.2%
1.0%
0.4%
AMERICAN BAPTIST CHURCHES IN THE USA
0.5%
0.0%
3.1%
0.0%
SEVENTH DAY ADVENTIST CHURCH
0.5%
0.4%
2.4%
0.9%
EPISCOPAL CHURCH
0.4%
1.1%
1.4%
1.6%
LUTHERAN CHURCH
0.2%
0.5%
1.6%
1.3%
AMERICAN BAPTIST ASSOCIATION
0.0%
1.7%
0.2%
4.0%
Weather
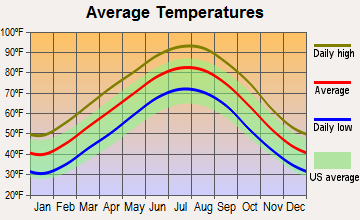
The climate of the two cities varies greatly. East San Gabriel Valley typically enjoys a Mediterranean climate with warm, dry summers and mild, wet winters, making it attractive for outdoor enthusiasts. On the other hand, Little Rock experiences a humid subtropical climate with hot, humid summers and cool winters, which might be more appealing to those who enjoy distinct seasons.
Weather and climate
Type
East San Gabriel Valley
Little Rock
Temperature - Average
62.7°F
62.3°F
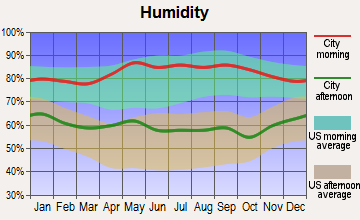
Humidity - Average morning or afternoon humidity
64.7%
76.2%
Humidity - Differences between morning and afternoon humidity
19.6%
35%
Humidity - Maximum monthly morning or afternoon humidity
70.7%
88%
Humidity - Minimum monthly morning or afternoon humidity
51%
53%
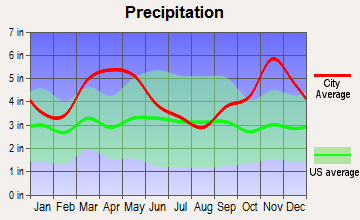
Precipitation - Yearly average
19.1 in
51.4 in
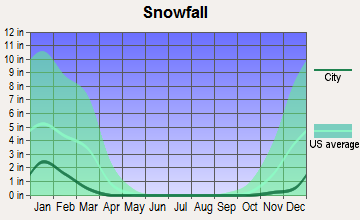
Snowfall - Yearly average
0 in
9.4 in
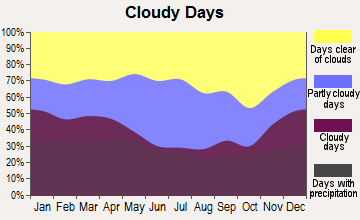
Clouds - Number of days clear of clouds
28.3%
19.8%
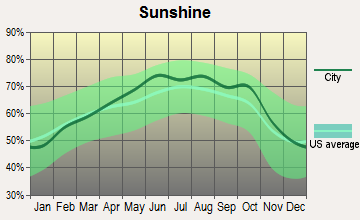
Sunshine amount - Average
78.4%
74%
Sunshine amount - Differences during a year
22%
30%
Sunshine amount - Maximum monthly
85%
82%
Sunshine amount - Minimum monthly
63%
52%
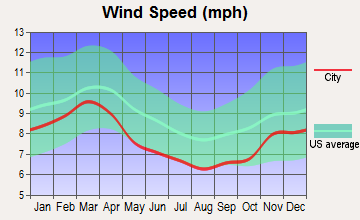
Wind speed - Average
3.7 mph
7.6 mph
Average climate in East San Gabriel Valley, California
Average climate in Little Rock, Arkansas
Air pollution
Type
AQI
CO
NO2
OZONE
PB
PM10
PM25
SO2
Year
East San Gabriel Valley
Little Rock
East San Gabriel Valley
Little Rock
East San Gabriel Valley
Little Rock
East San Gabriel Valley
Little Rock
East San Gabriel Valley
East San Gabriel Valley
East San Gabriel Valley
Little Rock
East San Gabriel Valley
Little Rock
2018
143
67
0.36
0.29
14.1
7.3
29.2
24.7
0.007
N/A
29.6
N/A
13.4
9.2
0.3
0.6
2017
150
70
0.35
0.41
14.8
7.6
30.5
25.5
0.007
N/A
32.7
N/A
12.6
9.5
0.3
0.6
2016
141
64
0.31
0.30
15.5
7.9
29.3
25.4
0.007
N/A
30.3
N/A
12.0
8.7
0.3
0.6
2015
145
64
0.30
0.31
15.2
8.6
30.4
22.8
0.007
N/A
30.0
N/A
14.6
9.0
0.2
1.1
2014
142
69
0.32
0.35
16.8
8.9
29.7
22.6
0.008
N/A
33.6
N/A
11.7
9.4
0.3
1.2
2013
147
70
0.33
0.39
17.0
9.8
27.7
24.7
0.007
N/A
31.5
N/A
11.5
9.5
0.4
1.3
2012
149
81
0.39
0.47
18.3
10.6
27.5
25.8
0.005
N/A
30.9
N/A
15.6
9.9
0.6
1.3
2011
149
81
0.40
0.45
18.6
10.0
26.7
25.5
0.008
N/A
30.3
N/A
17.3
11.3
0.5
1.4
2010
139
72
0.44
0.45
19.3
10.0
26.8
24.8
N/A
N/A
26.6
N/A
14.8
N/A
0.4
1.3
2009
156
62
0.40
0.42
21.0
9.1
28.0
22.0
0.010
N/A
26.0
N/A
16.5
N/A
0.6
1.7
2008
156
59
0.48
0.44
22.7
9.0
27.7
22.6
0.012
N/A
27.0
N/A
15.1
N/A
1.0
1.8
2007
135
75
0.52
0.59
25.3
10.8
24.8
22.1
0.014
N/A
N/A
N/A
N/A
N/A
1.3
3.2
2006
128
75
0.55
0.56
25.1
11.9
24.0
25.3
0.009
N/A
N/A
N/A
N/A
N/A
1.9
3.2
2005
127
87
0.59
0.39
25.7
12.1
22.8
24.1
0.014
N/A
N/A
N/A
N/A
N/A
1.9
1.5
2004
132
68
0.68
0.38
25.4
14.1
24.6
20.5
0.016
N/A
N/A
N/A
N/A
N/A
1.7
2.0
2003
137
78
0.80
0.47
29.9
14.3
24.7
22.0
0.021
N/A
N/A
N/A
N/A
N/A
1.4
2.3
2002
134
81
0.83
0.59
31.4
15.5
23.1
22.9
0.021
N/A
N/A
N/A
N/A
N/A
2.0
2.7
2001
141
82
1.00
N/A
31.8
10.4
21.4
25.9
0.029
N/A
N/A
N/A
N/A
N/A
2.1
N/A
2000
150
78
1.05
N/A
34.7
10.2
20.7
26.0
0.027
N/A
N/A
N/A
N/A
N/A
2.0
N/A
Natural disasters
Type
East San Gabriel Valley
Little Rock
Tornado activity compared to U.S. average
18.5%
253.3%
Earthquake activity compared to U.S. average
7,292.4%
579.4%
Natural disasters compared to U.S. average
57%
26%
Transportation
Both destinations offer reasonable public transit systems. In East San Gabriel Valley, the metro and the bus system provide comprehensive coverage, while Little Rock's River Rail Streetcar and Rock Region Metro Buses are reliable for residents and tourists alike. Both cities also offer a variety of biking and walking trails.
Transport
Type
East San Gabriel Valley
Little Rock
Amtrak stations
0
1
Amtrak stations nearby
3
1
FAA registered aircraft
0
259
FAA registered aircraft manufacturers and dealers
0
35
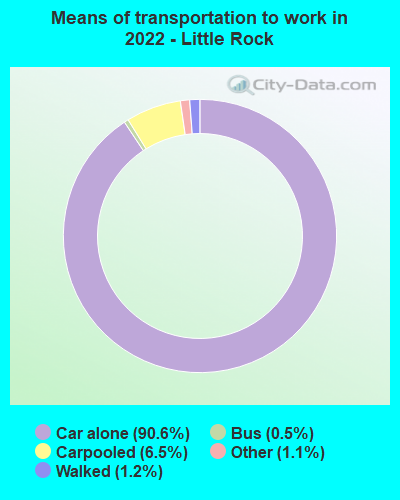
Means of transportation to work
Type
East San Gabriel Valley
Little Rock
Bicycle
0.6%
0.1%
Bus
2.9%
0.4%
Carpooled
17.1%
9.7%
Car alone
73.3%
88.1%
Motorcycle
0.2%
0.1%
Railroad
0.6%
0%
Taxicab
0%
0.3%
Walked
2.2%
0.9%
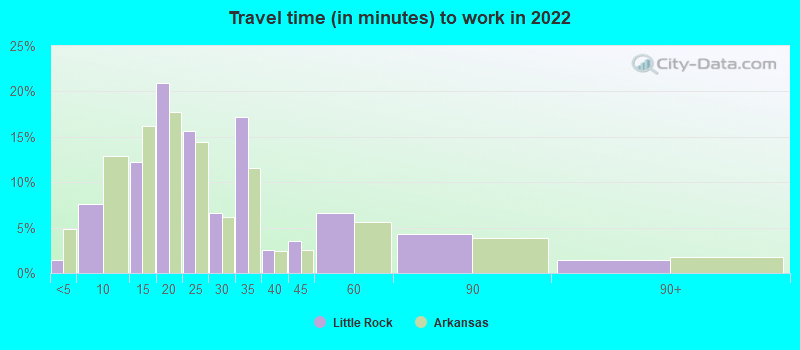
Average travel time to work
Type
East San Gabriel Valley
Little Rock
Average
32.3 min
26 min
Real Estate
Real Estate prices are substantially higher in East San Gabriel Valley than in Little Rock. High demand and low inventory often fuel Southern California's real estate prices. Conversely, Little Rock offers affordable options for both rent and property purchase.
Neighborhoods
East San Gabriel Valley has a variety of neighborhoods each offering a unique flavor. Little Rock also has a vibrant mix of neighborhoods ranging from downtown's historic Quapaw Quarter to the family-friendly West Little Rock.
Houses and residents
Type
East San Gabriel Valley
Little Rock
Houses
270,240
99,876
Average household size (people)
3.5
2.3
Houses occupied
263,338 (97.4%)
89,422 (89.5%)
Houses occupied by owners
180,683 (68.6%)
49,236 (55.1%)
Houses occupied by renters
82,655 (31.4%)
40,186 (44.9%)
Median rent asked for vacant for-rent units
$1,935
$706.04
Median price asked for vacant for-sale houses and condos
$1,138,428
$243,385
Estimated median house or condo value
$643,048
$191,700
Median number of rooms in apartments
3.7
3.9
Median number of rooms in houses and condos
5.9
6.3
Renting percentage
32.3%
43.8%
Housing density (houses/condos per square mile)
1,270.8
859.5
Household income disparities
40.3%
49.3%
Housing units without a mortgage
26,635 (16.4%)
623 (1.9%)
Housing units with both a second mortgage and home equity loan
515 (0.3%)
1,588 (4.8%)
Housing units with a mortgage
136,243 (83.6%)
32,138 (98.1%)
Housing units with a home equity loan
11,429 (7%)
75 (0.2%)
Housing units with a second mortgage
21,150 (13%)
2,366 (7.2%)
Housing units lacking complete kitchen facilities
1%
2.1%
Housing units lacking complete plumbing facilities
Self-employed workers in own not incorporated business
25,753
4,725
State government workers
13,845
9,860
Unpaid family workers
1,494
160
Industries and Occupations
Industries in East San Gabriel Valley are diverse, with healthcare and social assistance being the leading industries. Accommodation and food services also provide numerous employment opportunities. Little Rock, meanwhile, has a strong presence of government services, followed by the healthcare and social assistance industry.
Both locales offer access to quality healthcare systems. East San Gabriel Valley has many reputable hospitals and healthcare facilities within short distances. Little Rock is home to some of the state's largest hospitals like the University of Arkansas for Medical Sciences and Arkansas Children's Hospital.
Health (county statistics)
Type
East San Gabriel Valley
Little Rock
General health status score of residents in this county from 1 (poor) to 5 (excellent)
East San Gabriel Valley benefits from California's extensive infrastructure, with numerous highways, airports, seaports providing easy access to neighboring areas and beyond. Little Rock, while smaller, is served by Bill and Hillary Clinton National Airport and a network of highways. Public facilities in both cities are well-maintained.
Infrastructure
Type
East San Gabriel Valley
Little Rock
TV stations
24
17
Culture and Food
Both locations offer a rich cultural experience. East San Gabriel Valley, thanks to its diverse population, has a wide range of global cuisines, and numerous cultural events throughout the year. Little Rock offers a historic charm with classic Southern hospitality, and its food scene, especially BBQ and farm-to-table cuisine, is quite vibrant.
Sports Teams
Sports fans might find East San Gabriel Valley more appealing, as it is close to Los Angeles, home to numerous professional sports franchises, including the Lakers, Clippers, Dodgers, and Rams. Little Rock, though not hosting major professional teams, has a fervent college sports culture, mainly revolving around the Arkansas Razorbacks.
 East San Gabriel Valley, CA
 Little Rock, AR