The comparison between living in East San Gabriel Valley, CA and Minneapolis, MN reveals distinct cultures, economies, and lifestyle opportunities. Both areas offer unique advantages that cater to different needs, be it in terms of the geographical location, climate, economic opportunities, cost of living, or cultural scenes. Whether for relocation or a visiting trip, understanding vital statistics such as crime rate, infrastructure, taxation, education, work and economy, culture and food, sports, and health care may determine the suitability of either area. This textual analysis provides a comprehensive look into these factors.
East San Gabriel Valley's crime rate is relatively lower than the national average, making it a relatively safe place to live and visit. Minneapolis, however, has a higher crime rate than the national average. The city prioritizes public safety, but it stands as a critical factor to consider before moving or visiting.
Cost of Living
Living in East San Gabriel Valley is generally more expensive compared to Minneapolis. Housing costs and general expenditures in California are among the highest in the country. However, those residing in Minneapolis find the cost of living more affordable, enhanced by a healthy job market that mitigates the expense.
Income Tax
Income tax is higher in California compared to Minnesota. The Golden State imposes a 13.3% tax rate on higher-income earners, while Minnesota's highest income tax rate sits at 9.85%.
Property Tax
In terms of property taxes, Minneapolis exhibits a higher rate than East San Gabriel Valley, pointing to more municipal revenue collection in the former. California has capped their property taxes at 1%, making it more manageable for homeowners.
Sales Tax
California's state sales tax is 7.25%, and the total can reach up to 10.25% with local sales taxes. In contrast, Minnesota's state sales tax is 6.875%, which can add up to 8.025% with Minneapolis's local taxes.
Income
Type
East San Gabriel Valley
Minneapolis
Estimated median household income
$95,242
$69,397
Estimated per capita income
$34,474
$44,836
Cost of living index (U.S. average is 100)
150.2
115.8
If you make $50,000 in Minneapolis, you will have to make $64,853 in East San Gabriel Valley to maintain the same standard of living.
Geographical Conditions
Geographically, East San Gabriel Valley is marked by its rolling hills and proximity to both beaches and mountains. Minneapolis, on the other hand, is flat, characterized by multiple lakes and an abundance of parklands, giving it the beloved moniker "City of Lakes".
Geographical information
Type
East San Gabriel Valley
Minneapolis
Land area
212.6 sq. miles
54.9 sq. miles
Population density
4,478.5 people per sq. mile
7,748.6 people per sq. mile
Relative area comparison
East San Gabriel Valley, CA Minneapolis, MN
Education
Both locations boast reputable education systems. East San Gabriel Valley displays an array of prestigious private schools, while Minneapolis prides itself on an extensively diverse public school system. Both areas present high-quality higher education institutions–Claremont Colleges in the Valley and the University of Minnesota in Minneapolis.
While East San Gabriel Valley's economy is tied to the broader Los Angeles area, with entertainment, aerospace, and technology industries, Minneapolis boosts a diversified economy with health care, retail, and finance sectors. The employment growth rate in both regions is robust and positive.
Biggest Employers
For the East San Gabriel Valley, major employers include institutions from the healthcare sector and the University of Southern California. In Minneapolis, it's a mix of healthcare organizations, including the Mayo Clinic, and financial and retail corporations such as Target and U.S. Bancorp.
In East San Gabriel Valley (Los Angeles County), 69.7% voted for Democrats and 27.8% for Republicans in 2012 Presidential Election. In Minneapolis (Hennepin County), 62.5% voted for Democrats and 35.4% for Republicans.
Elections
Type
Democrats
Republicans
Other
Year
East San Gabriel Valley
Minneapolis
East San Gabriel Valley
Minneapolis
East San Gabriel Valley
Minneapolis
2020
71.0%
70.7%
26.9%
27.4%
2.1%
1.9%
2016
72.0%
63.4%
22.5%
28.3%
5.5%
8.3%
2012
69.7%
62.5%
27.8%
35.4%
2.4%
2.1%
2008
69.2%
63.6%
28.8%
34.9%
1.9%
1.4%
2004
63.3%
59.7%
35.7%
39.7%
1.0%
0.6%
2000
63.6%
53.7%
32.4%
39.4%
4.0%
6.9%
1996
59.3%
54.4%
31.0%
33.2%
9.7%
12.5%
Breakdown of population affiliated with a religious congregation
Type
Adherents
Congregations
Religion
East San Gabriel Valley
Minneapolis
East San Gabriel Valley
Minneapolis
CATHOLIC CHURCH
36.1%
18.7%
4.7%
8.7%
SOUTHERN BAPTIST CONVENTION
1.0%
0.1%
9.0%
1.3%
MUSLIM ESTIMATE
0.7%
0.7%
1.0%
2.7%
AMERICAN BAPTIST CHURCHES IN THE USA
0.5%
0.4%
3.1%
1.3%
SEVENTH DAY ADVENTIST CHURCH
0.5%
0.4%
2.4%
2.9%
EPISCOPAL CHURCH
0.4%
0.7%
1.4%
2.1%
EVANGELICAL LUTHERAN CHURCH IN AMERICA
0.2%
10.8%
1.9%
12.6%
LUTHERAN CHURCH
0.2%
1.6%
1.6%
4.1%
CONSERV CONGREG CHRISTIAN CONFERENCE
0.1%
0.5%
0.1%
0.5%
NATIONA ASSOCIA CONGREG CHRISTIAN CHURCHES
0.0%
0.4%
0.1%
0.2%
WISCONSIN EVANGELICAL LUTHERAN SYNOD
0.0%
0.4%
0.1%
1.4%
Weather
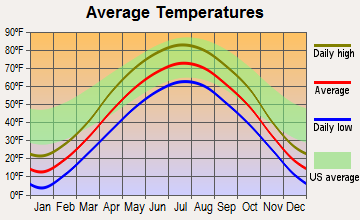
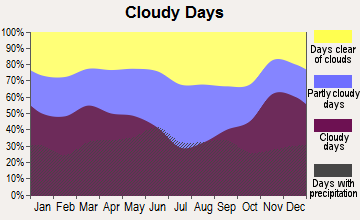
The weather in East San Gabriel Valley, CA is mild and pleasant year-round compared to Minneapolis, MN, known for its extremely cold winters. Minnesota's "twin cities" have a much harsher climate, with cold, long winters and short, hot summers. This could either be attractive or off-putting, depending on one's weather preference.
Weather and climate
Type
East San Gabriel Valley
Minneapolis
Temperature - Average
62.7°F
45.3°F
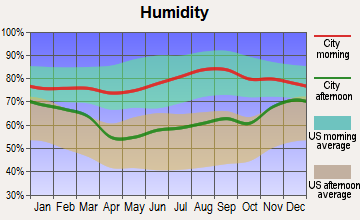
Humidity - Average morning or afternoon humidity
64.7%
74.9%
Humidity - Differences between morning and afternoon humidity
19.6%
33%
Humidity - Maximum monthly morning or afternoon humidity
70.7%
84%
Humidity - Minimum monthly morning or afternoon humidity
51%
51%
Precipitation - Yearly average
19.1 in
30.4 in
Snowfall - Yearly average
0 in
98.6 in
Clouds - Number of days clear of clouds
28.3%
15.8%
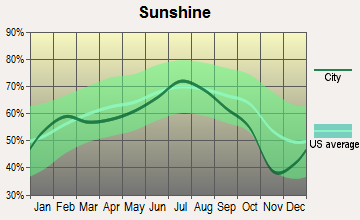
Sunshine amount - Average
78.4%
61.8%
Sunshine amount - Differences during a year
22%
37%
Sunshine amount - Maximum monthly
85%
74%
Sunshine amount - Minimum monthly
63%
37%
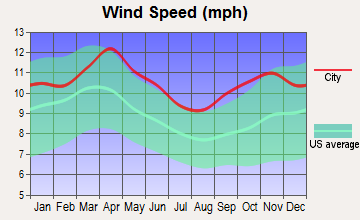
Wind speed - Average
3.7 mph
10.5 mph
Average climate in East San Gabriel Valley, California
Average climate in Minneapolis, Minnesota
Air pollution
Type
AQI
CO
NO2
OZONE
PB
PM10
PM25
SO2
Year
East San Gabriel Valley
Minneapolis
East San Gabriel Valley
Minneapolis
East San Gabriel Valley
Minneapolis
East San Gabriel Valley
Minneapolis
East San Gabriel Valley
Minneapolis
East San Gabriel Valley
Minneapolis
East San Gabriel Valley
Minneapolis
East San Gabriel Valley
Minneapolis
2018
143
81
0.36
0.24
14.1
14.1
29.2
28.2
0.007
N/A
29.6
20.4
13.4
8.5
0.3
1.3
2017
150
71
0.35
0.26
14.8
13.4
30.5
27.9
0.007
N/A
32.7
17.5
12.6
7.8
0.3
1.4
2016
141
76
0.31
0.28
15.5
12.6
29.3
26.7
0.007
N/A
30.3
16.7
12.0
7.3
0.3
1.5
2015
145
80
0.30
0.28
15.2
13.8
30.4
27.8
0.007
N/A
30.0
19.4
14.6
8.8
0.2
1.1
2014
142
83
0.32
0.25
16.8
15.9
29.7
26.8
0.008
N/A
33.6
21.2
11.7
7.0
0.3
1.0
2013
147
81
0.33
N/A
17.0
12.8
27.7
32.1
0.007
N/A
31.5
20.9
11.5
6.7
0.4
0.9
2012
149
80
0.39
N/A
18.3
7.7
27.5
29.0
0.005
N/A
30.9
23.8
15.6
8.4
0.6
0.2
2011
149
90
0.40
0.22
18.6
7.8
26.7
29.7
0.008
N/A
30.3
23.4
17.3
9.8
0.5
0.1
2010
139
101
0.44
N/A
19.3
9.6
26.8
27.8
N/A
0.003
26.6
24.7
14.8
9.6
0.4
0.5
2009
156
103
0.40
N/A
21.0
7.4
28.0
N/A
0.010
0.004
26.0
21.4
16.5
9.4
0.6
1.1
2008
156
92
0.48
N/A
22.7
8.8
27.7
N/A
0.012
0.003
27.0
18.3
15.1
10.1
1.0
1.0
2007
135
102
0.52
N/A
25.3
9.2
24.8
N/A
0.014
0.003
N/A
21.6
N/A
11.6
1.3
0.6
2006
128
88
0.55
N/A
25.1
9.5
24.0
N/A
0.009
0.006
N/A
20.5
N/A
10.5
1.9
1.8
2005
127
107
0.59
N/A
25.7
12.3
22.8
N/A
0.014
0.004
N/A
22.0
N/A
10.6
1.9
2.1
2004
132
103
0.68
N/A
25.4
11.0
24.6
N/A
0.016
0.005
N/A
23.9
N/A
10.5
1.7
3.3
2003
137
114
0.80
N/A
29.9
12.5
24.7
N/A
0.021
0.004
N/A
25.9
N/A
11.9
1.4
3.0
2002
134
95
0.83
0.42
31.4
15.7
23.1
N/A
0.021
0.007
N/A
N/A
N/A
10.9
2.0
1.8
2001
141
82
1.00
0.75
31.8
17.5
21.4
32.4
0.029
0.011
N/A
N/A
N/A
9.3
2.1
2.0
2000
150
68
1.05
0.75
34.7
16.6
20.7
31.2
0.027
0.009
N/A
N/A
N/A
N/A
2.0
2.8
Natural disasters
Type
East San Gabriel Valley
Minneapolis
Tornado activity compared to U.S. average
18.5%
129.9%
Earthquake activity compared to U.S. average
7,292.4%
44.5%
Natural disasters compared to U.S. average
57%
17%
Transportation
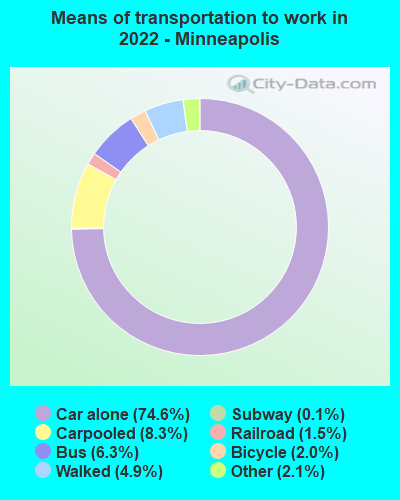
In terms of public transportation, Minneapolis has more established systems like the Metro Transit, which includes buses, light rail, and commuter rails, while East San Gabriel Valley relies more on car travel, although there are local bus services and Metrolink trains for commuting.
Transport
Type
East San Gabriel Valley
Minneapolis
Amtrak stations nearby
3
1
FAA registered aircraft
0
284
Means of transportation to work
Type
East San Gabriel Valley
Minneapolis
Bicycle
0.6%
1.9%
Bus
2.9%
6.6%
Carpooled
17.1%
9%
Car alone
73.3%
74.3%
Motorcycle
0.2%
0.1%
Railroad
0.6%
0.6%
Subway
0.1%
0.2%
Taxicab
0%
0.2%
Walked
2.2%
5.2%
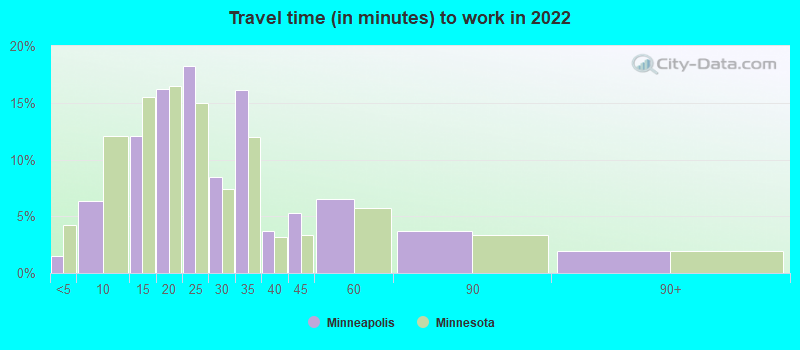
Average travel time to work
Type
East San Gabriel Valley
Minneapolis
Average
32.3 min
27.4 min
Real Estate
Real estate in East San Gabriel Valley is more costly than Minneapolis. The median home price in the Valley exceeds the national average significantly, while in Minneapolis, it's more balanced, offering more affordability.
Neighborhoods
Both East San Gabriel Valley and Minneapolis provide diverse neighborhoods. The Valley ranges from cozy suburban spots to lively city districts, while the "City of Lakes" offers more urban neighborhoods, each with its unique cultural flavor and community spirit.
Houses and residents
Type
East San Gabriel Valley
Minneapolis
Houses
270,240
203,633
Average household size (people)
3.5
2.2
Houses occupied
263,338 (97.4%)
188,681 (92.7%)
Houses occupied by owners
180,683 (68.6%)
93,981 (49.8%)
Houses occupied by renters
82,655 (31.4%)
94,700 (50.2%)
Median rent asked for vacant for-rent units
$1,935
$1,777
Median price asked for vacant for-sale houses and condos
$1,138,428
$238,504
Estimated median house or condo value
$643,048
$319,100
Median number of rooms in apartments
3.7
3.3
Median number of rooms in houses and condos
5.9
6.4
Renting percentage
32.3%
50.8%
Housing density (houses/condos per square mile)
1,270.8
3,709.7
Household income disparities
40.3%
45.3%
Housing units without a mortgage
26,635 (16.4%)
1,756 (2.5%)
Housing units with both a second mortgage and home equity loan
515 (0.3%)
6,107 (8.7%)
Housing units with a mortgage
136,243 (83.6%)
68,555 (97.5%)
Housing units with a home equity loan
11,429 (7%)
203 (0.3%)
Housing units with a second mortgage
21,150 (13%)
7,699 (10.9%)
Housing units lacking complete kitchen facilities
1%
0.7%
Housing units lacking complete plumbing facilities
Self-employed workers in own not incorporated business
25,753
13,397
State government workers
13,845
12,526
Unpaid family workers
1,494
516
Industries and Occupations
Major industries in East San Gabriel Valley include entertainment and film, while Minneapolis hosts a number of Fortune 500 companies in sectors such as health care, finance, and retail. Consequently, occupations tend to align with these industries.
In terms of infrastructure, both locales offer proficiently maintained systems: broad high-speed internet access, modern healthcare facilities, and fully functioning public utilities. However, the dynamic skyscraper landscape of Minneapolis might have an edge over the San Gabriel Valley's more suburban layout for those fond of city living.
Infrastructure
Type
East San Gabriel Valley
Minneapolis
TV stations
24
17
Culture and Food
Culturally, both areas are vibrant and diverse. East San Gabriel Valley offers an eclectic mix of cultures reflected in its food scene, rich in Asian cuisine. Minneapolis showcases a mix of world cuisines, complemented by the charm of the Midwest.
Sports Teams
Sports enthusiasts have lots to enjoy in both regions. Minneapolis is home to multiple professional sports franchises, including the Vikings (NFL), Twins (MLB), and Timberwolves (NBA). The Valley, being part of the Greater LA area, boasts teams like the Dodgers (MLB), Lakers (NBA), and Rams (NFL).
 East San Gabriel Valley, CA
 Minneapolis, MN