When comparing the East San Gabriel Valley and Riverside, both located in the attractive state of California, some interesting contrasts are noticeable. From differing weather patterns to cost of living, to varying industries and opportunities for work available, the choice between these two areas is both subjective and dependent on individual preferences. This guide aims to provide a detailed comparison, including an in-depth look at crime rates, educational opportunities, local infrastructure, industry, real-estate, state taxes, and local culture among other things.
East San Gabriel Valley, considered safer than 65% of cities in California, offers a lower crime rate compared to Riverside. Riverside's crime rate is slightly higher than the national average, especially property crimes. However, both communities host proactive law enforcement agencies, providing a level of safety reassuring for both residents and tourists.
Cost of Living
Living in East San Gabriel Valley might be costlier compared to Riverside. Costs associated with housing, groceries, transportation, and healthcare are substantially higher in East San Gabriel Valley, making Riverside a potentially more affordable choice, particularly for families or retirees.
Income Tax
Both East San Gabriel Valley and Riverside as part of California have the same state-level progressive income tax, ranging from 1% to 13.3%.
Property Tax
In California, the mean effective property tax is around 0.73%. Both East San Gabriel Valley and Riverside are subject to this tax with slight variations based on the specific locales.
Sales Tax
The total sales tax rate in East San Gabriel Valley ranges from 9.5% to 10.25%, depending on the specific city. Riverside also has a relatively high sales tax at 8.75%.
Income
Type
East San Gabriel Valley
Riverside
Estimated median household income
$95,242
$76,558
Estimated per capita income
$34,474
$29,013
Cost of living index (U.S. average is 100)
150.2
83
If you make $50,000 in Riverside, you will have to make $90,482 in East San Gabriel Valley to maintain the same standard of living.
Geographical Conditions
East San Gabriel Valley enjoys a topography of stunning hillsides and valleys. Riverside, located in the Inland Empire region, is known for its scenic mountains, hills, and plains.
Geographical information
Type
East San Gabriel Valley
Riverside
Land area
212.6 sq. miles
78.1 sq. miles
Population density
4,478.5 people per sq. mile
4,062.3 people per sq. mile
Relative area comparison
East San Gabriel Valley, CA Riverside, CA
Education
Both areas boast commendable educational systems. East San Gabriel Valley is part of Los Angeles County and is home to several highly-rated public and private schools. Riverside, the birthplace of California's citrus industry, is home to the University of California - Riverside and several well-regarded public schools.
The economy in East San Gabriel Valley, integrated with the robust Los Angeles metropolitan area's economy, is diversified across multiple sectors. Riverside's economy centres on education, healthcare, and public administration. Both areas offer substantial job opportunities, but East San Gabriel Valley might offer a broader range due to its proximity to Los Angeles.
Biggest Employers
In East San Gabriel Valley, some of the largest employers include Kaiser Permanente, City of Hope, and Walmart. Riverside's largest employers include the County of Riverside, Riverside Unified School District, and University of California - Riverside.
In East San Gabriel Valley (Los Angeles County), 69.7% voted for Democrats and 27.8% for Republicans in 2012 Presidential Election. In Riverside (Riverside County), 49.6% voted for Democrats and 48.0% for Republicans.
Elections
Type
Democrats
Republicans
Other
Year
East San Gabriel Valley
Riverside
East San Gabriel Valley
Riverside
East San Gabriel Valley
Riverside
2020
71.0%
53.0%
26.9%
45.0%
2.1%
2.0%
2016
72.0%
49.7%
22.5%
44.4%
5.5%
5.9%
2012
69.7%
49.6%
27.8%
48.0%
2.4%
2.4%
2008
69.2%
50.4%
28.8%
48.1%
1.9%
1.5%
2004
63.3%
41.3%
35.7%
58.2%
1.0%
0.6%
2000
63.6%
45.0%
32.4%
51.6%
4.0%
3.4%
1996
59.3%
43.0%
31.0%
45.6%
9.7%
11.3%
Breakdown of population affiliated with a religious congregation
Type
Adherents
Congregations
Religion
East San Gabriel Valley
Riverside
East San Gabriel Valley
Riverside
CATHOLIC CHURCH
36.1%
27.5%
4.7%
4.5%
SOUTHERN BAPTIST CONVENTION
1.0%
1.2%
9.0%
11.2%
MUSLIM ESTIMATE
0.7%
0.5%
1.0%
0.7%
AMERICAN BAPTIST CHURCHES IN THE USA
0.5%
0.0%
3.1%
0.7%
SEVENTH DAY ADVENTIST CHURCH
0.5%
0.9%
2.4%
3.4%
EPISCOPAL CHURCH
0.4%
0.2%
1.4%
1.4%
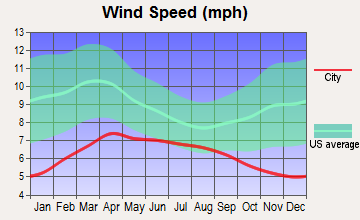
Weather
Both locations enjoy California's signature pleasant weather, although there are some differences. East San Gabriel Valley possesses a Mediterranean climate, witnessing hot, dry summers and mild, wet winters. Conversely, Riverside, more inland, experiences a more semi-arid climate with hotter summers and less rainfall.
Weather and climate
Type
East San Gabriel Valley
Riverside
Temperature - Average
62.7°F
66°F
Humidity - Average morning or afternoon humidity
64.7%
66.7%
Humidity - Differences between morning and afternoon humidity
19.6%
21.4%
Humidity - Maximum monthly morning or afternoon humidity
70.7%
73.5%
Humidity - Minimum monthly morning or afternoon humidity
51%
52.1%
Precipitation - Yearly average
19.1 in
10.3 in
Snowfall - Yearly average
0 in
0 in
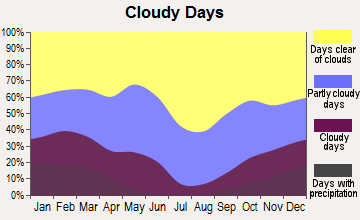
Clouds - Number of days clear of clouds
28.3%
27.3%
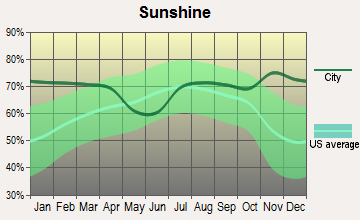
Sunshine amount - Average
78.4%
78.2%
Sunshine amount - Differences during a year
22%
21.5%
Sunshine amount - Maximum monthly
85%
84.2%
Sunshine amount - Minimum monthly
63%
62.6%
Wind speed - Average
3.7 mph
4.5 mph
Average climate in East San Gabriel Valley, California
Average climate in Riverside, California
Air pollution
Type
AQI
CO
NO2
OZONE
PB
PM10
PM25
SO2
Year
East San Gabriel Valley
Riverside
East San Gabriel Valley
Riverside
East San Gabriel Valley
Riverside
East San Gabriel Valley
Riverside
East San Gabriel Valley
Riverside
East San Gabriel Valley
Riverside
East San Gabriel Valley
Riverside
East San Gabriel Valley
Riverside
2018
143
153
0.36
0.35
14.1
14.4
29.2
29.8
0.007
0.006
29.6
44.6
13.4
13.6
0.3
0.4
2017
150
151
0.35
0.34
14.8
14.7
30.5
31.5
0.007
0.004
32.7
48.4
12.6
14.8
0.3
0.3
2016
141
140
0.31
0.33
15.5
14.8
29.3
30.9
0.007
0.006
30.3
44.4
12.0
14.5
0.3
0.2
2015
145
147
0.30
0.33
15.2
14.5
30.4
30.8
0.007
0.004
30.0
43.6
14.6
15.4
0.2
0.3
2014
142
147
0.32
0.37
16.8
15.9
29.7
30.7
0.008
0.006
33.6
34.1
11.7
16.5
0.3
0.3
2013
147
147
0.33
0.38
17.0
16.4
27.7
29.2
0.007
0.006
31.5
33.2
11.5
16.4
0.4
0.2
2012
149
148
0.39
0.35
18.3
16.4
27.5
30.2
0.005
0.007
30.9
32.3
15.6
16.0
0.6
0.3
2011
149
150
0.40
0.37
18.6
16.3
26.7
32.0
0.008
0.006
30.3
33.1
17.3
15.2
0.5
0.3
2010
139
144
0.44
0.42
19.3
17.8
26.8
30.9
N/A
0.008
26.6
31.9
14.8
15.5
0.4
1.3
2009
156
151
0.40
0.37
21.0
20.0
28.0
29.0
0.010
0.009
26.0
38.0
16.5
19.6
0.6
1.5
2008
156
157
0.48
0.41
22.7
20.5
27.7
30.0
0.012
0.010
27.0
43.6
15.1
16.3
1.0
0.9
2007
135
135
0.52
0.65
25.3
20.8
24.8
28.3
0.014
0.011
N/A
N/A
N/A
N/A
1.3
1.6
2006
128
129
0.55
0.58
25.1
21.0
24.0
28.0
0.009
0.005
N/A
N/A
N/A
N/A
1.9
1.4
2005
127
134
0.59
0.53
25.7
22.8
22.8
27.3
0.014
0.012
N/A
N/A
N/A
N/A
1.9
3.3
2004
132
142
0.68
0.72
25.4
18.5
24.6
29.5
0.016
0.013
N/A
N/A
N/A
N/A
1.7
3.1
2003
137
144
0.80
0.75
29.9
22.7
24.7
28.5
0.021
0.013
N/A
N/A
N/A
N/A
1.4
2.0
2002
134
142
0.83
0.82
31.4
24.9
23.1
28.5
0.021
0.015
N/A
N/A
N/A
N/A
2.0
0.2
2001
141
145
1.00
0.79
31.8
25.7
21.4
26.1
0.029
0.025
N/A
N/A
N/A
N/A
2.1
0.9
2000
150
157
1.05
0.82
34.7
24.2
20.7
25.0
0.027
0.031
N/A
N/A
N/A
N/A
2.0
1.2
Natural disasters
Type
East San Gabriel Valley
Riverside
Tornado activity compared to U.S. average
18.5%
17.4%
Earthquake activity compared to U.S. average
7,292.4%
7,322.6%
Natural disasters compared to U.S. average
57%
46%
Transportation
Public transportation in East San Gabriel Valley is robust with services by Foothill Transit, Metrolink, and LA Metro offering significant coverage. Riverside offers the Riverside Transit Agency bus service and Metrolink train service for commuting within and outside the city.
Transport
Type
East San Gabriel Valley
Riverside
Amtrak stations
0
1
Amtrak stations nearby
3
3
FAA registered aircraft
0
307
FAA registered aircraft manufacturers and dealers
0
15
Means of transportation to work
Type
East San Gabriel Valley
Riverside
Bicycle
0.6%
0.5%
Bus
2.9%
0.9%
Carpooled
17.1%
9%
Car alone
73.3%
85.7%
Motorcycle
0.2%
0.3%
Railroad
0.6%
0.4%
Walked
2.2%
2.3%
Average travel time to work
Type
East San Gabriel Valley
Riverside
Average
32.3 min
31.3 min
Real Estate
Real estate in East San Gabriel Valley tends to be pricier compared to Riverside due to its proximity to the thriving Los Angeles metro area. Riverside offers more affordable housing but with lower growth rates in property values.
Neighborhoods
East San Gabriel Valley comprises several charismatic neighborhoods like West Covina, Walnut, and Diamond Bar. Riverside, known for its historic and scenic neighborhoods, includes the Wood Streets, the Greenbelt, and Downtown Riverside.
Houses and residents
Type
East San Gabriel Valley
Riverside
Houses
270,240
94,246
Average household size (people)
3.5
3.2
Houses occupied
263,338 (97.4%)
91,110 (96.7%)
Houses occupied by owners
180,683 (68.6%)
51,211 (56.2%)
Houses occupied by renters
82,655 (31.4%)
39,899 (43.8%)
Median rent asked for vacant for-rent units
$1,935
$1,277
Median price asked for vacant for-sale houses and condos
$1,138,428
$414,585
Estimated median house or condo value
$643,048
$483,300
Median number of rooms in apartments
3.7
3.9
Median number of rooms in houses and condos
5.9
6.1
Renting percentage
32.3%
44.3%
Housing density (houses/condos per square mile)
1,270.8
1,206.8
Household income disparities
40.3%
40.5%
Housing units without a mortgage
26,635 (16.4%)
393 (1%)
Housing units with both a second mortgage and home equity loan
515 (0.3%)
1,312 (3.3%)
Housing units with a mortgage
136,243 (83.6%)
39,744 (99%)
Housing units with a home equity loan
11,429 (7%)
123 (0.3%)
Housing units with a second mortgage
21,150 (13%)
2,112 (5.3%)
Housing units lacking complete kitchen facilities
1%
2.5%
Housing units lacking complete plumbing facilities
Self-employed workers in own not incorporated business
25,753
8,164
State government workers
13,845
8,293
Unpaid family workers
1,494
199
Industries and Occupations
Both areas provide a breadth of occupation opportunities. East San Gabriel Valley, part of the Greater Los Angeles Area, offers employment in entertainment, technology, healthcare, education, and retail sectors. Conversely, Riverside, home to several higher educational institutions, has a significant number of jobs in education, health services, and retail trade.
Healthcare facilities in East San Gabriel Valley, such as the award-winning City of Hope, provide top-notch services. Riverside is home to several reputed medical facilities like Riverside University Health System and Riverside Community Hospital.
Health (county statistics)
Type
East San Gabriel Valley
Riverside
General health status score of residents in this county from 1 (poor) to 5 (excellent)
East San Gabriel Valley benefits from its proximity to Los Angeles, with well-established infrastructure, including healthcare facilities, freeways, and public facilities. Riverside, slightly more isolated, offers a robust infrastructure nonetheless, marked by historic buildings, parks, and a city-owned public utilities system.
Infrastructure
Type
East San Gabriel Valley
Riverside
TV stations
24
5
Culture and Food
East San Gabriel Valley offers diverse cultural experiences with influences from Latin, Asian, and Western cultures. Riverside's food scene is growing and varied with options ranging from traditional Mexican cuisine to contemporary farm-to-table concepts.
Sports Teams
Being part of the Greater Los Angeles Area, residents in East San Gabriel Valley are fans of the L.A. Lakers, Dodgers, and Rams. Riverside doesn't have professional sports teams but has several minor league and college teams.
 East San Gabriel Valley, CA
 Riverside, CA