East San Gabriel Valley and San Bernardino are two distinct areas in the state of California with unique attributes that appeal to both residents and visitors. Despite both being within the Sun Belt, they are distinctive in terms of crime rates, cost of living, economic opportunities, education systems, and cultural experiences.
San Bernardino has a higher crime rate overall, when compared to East San Gabriel Valley. Although steps have been taken to reduce crime levels in San Bernardino, the city still struggles with issues related to gang activity and violence. Conversely, East San Gabriel Valley is considered relatively safer, making it a favorable choice for families seeking a secure living environment.
Cost of Living
San Bernardino is typically less expensive to live in than East San Gabriel Valley. It offers more affordable housing options, grocery costs, and utilities. In contrast, the cost of living in the East San Gabriel Valley is higher, reflecting its proximity to Los Angeles' amenities and higher-income neighborhoods.
Income Tax
California has a relatively high income tax rate, with maximum rates around 13.3% that apply to both East San Gabriel Valley and San Bernardino residents depending on their income levels.
Property Tax
Property taxes in California are relatively moderate, around 1% of the home's value, and this applies to both San Bernardino and East San Gabriel Valley. However, due to higher property values in East San Gabriel Valley, homeowners here may pay more in absolute terms.
Sales Tax
Both East San Gabriel Valley and San Bernardino have a sales tax of approximately 7.25%, aligning with the California state average. However, local variations may apply depending upon the specific city within the East San Gabriel Valley.
Income
Type
East San Gabriel Valley
San Bernardino
Estimated median household income
$95,242
$65,311
Estimated per capita income
$34,474
$22,624
Cost of living index (U.S. average is 100)
150.2
82.2
If you make $50,000 in San Bernardino, you will have to make $91,363 in East San Gabriel Valley to maintain the same standard of living.
Geographical Conditions
East San Gabriel Valley offers a more urban-suburban mix and is known for its picturesque views of mountains and the Pacific coast. San Bernardino, better known for its desert landscape, is situated in the Inland Empire and also boasts stunning mountain views.
Geographical information
Type
East San Gabriel Valley
San Bernardino
Land area
212.6 sq. miles
58.8 sq. miles
Population density
4,478.5 people per sq. mile
3,778.1 people per sq. mile
Relative area comparison
East San Gabriel Valley, CA San Bernardino, CA
Education
When it comes to education, East San Gabriel Valley edges out with an array of reputable schools, and access to a network of Los Angeles county community colleges and universities. Although San Bernardino also has decent schools and its own public university, their quality and ranking are generally lower than those in East San Gabriel Valley.
San Bernardino's economy is driven primarily by the service sector, education, and healthcare, with a growing interest in manufacturing and logistics due to its strategic location. The more affluent East San Gabriel Valley's economy leans towards healthcare, professional services, and retail, with higher average incomes and employment opportunities.
Biggest Employers
The largest employers in San Bernardino include San Bernardino City Unified School District, St. Bernardine Medical Center, and California State University, San Bernardino. In East San Gabriel Valley, significant employers include companies like Walmart, Kaiser Permanente, and the local school districts.
In East San Gabriel Valley (Los Angeles County), 69.7% voted for Democrats and 27.8% for Republicans in 2012 Presidential Election. In San Bernardino (San Bernardino County), 52.3% voted for Democrats and 45.0% for Republicans.
Elections
Type
Democrats
Republicans
Other
Year
East San Gabriel Valley
San Bernardino
East San Gabriel Valley
San Bernardino
East San Gabriel Valley
San Bernardino
2020
71.0%
54.2%
26.9%
43.6%
2.1%
2.2%
2016
72.0%
52.1%
22.5%
41.5%
5.5%
6.4%
2012
69.7%
52.3%
27.8%
45.0%
2.4%
2.6%
2008
69.2%
52.2%
28.8%
45.8%
1.9%
2.0%
2004
63.3%
43.8%
35.7%
55.6%
1.0%
0.6%
2000
63.6%
47.3%
32.4%
48.8%
4.0%
3.9%
1996
59.3%
44.4%
31.0%
43.6%
9.7%
12.1%
Breakdown of population affiliated with a religious congregation
Type
Adherents
Congregations
Religion
East San Gabriel Valley
San Bernardino
East San Gabriel Valley
San Bernardino
CATHOLIC CHURCH
36.1%
21.9%
4.7%
4.3%
SOUTHERN BAPTIST CONVENTION
1.0%
2.2%
9.0%
9.6%
MUSLIM ESTIMATE
0.7%
0.6%
1.0%
1.1%
AMERICAN BAPTIST CHURCHES IN THE USA
0.5%
0.3%
3.1%
1.6%
SEVENTH DAY ADVENTIST CHURCH
0.5%
1.6%
2.4%
4.6%
EPISCOPAL CHURCH
0.4%
0.1%
1.4%
1.3%
Weather
Both cities boast the sunny, warm climate typical of Southern California. San Bernardino, located in the Inland Empire, experiences hot summers, tempered by its somewhat dry, desert-like atmosphere. The East San Gabriel Valley, situated closer to the coast, experiences slightly more moderate temperatures, with cool, wet winters.
Weather and climate
Type
East San Gabriel Valley
San Bernardino
Temperature - Average
62.7°F
64.8°F
Humidity - Average morning or afternoon humidity
64.7%
65.9%
Humidity - Differences between morning and afternoon humidity
19.6%
20.5%
Humidity - Maximum monthly morning or afternoon humidity
70.7%
72.2%
Humidity - Minimum monthly morning or afternoon humidity
51%
51.7%
Precipitation - Yearly average
19.1 in
17.9 in
Snowfall - Yearly average
0 in
0 in
Clouds - Number of days clear of clouds
28.3%
27.5%
Sunshine amount - Average
78.4%
78.3%
Sunshine amount - Differences during a year
22%
21.4%
Sunshine amount - Maximum monthly
85%
84.2%
Sunshine amount - Minimum monthly
63%
62.7%
Wind speed - Average
3.7 mph
4.1 mph
Average climate in East San Gabriel Valley, California
Average climate in San Bernardino, California
Air pollution
Type
AQI
CO
NO2
OZONE
PB
PM10
PM25
SO2
Year
East San Gabriel Valley
San Bernardino
East San Gabriel Valley
San Bernardino
East San Gabriel Valley
San Bernardino
East San Gabriel Valley
San Bernardino
East San Gabriel Valley
San Bernardino
East San Gabriel Valley
San Bernardino
East San Gabriel Valley
San Bernardino
East San Gabriel Valley
San Bernardino
2018
143
153
0.36
0.33
14.1
15.5
29.2
32.1
0.007
0.006
29.6
29.9
13.4
11.7
0.3
0.4
2017
150
148
0.35
0.40
14.8
15.7
30.5
33.9
0.007
0.004
32.7
32.0
12.6
13.3
0.3
0.3
2016
141
140
0.31
0.52
15.5
15.9
29.3
32.0
0.007
0.006
30.3
33.9
12.0
11.8
0.3
0.3
2015
145
147
0.30
0.49
15.2
15.8
30.4
32.3
0.007
0.004
30.0
31.5
14.6
12.7
0.2
0.3
2014
142
147
0.32
0.47
16.8
16.4
29.7
30.8
0.008
0.006
33.6
35.0
11.7
14.3
0.3
0.3
2013
147
147
0.33
0.42
17.0
17.0
27.7
28.8
0.007
0.006
31.5
32.2
11.5
13.2
0.4
0.3
2012
149
148
0.39
0.44
18.3
18.0
27.5
28.8
0.005
0.007
30.9
31.8
15.6
14.2
0.6
0.4
2011
149
150
0.40
0.35
18.6
18.0
26.7
27.9
0.008
0.006
30.3
30.6
17.3
17.7
0.5
0.4
2010
139
144
0.44
0.36
19.3
18.8
26.8
28.1
N/A
0.008
26.6
28.8
14.8
15.5
0.4
1.1
2009
156
151
0.40
0.35
21.0
20.0
28.0
28.1
0.010
0.011
26.0
31.9
16.5
17.5
0.6
1.2
2008
156
152
0.48
0.39
22.7
20.1
27.7
27.7
0.012
0.012
27.0
36.9
15.1
22.0
1.0
1.2
2007
135
132
0.52
0.49
25.3
22.5
24.8
25.9
0.014
0.016
N/A
N/A
N/A
N/A
1.3
1.7
2006
128
128
0.55
0.53
25.1
24.5
24.0
25.4
0.009
0.010
N/A
N/A
N/A
N/A
1.9
1.6
2005
127
132
0.59
0.58
25.7
26.8
22.8
24.4
0.014
0.011
N/A
N/A
N/A
N/A
1.9
2.7
2004
132
140
0.68
0.64
25.4
22.9
24.6
25.0
0.016
0.013
N/A
N/A
N/A
N/A
1.7
2.2
2003
137
143
0.80
0.97
29.9
26.9
24.7
24.3
0.021
0.032
N/A
N/A
N/A
N/A
1.4
1.5
2002
134
140
0.83
0.92
31.4
29.4
23.1
24.0
0.021
0.018
N/A
N/A
N/A
N/A
2.0
0.6
2001
141
144
1.00
0.81
31.8
30.9
21.4
26.4
0.029
0.039
N/A
N/A
N/A
N/A
2.1
1.1
2000
150
155
1.05
0.86
34.7
30.1
20.7
21.9
0.027
0.040
N/A
N/A
N/A
N/A
2.0
1.6
Natural disasters
Type
East San Gabriel Valley
San Bernardino
Tornado activity compared to U.S. average
18.5%
15.9%
Earthquake activity compared to U.S. average
7,292.4%
7,481.9%
Natural disasters compared to U.S. average
57%
46%
Transportation
San Bernardino has decent public transportation, with multiple bus lines and train routes. However, public transit is more extensive and reliable in East San Gabriel Valley, with easy access to Los Angeles via the Metrolink. The traffic congestion is a common issue in both areas due to proximity to major thoroughfares.
Transport
Type
East San Gabriel Valley
San Bernardino
Amtrak stations
0
1
Amtrak stations nearby
3
3
FAA registered aircraft
0
80
FAA registered aircraft manufacturers and dealers
0
3
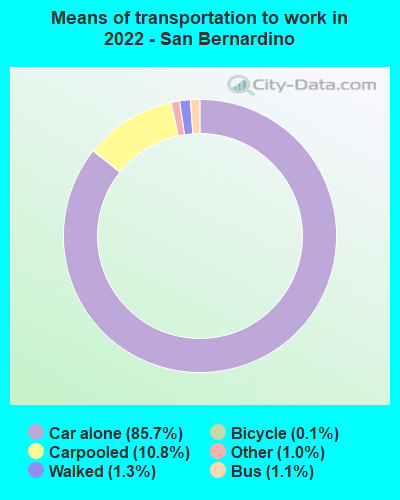
Means of transportation to work
Type
East San Gabriel Valley
San Bernardino
Bicycle
0.6%
0.4%
Bus
2.9%
0.7%
Carpooled
17.1%
13.2%
Car alone
73.3%
82.9%
Motorcycle
0.2%
0.2%
Railroad
0.6%
0.2%
Walked
2.2%
1.4%
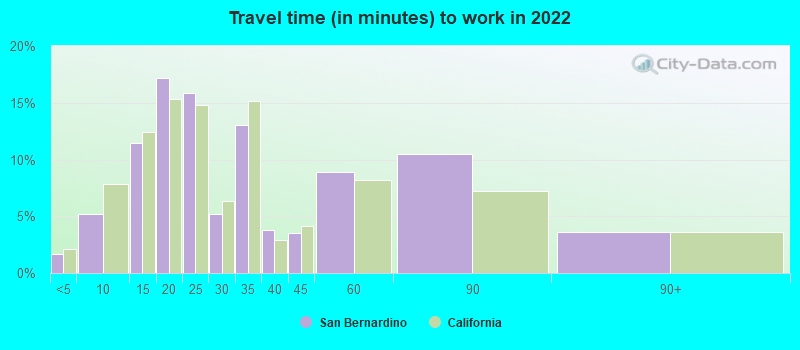
Average travel time to work
Type
East San Gabriel Valley
San Bernardino
Average
32.3 min
30.8 min
Real Estate
Housing prices in East San Gabriel Valley are notably higher than in San Bernardino, reflecting the demand due to its safer neighborhoods and higher quality of life. San Bernardino offers more affordable housing options and has a higher rental market due to its lower median income levels.
Neighborhoods
East San Gabriel Valley is known for its upscale neighborhoods like Pasadena and Arcadia. San Bernardino's neighborhoods, while offering a range of options, are generally more affordable and have a more diverse socioeconomic mix.
Houses and residents
Type
East San Gabriel Valley
San Bernardino
Houses
270,240
66,188
Average household size (people)
3.5
3.4
Houses occupied
263,338 (97.4%)
63,331 (95.7%)
Houses occupied by owners
180,683 (68.6%)
32,391 (51.1%)
Houses occupied by renters
82,655 (31.4%)
30,940 (48.9%)
Median rent asked for vacant for-rent units
$1,935
$1,123
Median price asked for vacant for-sale houses and condos
$1,138,428
$195,043
Estimated median house or condo value
$643,048
$350,000
Median number of rooms in apartments
3.7
4.1
Median number of rooms in houses and condos
5.9
5.8
Renting percentage
32.3%
49.7%
Housing density (houses/condos per square mile)
1,270.8
1,125.4
Household income disparities
40.3%
41.1%
Housing units without a mortgage
26,635 (16.4%)
127 (0.6%)
Housing units with both a second mortgage and home equity loan
515 (0.3%)
762 (3.4%)
Housing units with a mortgage
136,243 (83.6%)
22,340 (99.4%)
Housing units with a home equity loan
11,429 (7%)
0 (0%)
Housing units with a second mortgage
21,150 (13%)
1,041 (4.6%)
Housing units lacking complete kitchen facilities
1%
2.8%
Housing units lacking complete plumbing facilities
Self-employed workers in own not incorporated business
25,753
5,389
State government workers
13,845
4,741
Unpaid family workers
1,494
290
Industries and Occupations
In San Bernardino, the largest industries are retail trade, healthcare, and social assistance. Meanwhile, in East San Gabriel Valley, the dominant industries are similar but incorporate educational services. East San Gabriel Valley has a greater concentration of professionals such as managers, while San Bernardino has more trade workers.
Healthcare services are comparably good in both regions, with several hospitals and clinics. However, East San Gabriel Valley edges out with more highly rated medical facilities, in part due to its proximity to Los Angeles and the presence of larger health systems.
Health (county statistics)
Type
East San Gabriel Valley
San Bernardino
General health status score of residents in this county from 1 (poor) to 5 (excellent)
The infrastructure in both cities varies significantly. East San Gabriel Valley, being closer to Los Angeles, benefits from better maintained roads, public buildings, and utilities. San Bernardino has made progress with recent redevelopment projects, but still trails in terms of quality and accessibility of infrastructure.
Infrastructure
Type
East San Gabriel Valley
San Bernardino
TV stations
24
6
Culture and Food
East San Gabriel Valley showcases diversity in its culture and food scene, offering a blend of Latin, Asian and American cuisines. San Bernardino also offers cultural diversity, with an emphasis on Hispanic influences reflected in its food offerings.
Sports Teams
Neither San Bernardino nor East San Gabriel Valley have major sports teams. However, both regions are within driving distance to Los Angeles which hosts several professional sports teams.
 East San Gabriel Valley, CA
 San Bernardino, CA