The comparison between living in East San Gabriel Valley, California, and South Aurora, Colorado, extends over several facets. These aspects, including crime and safety, weather conditions, cost of living, education standard, economic conditions, infrastructure, primary industries and employers, real estate market, neighborhood dynamics, transportation systems, tax rates, cultural experiences, sports teams, geographical features, and health care services, offer dramatic contrasts in these two regions. This analysis assesses each of these points upfront, providing insightful information to facilitate a relocation decision or plan a visit.
Both East San Gabriel Valley and South Aurora take measures to ensure safety, but perceived security varies. East San Gabriel Valley tends to have a higher crime rate than the national average, with property crime dominating. Contrastingly, South Aurora generally offers a safer environment with crime rates below Colorado's average. Considerable effort from local law enforcement helps maintain order and security.
Cost of Living
The cost of living in East San Gabriel Valley is typically higher than South Aurora, primarily due to higher housing costs. California's general living cost is notoriously high, with grocery, healthcare, transportation costs, among other expenses, often exceeding the national average. Compared to this, South Aurora offers comparatively affordable living expenses.
Income Tax
Income tax in California is progressive and can be high for higher earners, with rates reaching 13.3%. Colorado applies a flat income tax of 4.63%, making it generally less burdening for higher-income individuals.
Property Tax
Property taxes in East San Gabriel Valley, like the rest of California, are typically high, reflecting the region's high property values. South Aurora generally imposes lower property tax rates, closer to Colorado's state average.
Sales Tax
East San Gabriel Valley residents, like all Californians, face a rather high state sales tax rate at 7.25% before local add-ons. In contrast, Colorado's state sales tax rate is less, but South Aurora's combined sales tax rate can exceed California’s due to local taxes.
Income
Type
East San Gabriel Valley
South Aurora
Estimated median household income
$95,242
$80,212
Estimated per capita income
$34,474
$39,129
Cost of living index (U.S. average is 100)
150.2
110.1
If you make $50,000 in South Aurora, you will have to make $68,211 in East San Gabriel Valley to maintain the same standard of living.
Geographical Conditions
Geographically, East San Gabriel Valley is mostly flat, while South Aurora is located on the High Plains, east of the Rocky Mountain foothills. Therefore, South Aurora provides ample outdoor activities like hiking, biking, and skiing.
Geographical information
Type
East San Gabriel Valley
South Aurora
Land area
212.6 sq. miles
78.4 sq. miles
Population density
4,478.5 people per sq. mile
4,199.1 people per sq. mile
Relative area comparison
East San Gabriel Valley, CA South Aurora, CO
Education
Both regions cater well to education. East San Gabriel Valley, home to several quality public and private schools, also houses reputed higher education institutions such as California State Polytechnic University. South Aurora boasts good schooling options, too. It's part of the Cherry Creek School District, highly regarded for its performance and innovative education approaches.
The economies of both East San Gabriel Valley and South Aurora are diverse. East San Gabriel Valley has sectors like healthcare, education, retail trade, and manufacturing, contributing significantly to its economy. South Aurora's economy relies heavily on sectors like healthcare, retail trade, education, professional, scientific, and technical services.
Biggest Employers
In East San Gabriel Valley, significant employers are Citrus Valley Health Partners, California State Polytechnic University, and local school districts. In South Aurora, the HealthONE system, including the Medical Center of Aurora, and Cherry Creek School District are the major employers.
In East San Gabriel Valley (Los Angeles County), 69.7% voted for Democrats and 27.8% for Republicans in 2012 Presidential Election. In South Aurora (Arapahoe County), 54.4% voted for Democrats and 44.4% for Republicans.
Elections
Type
Democrats
Republicans
Other
Year
East San Gabriel Valley
South Aurora
East San Gabriel Valley
South Aurora
East San Gabriel Valley
South Aurora
2020
71.0%
61.3%
26.9%
36.6%
2.1%
2.1%
2016
72.0%
53.1%
22.5%
38.9%
5.5%
8.1%
2012
69.7%
54.4%
27.8%
44.4%
2.4%
1.3%
2008
69.2%
56.0%
28.8%
43.0%
1.9%
1.0%
2004
63.3%
47.6%
35.7%
51.6%
1.0%
0.8%
2000
63.6%
43.6%
32.4%
51.6%
4.0%
4.8%
1996
59.3%
41.9%
31.0%
50.8%
9.7%
7.3%
Breakdown of population affiliated with a religious congregation
Type
Adherents
Congregations
Religion
East San Gabriel Valley
South Aurora
East San Gabriel Valley
South Aurora
CATHOLIC CHURCH
36.1%
12.1%
4.7%
4.3%
SOUTHERN BAPTIST CONVENTION
1.0%
1.6%
9.0%
9.9%
MUSLIM ESTIMATE
0.7%
1.9%
1.0%
1.0%
AMERICAN BAPTIST CHURCHES IN THE USA
0.5%
0.1%
3.1%
1.7%
SEVENTH DAY ADVENTIST CHURCH
0.5%
0.2%
2.4%
2.6%
EPISCOPAL CHURCH
0.4%
0.4%
1.4%
1.7%
EVANGELICAL LUTHERAN CHURCH IN AMERICA
0.2%
2.0%
1.9%
4.3%
LUTHERAN CHURCH
0.2%
1.0%
1.6%
2.6%
VINEYARD USA
0.1%
0.5%
0.3%
0.3%
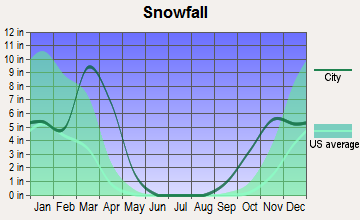
Weather
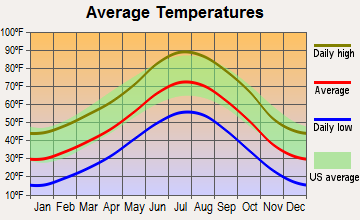
Weather-wise, East San Gabriel Valley enjoys Mediterranean-like climate, with warm, dry summers and mild, wet winters. On the other hand, South Aurora experiences a semi-arid climate, featuring four distinct seasons with summers often reaching high temperatures and winters that may be snowy and cold. It's essential for both residents and tourists to consider these weather variations when relocating or planning visits.
Weather and climate
Type
East San Gabriel Valley
South Aurora
Temperature - Average
62.7°F
49.9°F
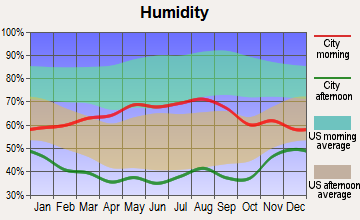
Humidity - Average morning or afternoon humidity
64.7%
50.6%
Humidity - Differences between morning and afternoon humidity
19.6%
20%
Humidity - Maximum monthly morning or afternoon humidity
70.7%
55%
Humidity - Minimum monthly morning or afternoon humidity
51%
35%
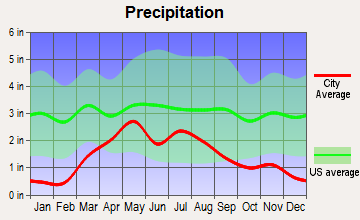
Precipitation - Yearly average
19.1 in
17.6 in
Snowfall - Yearly average
0 in
114 in
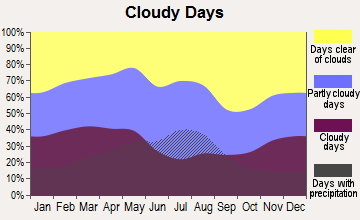
Clouds - Number of days clear of clouds
28.3%
19.2%
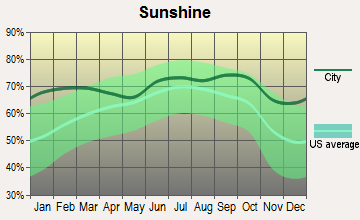
Sunshine amount - Average
78.4%
75.6%
Sunshine amount - Differences during a year
22%
10%
Sunshine amount - Maximum monthly
85%
74%
Sunshine amount - Minimum monthly
63%
64%
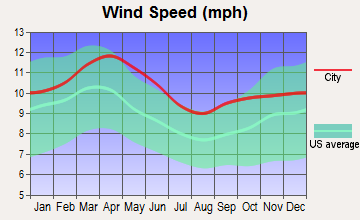
Wind speed - Average
3.7 mph
8.6 mph
Average climate in East San Gabriel Valley, California
Average climate in South Aurora, Colorado
Air pollution
Type
AQI
CO
NO2
OZONE
PB
PM10
PM25
SO2
Year
East San Gabriel Valley
South Aurora
East San Gabriel Valley
South Aurora
East San Gabriel Valley
South Aurora
East San Gabriel Valley
South Aurora
East San Gabriel Valley
South Aurora
East San Gabriel Valley
South Aurora
East San Gabriel Valley
South Aurora
East San Gabriel Valley
South Aurora
2018
143
99
0.36
0.37
14.1
21.6
29.2
31.9
0.007
N/A
29.6
29.2
13.4
8.5
0.3
0.7
2017
150
95
0.35
0.37
14.8
22.0
30.5
31.8
0.007
N/A
32.7
22.0
12.6
8.4
0.3
0.9
2016
141
90
0.31
0.43
15.5
24.0
29.3
31.3
0.007
N/A
30.3
22.6
12.0
8.1
0.3
1.0
2015
145
101
0.30
0.44
15.2
23.0
30.4
30.2
0.007
N/A
30.0
20.6
14.6
9.6
0.2
1.1
2014
142
94
0.32
0.43
16.8
22.0
29.7
30.3
0.008
N/A
33.6
22.7
11.7
10.1
0.3
1.3
2013
147
84
0.33
0.39
17.0
19.7
27.7
30.7
0.007
N/A
31.5
22.0
11.5
N/A
0.4
1.4
2012
149
90
0.39
0.34
18.3
18.9
27.5
31.4
0.005
N/A
30.9
24.3
15.6
N/A
0.6
1.2
2011
149
91
0.40
0.34
18.6
18.1
26.7
31.5
0.008
N/A
30.3
23.8
17.3
N/A
0.5
1.5
2010
139
81
0.44
0.41
19.3
16.3
26.8
29.3
N/A
N/A
26.6
26.6
14.8
N/A
0.4
1.0
2009
156
79
0.40
0.37
21.0
14.1
28.0
27.3
0.010
0.005
26.0
22.6
16.5
N/A
0.6
1.3
2008
156
85
0.48
0.41
22.7
17.3
27.7
29.1
0.012
0.008
27.0
25.5
15.1
N/A
1.0
1.6
2007
135
96
0.52
0.41
25.3
20.6
24.8
25.7
0.014
0.007
N/A
28.9
N/A
N/A
1.3
1.2
2006
128
89
0.55
0.50
25.1
19.0
24.0
25.4
0.009
0.026
N/A
28.0
N/A
N/A
1.9
1.4
2005
127
86
0.59
0.57
25.7
21.3
22.8
22.7
0.014
0.106
N/A
29.6
N/A
N/A
1.9
1.5
2004
132
82
0.68
0.61
25.4
21.2
24.6
21.6
0.016
0.035
N/A
28.6
N/A
N/A
1.7
1.8
2003
137
106
0.80
0.61
29.9
21.2
24.7
23.4
0.021
0.038
N/A
32.6
N/A
N/A
1.4
1.9
2002
134
86
0.83
0.64
31.4
19.2
23.1
23.0
0.021
0.027
N/A
35.7
N/A
N/A
2.0
2.5
2001
141
95
1.00
0.79
31.8
23.8
21.4
20.8
0.029
0.029
N/A
32.6
N/A
N/A
2.1
2.6
2000
150
93
1.05
0.77
34.7
13.7
20.7
21.7
0.027
0.032
N/A
12.2
N/A
N/A
2.0
2.1
Natural disasters
Type
East San Gabriel Valley
South Aurora
Tornado activity compared to U.S. average
18.5%
137.7%
Earthquake activity compared to U.S. average
7,292.4%
797.1%
Natural disasters compared to U.S. average
57%
10%
Transportation
East San Gabriel Valley offers robust public transportation with buses, light rail, and train services. South Aurora, while having some public transit, largely relies on road networks for commuting, necessitating personal vehicles for most residents. However, improvements are underway to extend the Regional Transportation District’s light rail system further into Aurora.
Transport
Type
East San Gabriel Valley
South Aurora
Amtrak stations nearby
3
2
Means of transportation to work
Type
East San Gabriel Valley
South Aurora
Bicycle
0.6%
0.2%
Bus
2.9%
3.5%
Carpooled
17.1%
12%
Car alone
73.3%
78.6%
Motorcycle
0.2%
0.1%
Railroad
0.6%
0%
Walked
2.2%
1.3%
Average travel time to work
Type
East San Gabriel Valley
South Aurora
Average
32.3 min
27.5 min
Real Estate
Real estate prices in East San Gabriel Valley tend to be higher than in South Aurora, reflecting California's generally high property values. South Aurora offers a wide range of more affordable housing options, making it an appealing choice for families and those seeking lower living costs.
Neighborhoods
Both regions boast diverse and vibrant neighborhoods. The neighborhoods of East San Gabriel Valley are dotted with historic houses and offer a rather urban vibe. South Aurora showcases a blend of urban and suburban lifestyle with well-planned residential areas, shopping centers, parks, and recreational facilities.
Houses and residents
Type
East San Gabriel Valley
South Aurora
Houses
270,240
119,373
Average household size (people)
3.5
2.6
Houses occupied
263,338 (97.4%)
115,977 (97.2%)
Houses occupied by owners
180,683 (68.6%)
76,163 (65.7%)
Houses occupied by renters
82,655 (31.4%)
39,814 (34.3%)
Median rent asked for vacant for-rent units
$1,935
$1,519
Median price asked for vacant for-sale houses and condos
$1,138,428
$836,561
Estimated median house or condo value
$643,048
$439,151
Median number of rooms in apartments
3.7
3.9
Median number of rooms in houses and condos
5.9
7.2
Renting percentage
32.3%
38.4%
Housing density (houses/condos per square mile)
1,270.8
1,522.9
Household income disparities
40.3%
40.8%
Housing units without a mortgage
26,635 (16.4%)
6,903 (10.6%)
Housing units with both a second mortgage and home equity loan
515 (0.3%)
358 (0.6%)
Housing units with a mortgage
136,243 (83.6%)
57,942 (89.4%)
Housing units with a home equity loan
11,429 (7%)
5,373 (8.3%)
Housing units with a second mortgage
21,150 (13%)
10,116 (15.6%)
Housing units lacking complete kitchen facilities
1%
0.4%
Housing units lacking complete plumbing facilities
0.8%
0.4%
Housing units in structures
Housing units in structures
East San Gabriel Valley
South Aurora
One, detached
68.5%
52.4%
One, attached
8.2%
11.6%
Two
1.0%
0.6%
3 or 4
3.9%
3.5%
5 to 9
3.0%
6.9%
10 to 19
2.4%
10.6%
20 to 49
2.8%
5.9%
50 or more
6.5%
7.7%
Mobile homes
3.6%
0.7%
Boats, RVs, vans, etc.
0.1%
0.0%
Median real estate property taxes paid for housing units
Self-employed workers in own not incorporated business
25,753
8,665
State government workers
13,845
4,200
Unpaid family workers
1,494
351
Industries and Occupations
The primary industries in East San Gabriel Valley are healthcare, education, retail trade, and manufacturing. In South Aurora, the prominent industries include healthcare, retail trade, professional, scientific, and technical services. A wide range of occupations are present, so job-seekers may find varied opportunities.
Both regions offer quality healthcare. East San Gabriel Valley has several well-equipped hospitals. In contrast, South Aurora has the HealthONE system, among Colorado's largest healthcare networks.
Health (county statistics)
Type
East San Gabriel Valley
South Aurora
General health status score of residents in this county from 1 (poor) to 5 (excellent)
East San Gabriel Valley's infrastructure incorporates well-maintained roads, public utilities, and public spaces. South Aurora also features high-quality infrastructure, including state-of-the-art healthcare facilities, shopping centers, parks, and connectivity options.
Infrastructure
Type
East San Gabriel Valley
South Aurora
TV stations
24
14
Culture and Food
East San Gabriel Valley boasts rich cultural diversity, influencing its culinary scene, highlighted by Asian and Mexican cuisine. South Aurora's cultural and culinary offerings, while not as diverse as East San Gabriel Valley, are nevertheless delightful, featuring predominantly American, Mexican, and Italian dishes with an emphasis on farm-to-table experiences.
Sports Teams
Neither region hosts major professional sports teams, but they bear proximity to large cities that do – East San Gabriel Valley to Los Angeles, South Aurora to Denver. Consequently, residents and tourists can easily access major league games.
 East San Gabriel Valley, CA
 South Aurora, CO