East San Gabriel Valley, CA vs Southwest Arapahoe, CO
Comparing East San Gabriel Valley in California to Southwest Arapahoe in Colorado reveals significant differences in lifestyle, culture, and economy. Each of these places offers unique advantages, with East San Gabriel Valley boasting an excellent climate, diverse culture, and a larger economy, while Southwest Arapahoe prides itself on lower cost of living, superior infrastructure, and an education system that is one of the best in the region. This comparison will be comprehensive, covering multiple aspects of life in these two locations, and will be especially useful for those considering relocation or a visit.
East San Gabriel Valley has a higher crime rate compared to Southwest Arapahoe. While no place is entirely devoid of crime, vigilant law enforcement teams work hard to ensure safety. Southwest Arapahoe, on the other hand, prides itself on lower crime rates, making it safer for both residents and tourists.
Cost of Living
Living in East San Gabriel Valley is more expensive than in Southwest Arapahoe, reflected in housing, groceries, and healthcare. Those relocating to Southwest Arapahoe might find their dollar goes further compared to in East San Gabriel Valley, creating a lower cost of living.
Income Tax
California imposes a higher income tax than Colorado. This is notable when comparing East San Gabriel Valley to Southwest Arapahoe, influencing net income.
Property Tax
Property taxes in Southwest Arapahoe are lower than in East San Gabriel Valley, which can be a major consideration for homeowners and anyone planning to purchase real estate.
Sales Tax
Sales tax in California is higher than in Colorado, with East San Gabriel Valley residents subject to a total sales tax of 9.5%. Meanwhile, Southwest Arapahoe, Colorado imposes a combined city and state sales tax of 7.65%.
Income
Type
East San Gabriel Valley
Southwest Arapahoe
Estimated median household income
$95,242
$94,400
Estimated per capita income
$34,474
$57,187
Cost of living index (U.S. average is 100)
150.2
113.3
If you make $50,000 in Southwest Arapahoe, you will have to make $66,284 in East San Gabriel Valley to maintain the same standard of living.
Geographical Conditions
East San Gabriel Valley, close to beaches, mountains, and desert, offers abundant outdoor experiences. Southwest Arapahoe, near the Rocky Mountains, provides opportunities for hiking, skiing, and wildlife watching, making it particularly attractive to outdoorsy visitors and residents.
Geographical information
Type
East San Gabriel Valley
Southwest Arapahoe
Land area
212.6 sq. miles
69.4 sq. miles
Population density
4,478.5 people per sq. mile
2,907.1 people per sq. mile
Relative area comparison
East San Gabriel Valley, CA Southwest Arapahoe, CO
Education
Southwest Arapahoe features a robust education system with some top-ranking schools and universities in the state. In contrast, East San Gabriel Valley, while bustling with higher education institutions, has a school system that can vary greatly in quality by neighborhood.
East San Gabriel Valley boasts a larger economy, driven by industries such as entertainment, technology, and healthcare. Southwest Arapahoe also has a steady economy but at a smaller scale, with key industries in healthcare and education.
Biggest Employers
The biggest employers in East San Gabriel Valley include Walt Disney, Universal Studios, and Kaiser Permanente. In Southwest Arapahoe, the Cherry Creek School District and HealthONE are major employers.
In East San Gabriel Valley (Los Angeles County), 69.7% voted for Democrats and 27.8% for Republicans in 2012 Presidential Election. In Southwest Arapahoe (Arapahoe County), 54.4% voted for Democrats and 44.4% for Republicans.
Elections
Type
Democrats
Republicans
Other
Year
East San Gabriel Valley
Southwest Arapahoe
East San Gabriel Valley
Southwest Arapahoe
East San Gabriel Valley
Southwest Arapahoe
2020
71.0%
61.3%
26.9%
36.6%
2.1%
2.1%
2016
72.0%
53.1%
22.5%
38.9%
5.5%
8.1%
2012
69.7%
54.4%
27.8%
44.4%
2.4%
1.3%
2008
69.2%
56.0%
28.8%
43.0%
1.9%
1.0%
2004
63.3%
47.6%
35.7%
51.6%
1.0%
0.8%
2000
63.6%
43.6%
32.4%
51.6%
4.0%
4.8%
1996
59.3%
41.9%
31.0%
50.8%
9.7%
7.3%
Breakdown of population affiliated with a religious congregation
Type
Adherents
Congregations
Religion
East San Gabriel Valley
Southwest Arapahoe
East San Gabriel Valley
Southwest Arapahoe
CATHOLIC CHURCH
36.1%
12.1%
4.7%
4.3%
SOUTHERN BAPTIST CONVENTION
1.0%
1.6%
9.0%
9.9%
MUSLIM ESTIMATE
0.7%
1.9%
1.0%
1.0%
AMERICAN BAPTIST CHURCHES IN THE USA
0.5%
0.1%
3.1%
1.7%
SEVENTH DAY ADVENTIST CHURCH
0.5%
0.2%
2.4%
2.6%
EPISCOPAL CHURCH
0.4%
0.4%
1.4%
1.7%
EVANGELICAL LUTHERAN CHURCH IN AMERICA
0.2%
2.0%
1.9%
4.3%
LUTHERAN CHURCH
0.2%
1.0%
1.6%
2.6%
VINEYARD USA
0.1%
0.5%
0.3%
0.3%
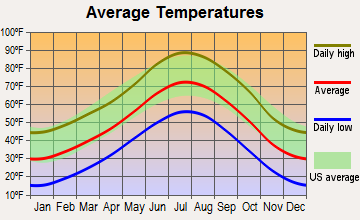
Weather
Weather patterns in East San Gabriel Valley tend to be mild, favoring outdoor activities all year round. In contrast, Southwest Arapahoe experiences all four seasons distinctly with a beautiful fall and sometimes harsh winters. This offers a great variety for tourists, especially those who enjoy winter sports.
Weather and climate
Type
East San Gabriel Valley
Southwest Arapahoe
Temperature - Average
62.7°F
50°F
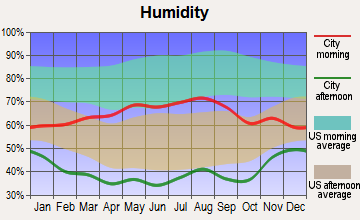
Humidity - Average morning or afternoon humidity
64.7%
50.6%
Humidity - Differences between morning and afternoon humidity
19.6%
20%
Humidity - Maximum monthly morning or afternoon humidity
70.7%
55%
Humidity - Minimum monthly morning or afternoon humidity
51%
35%
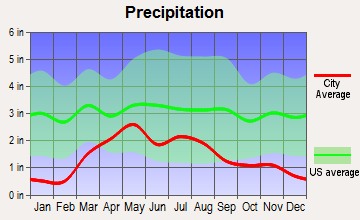
Precipitation - Yearly average
19.1 in
17.5 in
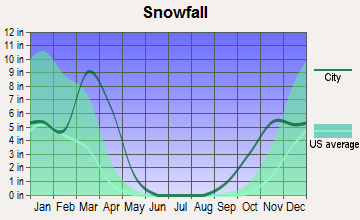
Snowfall - Yearly average
0 in
113.9 in
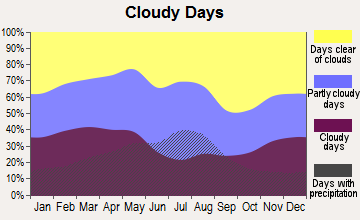
Clouds - Number of days clear of clouds
28.3%
19.2%
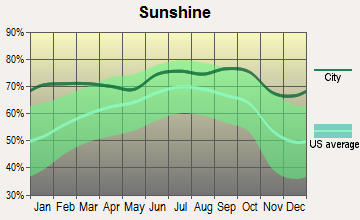
Sunshine amount - Average
78.4%
75.6%
Sunshine amount - Differences during a year
22%
10%
Sunshine amount - Maximum monthly
85%
74%
Sunshine amount - Minimum monthly
63%
64%
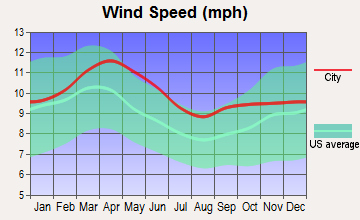
Wind speed - Average
3.7 mph
8.6 mph
Average climate in East San Gabriel Valley, California
Average climate in Southwest Arapahoe, Colorado
Air pollution
Type
AQI
CO
NO2
OZONE
PB
PM10
PM25
SO2
Year
East San Gabriel Valley
Southwest Arapahoe
East San Gabriel Valley
Southwest Arapahoe
East San Gabriel Valley
Southwest Arapahoe
East San Gabriel Valley
Southwest Arapahoe
East San Gabriel Valley
Southwest Arapahoe
East San Gabriel Valley
Southwest Arapahoe
East San Gabriel Valley
Southwest Arapahoe
East San Gabriel Valley
Southwest Arapahoe
2018
143
100
0.36
0.40
14.1
22.3
29.2
32.3
0.007
N/A
29.6
29.2
13.4
8.2
0.3
0.7
2017
150
95
0.35
0.40
14.8
22.6
30.5
32.6
0.007
N/A
32.7
22.0
12.6
8.2
0.3
0.8
2016
141
90
0.31
0.45
15.5
24.5
29.3
32.2
0.007
N/A
30.3
22.6
12.0
7.9
0.3
1.0
2015
145
101
0.30
0.46
15.2
24.2
30.4
30.7
0.007
N/A
30.0
20.8
14.6
9.6
0.2
1.0
2014
142
94
0.32
0.45
16.8
23.2
29.7
30.6
0.008
N/A
33.6
23.8
11.7
10.1
0.3
1.3
2013
147
85
0.33
0.41
17.0
20.7
27.7
31.2
0.007
N/A
31.5
23.1
11.5
N/A
0.4
1.4
2012
149
91
0.39
0.34
18.3
18.9
27.5
31.3
0.005
N/A
30.9
24.7
15.6
N/A
0.6
1.3
2011
149
91
0.40
0.33
18.6
18.1
26.7
30.4
0.008
N/A
30.3
23.8
17.3
N/A
0.5
1.6
2010
139
82
0.44
0.42
19.3
16.3
26.8
28.0
N/A
N/A
26.6
26.4
14.8
N/A
0.4
1.0
2009
156
79
0.40
0.37
21.0
14.1
28.0
26.9
0.010
0.005
26.0
22.4
16.5
N/A
0.6
1.3
2008
156
85
0.48
0.42
22.7
17.3
27.7
30.1
0.012
0.008
27.0
25.4
15.1
N/A
1.0
1.6
2007
135
96
0.52
0.40
25.3
20.6
24.8
27.6
0.014
0.007
N/A
29.4
N/A
N/A
1.3
1.2
2006
128
89
0.55
0.50
25.1
19.0
24.0
27.1
0.009
0.018
N/A
28.0
N/A
N/A
1.9
1.4
2005
127
86
0.59
0.57
25.7
21.3
22.8
23.6
0.014
0.090
N/A
29.8
N/A
N/A
1.9
1.5
2004
132
82
0.68
0.60
25.4
21.2
24.6
22.7
0.016
0.024
N/A
28.6
N/A
N/A
1.7
1.8
2003
137
106
0.80
0.59
29.9
21.2
24.7
24.5
0.021
0.027
N/A
32.6
N/A
N/A
1.4
1.9
2002
134
86
0.83
0.64
31.4
19.2
23.1
24.1
0.021
0.021
N/A
35.7
N/A
N/A
2.0
2.5
2001
141
95
1.00
0.80
31.8
22.2
21.4
22.2
0.029
0.021
N/A
32.6
N/A
N/A
2.1
2.6
2000
150
93
1.05
0.78
34.7
12.5
20.7
23.1
0.027
0.023
N/A
12.2
N/A
N/A
2.0
2.1
Natural disasters
Type
East San Gabriel Valley
Southwest Arapahoe
Tornado activity compared to U.S. average
18.5%
125.3%
Earthquake activity compared to U.S. average
7,292.4%
815.2%
Natural disasters compared to U.S. average
57%
10%
Transportation
Commutes can be longer in East San Gabriel Valley due to traffic, whereas Southwest Arapahoe boasts an efficient public transportation system and less traffic congestion, making commuting easier.
Transport
Type
East San Gabriel Valley
Southwest Arapahoe
Amtrak stations nearby
3
1
Means of transportation to work
Type
East San Gabriel Valley
Southwest Arapahoe
Bicycle
0.6%
0.4%
Bus
2.9%
2.6%
Carpooled
17.1%
8.7%
Car alone
73.3%
79.5%
Motorcycle
0.2%
0.1%
Railroad
0.6%
0%
Walked
2.2%
1.9%
Average travel time to work
Type
East San Gabriel Valley
Southwest Arapahoe
Average
32.3 min
23.6 min
Real Estate
Real estate in East San Gabriel Valley is more costly than in Southwest Arapahoe, due to its location near downtown Los Angeles. Southwest Arapahoe offers more affordable housing options, particularly for those looking to buy.
Neighborhoods
East San Gabriel Valley boasts vibrant neighborhoods, known for their diversity, food scene, and cultural events. Southwest Arapahoe showcases suburban tranquility, featuring well-maintained parks and a community-friendly atmosphere perfect for families.
Houses and residents
Type
East San Gabriel Valley
Southwest Arapahoe
Houses
270,240
74,676
Average household size (people)
3.5
2.3
Houses occupied
263,338 (97.4%)
72,320 (96.8%)
Houses occupied by owners
180,683 (68.6%)
51,515 (71.2%)
Houses occupied by renters
82,655 (31.4%)
20,805 (28.8%)
Median rent asked for vacant for-rent units
$1,935
$1,892
Median price asked for vacant for-sale houses and condos
$1,138,428
$836,561
Estimated median house or condo value
$643,048
$580,701
Median number of rooms in apartments
3.7
3.9
Median number of rooms in houses and condos
5.9
8.4
Renting percentage
32.3%
33.4%
Housing density (houses/condos per square mile)
1,270.8
1,076.2
Household income disparities
40.3%
39.5%
Housing units without a mortgage
26,635 (16.4%)
10,129 (21.9%)
Housing units with both a second mortgage and home equity loan
515 (0.3%)
188 (0.4%)
Housing units with a mortgage
136,243 (83.6%)
36,226 (78.1%)
Housing units with a home equity loan
11,429 (7%)
4,073 (8.8%)
Housing units with a second mortgage
21,150 (13%)
5,648 (12.2%)
Housing units lacking complete kitchen facilities
1%
0.6%
Housing units lacking complete plumbing facilities
0.8%
0.3%
Housing units in structures
Housing units in structures
East San Gabriel Valley
Southwest Arapahoe
One, detached
68.5%
63.6%
One, attached
8.2%
9.1%
Two
1.0%
1.2%
3 or 4
3.9%
2.3%
5 to 9
3.0%
4.5%
10 to 19
2.4%
6.5%
20 to 49
2.8%
6.2%
50 or more
6.5%
4.8%
Mobile homes
3.6%
1.5%
Boats, RVs, vans, etc.
0.1%
0.1%
Median real estate property taxes paid for housing units
Self-employed workers in own not incorporated business
25,753
8,094
State government workers
13,845
2,412
Unpaid family workers
1,494
266
Industries and Occupations
Key occupations in East San Gabriel Valley surround the entertainment and technology sectors, while Southwest Arapahoe provides many jobs in healthcare, education, and local government.
Both East San Gabriel Valley and Southwest Arapahoe offer sufficient healthcare facilities. However, East San Gabriel Valley, with large hospitals such as Kaiser Permanente, can offer more specialized care.
Health (county statistics)
Type
East San Gabriel Valley
Southwest Arapahoe
General health status score of residents in this county from 1 (poor) to 5 (excellent)
Southwest Arapahoe enjoys superior infrastructure with well-maintained roads, public facilities, and modern utility services. East San Gabriel Valley also has good infrastructure, but the larger population can put strain on public resources.
Infrastructure
Type
East San Gabriel Valley
Southwest Arapahoe
TV stations
24
16
Culture and Food
East San Gabriel Valley is known for its diverse culture and culinary scene, with cuisine from around the world. In contrast, Southwest Arapahoe enjoys a quieter, more relaxed cultural vibe, with an affinity for local flavors and outdoor sports.
Sports Teams
Residents of East San Gabriel Valley, being in the vicinity of Los Angeles, enjoy access to professional sports teams such as the Lakers, Dodgers, and the Rams. Southwest Arapahoe residents are close to Denver, with its Broncos, Nuggets, and Rockies teams as local favorites.
 East San Gabriel Valley, CA
 Southwest Arapahoe, CO