East San Gabriel Valley, California and Tulsa, Oklahoma are two diverse regions with their own unique qualities and attractions. East San Gabriel Valley, part of the greater metropolitan Los Angeles area, offers a blend of suburban charm, diverse culture, and proximity to the economic powerhouse of LA. On the other hand, Tulsa, the second-largest city in Oklahoma, offers a high standard of living with an appealing blend of Southern hospitality, rich history, and a sizable creative arts scene. Both provide different lifestyles, opportunities, and challenges for those looking to relocate or visit as tourists, and they vary greatly in aspects such as crime/safety, weather, cost of living, and more.
When comparing crime rates, Tulsa, Oklahoma tends to have a higher overall crime rate than the East San Gabriel Valley, California. Tulsa's crime rate often tops the national average, predominantly due to higher rates of property crime. Meanwhile, despite being in the vicinity of Los Angeles, East San Gabriel Valley generally boasts lower crime rates due to its suburban nature and focused policing efforts. Because of this, residents and tourists often feel safer wandering around East San Gabriel Valley than in Tulsa.
Cost of Living
In terms of the cost of living, East San Gabriel Valley is significantly more expensive. Housing prices are considerably higher, with median home prices being multiple times higher than those in Tulsa. General living expenses, such as groceries, healthcare, and utilities, also often run higher in East San Gabriel Valley. In contrast, Tulsa is frequently ranked as one of the most affordable major cities in the U.S, offering lower housing costs and cheaper living expenses.
Income Tax
California has a progressive income tax system, with rates ranging from 1% up to 13.3%, while Oklahoma's top income tax rate is 5%, making it a more affordable state for taxpayers with high incomes.
Property Tax
California has a property tax rate average of 0.73%, and specific to East San Gabriel Valley, rates generally hover around this average. Meanwhile, Oklahoma's average property tax rate is 0.88%, with Tulsa's rates being slightly above the state average.
Sales Tax
California has a state sales tax rate of 7.25%, but with local taxes, the total sales tax rate can be as high as 10.5% in some areas of East San Gabriel Valley. In contrast, Oklahoma's state sales tax rate is 4.5%, however, with local taxes considered, Tulsa has a total sales tax rate of around 8.517%.
Income
Type
East San Gabriel Valley
Tulsa
Estimated median household income
$95,242
$51,008
Estimated per capita income
$34,474
$33,002
Cost of living index (U.S. average is 100)
150.2
86.5
If you make $50,000 in Tulsa, you will have to make $86,821 in East San Gabriel Valley to maintain the same standard of living.
Geographical Conditions
East San Gabriel Valley is characterized by its picturesque valley landscape and is in close proximity to the Pacific Ocean and the San Gabriel Mountains. Tulsa, located on the Arkansas River, features rolling green hills and is part of the region known as Green Country for its foliage.
Geographical information
Type
East San Gabriel Valley
Tulsa
Land area
212.6 sq. miles
182.6 sq. miles
Population density
4,478.5 people per sq. mile
2,252.4 people per sq. mile
Relative area comparison
East San Gabriel Valley, CA Tulsa, OK
Education
Both East San Gabriel Valley and Tulsa provide substantial educational opportunities. East San Gabriel Valley has access to the well-resourced and highly rated California school system and is in close proximity to numerous esteemed universities, including the University of Southern California and UCLA. Tulsa has an extensive public school system and is home to numerous colleges and universities, including the University of Tulsa, making it a viable choice for families and students.
As part of the greater Los Angeles area, East San Gabriel Valley benefits from a diverse and robust economy, with opportunities spanning multiple sectors. Its labor market is larger and more diverse with opportunities across a broad range of fields from entertainment to technology. Tulsa's economy is more reliant on the energy sector, but the city is also a hub for finance, aviation, telecommunication, and technology companies.
Biggest Employers
The largest employers in East San Gabriel Valley include large corporations such as Walt Disney and Universal Studios, as well as technological giants like Google and Apple. Educational institutions like the University of Southern California and UCLA also employ significant numbers. Tulsa's biggest employers include the Williams Companies (energy), Saint Francis Health System, and American Airlines' Maintenance Base.
In East San Gabriel Valley (Los Angeles County), 69.7% voted for Democrats and 27.8% for Republicans in 2012 Presidential Election. In Tulsa (Tulsa County), 36.3% voted for Democrats and 63.7% for Republicans.
Elections
Type
Democrats
Republicans
Other
Year
East San Gabriel Valley
Tulsa
East San Gabriel Valley
Tulsa
East San Gabriel Valley
Tulsa
2020
71.0%
40.9%
26.9%
56.5%
2.1%
2.7%
2016
72.0%
35.6%
22.5%
58.4%
5.5%
6.1%
2012
69.7%
36.3%
27.8%
63.7%
2.4%
0.0%
2008
69.2%
37.8%
28.8%
62.2%
1.9%
0.0%
2004
63.3%
35.6%
35.7%
64.4%
1.0%
0.0%
2000
63.6%
37.3%
32.4%
61.3%
4.0%
1.3%
1996
59.3%
37.1%
31.0%
53.6%
9.7%
9.3%
Breakdown of population affiliated with a religious congregation
Type
Adherents
Congregations
Religion
East San Gabriel Valley
Tulsa
East San Gabriel Valley
Tulsa
CATHOLIC CHURCH
36.1%
8.1%
4.7%
3.1%
SOUTHERN BAPTIST CONVENTION
1.0%
14.9%
9.0%
18.6%
MUSLIM ESTIMATE
0.7%
0.5%
1.0%
0.7%
AMERICAN BAPTIST CHURCHES IN THE USA
0.5%
0.3%
3.1%
0.5%
SEVENTH DAY ADVENTIST CHURCH
0.5%
0.4%
2.4%
1.1%
EPISCOPAL CHURCH
0.4%
0.8%
1.4%
1.3%
EVANGELICAL LUTHERAN CHURCH IN AMERICA
0.2%
0.4%
1.9%
0.9%
LUTHERAN CHURCH
0.2%
0.7%
1.6%
1.2%
INTERNA PENTECO HOLINESS CHURCH
0.0%
0.7%
0.3%
0.7%
NATIONAL ASSOCIATION FREE WILL BAPTISTS
0.0%
0.5%
0.1%
3.1%
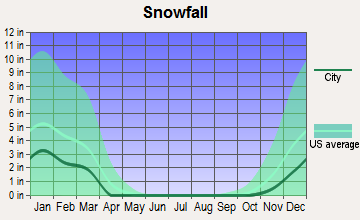
Weather
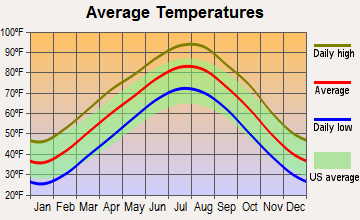
The weather in these two places is vastly different. East San Gabriel Valley enjoys a Mediterranean climate, characterized by warm, dry summers and mild, wet winters. This consistent, temperate climate is especially attractive to tourists and potential residents who enjoy outdoor activities year-round. Tulsa, on the other hand, experiences a humid subtropical climate with hot, humid summers and mild winters. It can also be prone to severe weather in the form of thunderstorms and tornadoes, especially in the spring and early fall.
Weather and climate
Type
East San Gabriel Valley
Tulsa
Temperature - Average
62.7°F
60.4°F
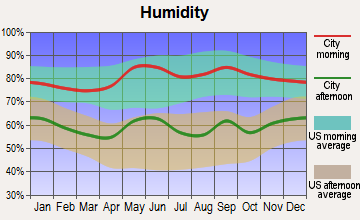
Humidity - Average morning or afternoon humidity
64.7%
73.8%
Humidity - Differences between morning and afternoon humidity
19.6%
33%
Humidity - Maximum monthly morning or afternoon humidity
70.7%
85%
Humidity - Minimum monthly morning or afternoon humidity
51%
52%
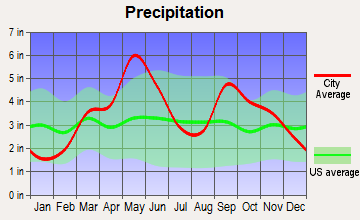
Precipitation - Yearly average
19.1 in
42.1 in
Snowfall - Yearly average
0 in
18.4 in
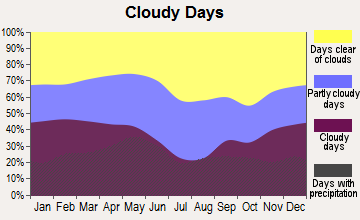
Clouds - Number of days clear of clouds
28.3%
21.1%
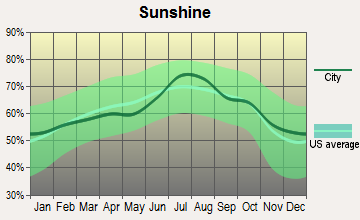
Sunshine amount - Average
78.4%
64.8%
Sunshine amount - Differences during a year
22%
24%
Sunshine amount - Maximum monthly
85%
74%
Sunshine amount - Minimum monthly
63%
50%
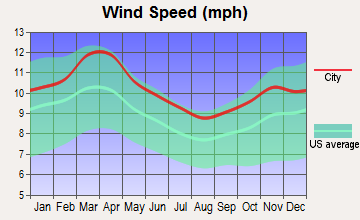
Wind speed - Average
3.7 mph
10.2 mph
Average climate in East San Gabriel Valley, California
Average climate in Tulsa, Oklahoma
Air pollution
Type
AQI
CO
NO2
OZONE
PB
PM10
PM25
SO2
Year
East San Gabriel Valley
Tulsa
East San Gabriel Valley
Tulsa
East San Gabriel Valley
Tulsa
East San Gabriel Valley
Tulsa
East San Gabriel Valley
Tulsa
East San Gabriel Valley
East San Gabriel Valley
Tulsa
East San Gabriel Valley
Tulsa
2018
143
88
0.36
0.24
14.1
N/A
29.2
28.6
0.007
0.004
29.6
N/A
13.4
11.6
0.3
0.4
2017
150
80
0.35
0.22
14.8
N/A
30.5
29.9
0.007
0.004
32.7
N/A
12.6
10.2
0.3
0.5
2016
141
86
0.31
0.24
15.5
N/A
29.3
29.1
0.007
0.005
30.3
N/A
12.0
9.5
0.3
0.5
2015
145
74
0.30
0.25
15.2
N/A
30.4
28.1
0.007
0.004
30.0
N/A
14.6
8.6
0.2
0.8
2014
142
74
0.32
0.16
16.8
N/A
29.7
29.2
0.008
0.005
33.6
N/A
11.7
9.2
0.3
0.3
2013
147
85
0.33
0.21
17.0
N/A
27.7
29.8
0.007
0.005
31.5
N/A
11.5
10.1
0.4
0.5
2012
149
103
0.39
0.21
18.3
N/A
27.5
32.4
0.005
0.007
30.9
N/A
15.6
11.7
0.6
0.7
2011
149
108
0.40
0.27
18.6
N/A
26.7
33.8
0.008
0.005
30.3
N/A
17.3
13.8
0.5
0.8
2010
139
83
0.44
0.26
19.3
N/A
26.8
30.1
N/A
0.004
26.6
N/A
14.8
12.2
0.4
0.7
2009
156
88
0.40
0.26
21.0
N/A
28.0
29.8
0.010
0.004
26.0
N/A
16.5
12.2
0.6
0.7
2008
156
71
0.48
N/A
22.7
N/A
27.7
26.7
0.012
0.007
27.0
N/A
15.1
N/A
1.0
N/A
2007
135
77
0.52
0.32
25.3
N/A
24.8
28.8
0.014
0.007
N/A
N/A
N/A
N/A
1.3
0.8
2006
128
95
0.55
N/A
25.1
N/A
24.0
32.9
0.009
N/A
N/A
N/A
N/A
N/A
1.9
N/A
2005
127
84
0.59
N/A
25.7
N/A
22.8
28.9
0.014
N/A
N/A
N/A
N/A
N/A
1.9
N/A
2004
132
71
0.68
N/A
25.4
N/A
24.6
27.5
0.016
N/A
N/A
N/A
N/A
N/A
1.7
N/A
2003
137
94
0.80
N/A
29.9
N/A
24.7
29.2
0.021
N/A
N/A
N/A
N/A
N/A
1.4
N/A
2002
134
85
0.83
0.83
31.4
7.8
23.1
27.7
0.021
N/A
N/A
N/A
N/A
N/A
2.0
N/A
2001
141
102
1.00
0.75
31.8
14.4
21.4
30.6
0.029
N/A
N/A
N/A
N/A
N/A
2.1
N/A
2000
150
101
1.05
0.69
34.7
15.3
20.7
28.9
0.027
N/A
N/A
N/A
N/A
N/A
2.0
N/A
Natural disasters
Type
East San Gabriel Valley
Tulsa
Tornado activity compared to U.S. average
18.5%
277.6%
Earthquake activity compared to U.S. average
7,292.4%
901.9%
Natural disasters compared to U.S. average
57%
34%
Transportation
Both regions have efficient transportation systems. East San Gabriel Valley enjoys access to Los Angeles' extensive public transportation system, including Metro buses and light rail lines. Tulsa's public transportation is primarily served by Tulsa Transit's bus system and an extensive network of commuter highways.
Transport
Type
East San Gabriel Valley
Tulsa
Amtrak stations
0
1
Amtrak stations nearby
3
1
FAA registered aircraft
0
808
FAA registered aircraft manufacturers and dealers
0
35
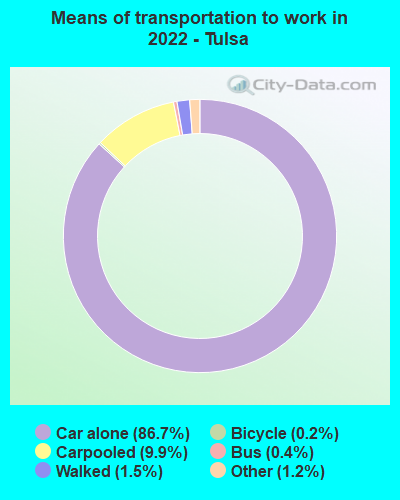
Means of transportation to work
Type
East San Gabriel Valley
Tulsa
Bicycle
0.6%
0.1%
Bus
2.9%
0.1%
Carpooled
17.1%
9%
Car alone
73.3%
87.9%
Motorcycle
0.2%
0.1%
Railroad
0.6%
0%
Taxicab
0%
0.1%
Walked
2.2%
1.4%
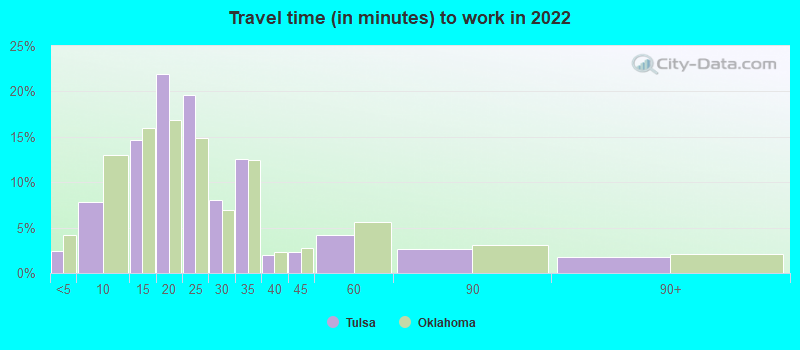
Average travel time to work
Type
East San Gabriel Valley
Tulsa
Average
32.3 min
23.8 min
Real Estate
Real estate in East San Gabriel Valley is much pricier than Tulsa. This is reflected in both rental and property prices. The higher costs can be attributed to high demand and limited supply, especially in desirable neighborhoods. In contrast, homes in Tulsa are much more affordable, with a median home price that is significantly lower than the national average.
Neighborhoods
Neighborhoods in East San Gabriel Valley offer diverse living options from urban to suburban communities. Key areas include Covina, West Covina, and Diamond Bar. Tulsa, on the other hand, also boasts diverse neighborhoods such as Downtown Tulsa, South Tulsa, and Brookside. Each offers unique attractions, housing styles, and lifestyle amenities.
Houses and residents
Type
East San Gabriel Valley
Tulsa
Houses
270,240
194,402
Average household size (people)
3.5
2.3
Houses occupied
263,338 (97.4%)
173,943 (89.5%)
Houses occupied by owners
180,683 (68.6%)
89,307 (51.3%)
Houses occupied by renters
82,655 (31.4%)
84,636 (48.7%)
Median rent asked for vacant for-rent units
$1,935
$899.30
Median price asked for vacant for-sale houses and condos
$1,138,428
$163,212
Estimated median house or condo value
$643,048
$172,000
Median number of rooms in apartments
3.7
4.1
Median number of rooms in houses and condos
5.9
6.4
Renting percentage
32.3%
46.5%
Housing density (houses/condos per square mile)
1,270.8
1,064.4
Household income disparities
40.3%
48.1%
Housing units without a mortgage
26,635 (16.4%)
855 (1.7%)
Housing units with both a second mortgage and home equity loan
515 (0.3%)
2,464 (4.8%)
Housing units with a mortgage
136,243 (83.6%)
50,494 (98.3%)
Housing units with a home equity loan
11,429 (7%)
93 (0.2%)
Housing units with a second mortgage
21,150 (13%)
3,580 (7%)
Housing units lacking complete kitchen facilities
1%
2.9%
Housing units lacking complete plumbing facilities
Self-employed workers in own not incorporated business
25,753
13,964
State government workers
13,845
5,897
Unpaid family workers
1,494
284
Industries and Occupations
In East San Gabriel Valley, industries span from entertainment and tourism, high-tech sectors, and finance. With proximity to Hollywood, the film and TV industry is significant, but technology and healthcare companies are also prominent employers. Meanwhile, in Tulsa, industries tend to be more focused on energy, aerospace, finance, and the technology sector.
Both regions have access to high-quality healthcare. East San Gabriel Valley residents have access to top-rated hospitals in Los Angeles County. Tulsa residents can access quality healthcare through major health systems like the Saint Francis Health System and the Hillcrest Medical Center.
Health (county statistics)
Type
East San Gabriel Valley
Tulsa
General health status score of residents in this county from 1 (poor) to 5 (excellent)
Both regions have solid infrastructures. East San Gabriel Valley, being suburban, benefits from Los Angeles County's extensive road, public transit systems, and robust utilities infrastructure. Tulsa boasts a well-maintained infrastructure with reliable utilities, well-paved roads, and its own international airport.
Infrastructure
Type
East San Gabriel Valley
Tulsa
TV stations
24
20
Culture and Food
The East San Gabriel Valley is known for its diverse food scene that combines influences from various cultures. It's particularly celebrated for its Asian cuisines due to its significant Asian-American population. In contrast, Tulsa is known for its southern and BBQ food. Both regions have robust cultural scenes, with various museums and art galleries, however, East San Gabriel Valley's proximity to LA gives it access to a wider array of cultural opportunities.
Sports Teams
As part of the Los Angeles metropolitan area, East San Gabriel Valley is home to numerous professional sports teams such as the LA Dodgers (Baseball), LA Lakers (Basketball), and LA Kings (Hockey). Meanwhile, Tulsa does not have any major league sports teams but hosts minor league teams such as the Tulsa Drillers (Baseball) and the Tulsa Oilers (Hockey).
 East San Gabriel Valley, CA
 Tulsa, OK