East San Gabriel Valley, California and Virginia Beach, Virginia are two dynamic regions located on opposite sides of the United States. They both offer unique lifestyles and have rich cultures, excellent job opportunities, and diverse entertainment options. This comparison aims to provide a comprehensive guide to those considering relocation or a visit to either city, focusing on several crucial aspects. It includes crime and safety, weather, cost of living, education, work and economy, infrastructure, industries and occupations, biggest employers, real-estate, neighborhoods, transportation, taxes, culture, sports teams, geographical conditions, and health care.
The crime rates in East San Gabriel Valley are lower than the national average, making it a safer place to live compared to Virginia Beach, which has crime rates slightly above the national average. However, both places have efficient law enforcement agencies and emergency services, making them fairly safe for both residents and tourists.
Cost of Living
Living expenses and housing costs in East San Gabriel Valley are significantly higher than in Virginia Beach, reflecting California's high cost of living. Factors such as taxes, food, utilities, and even gas are notably more costly here.
Income Tax
Virginia Beach residents pay a lower state income tax rate at 5.75% at the highest income level compared to California's highest rate of 13.3%, affecting those residing in East San Gabriel Valley.
Property Tax
Virginia Beach's property tax rates are significantly lower than in East San Gabriel Valley. Virginia has one of the lowest property tax rates in the country, at 0.80%, while California's average is 0.73%. However, due to California's higher housing prices, homeowners generally pay more in property taxes.
Sales Tax
Virginia Beach has a lower state and local sales tax rate (5.3%), compared to East San Gabriel Valley, which levies a 9.5% sales tax, attributed to California's high-tax rate policy.
Income
Type
East San Gabriel Valley
Virginia Beach
Estimated median household income
$95,242
$81,634
Estimated per capita income
$34,474
$42,498
Cost of living index (U.S. average is 100)
150.2
97
If you make $50,000 in Virginia Beach, you will have to make $77,423 in East San Gabriel Valley to maintain the same standard of living.
Geographical Conditions
Geographically speaking, East San Gabriel Valley resides in a hilly region with several parks and wilderness areas, whereas Virginia Beach offers a scenic coastal environment, with clean sandy beaches and charming waterfront neighborhoods.
Geographical information
Type
East San Gabriel Valley
Virginia Beach
Land area
212.6 sq. miles
248.3 sq. miles
Population density
4,478.5 people per sq. mile
1,843.3 people per sq. mile
Relative area comparison
East San Gabriel Valley, CA Virginia Beach, VA
Education
Both regions offer quality education with a variety of schooling options, but California's educational opportunities including the University of California system and other reputed institutions are well-regarded nationally. Virginia Beach schools also deliver a high standard of education, and the proximity to several prestigious universities in the East Coast is a plus.
East San Gabriel Valley's economy is primarily driven by sectors such as healthcare, retail, and education, while Virginia Beach has a more diverse economy, with military, agribusiness, tourism, and an emerging technology sector playing key roles. Both regions offer competitive employment opportunities and have lower than average unemployment rates.
Biggest Employers
The biggest employers in East San Gabriel Valley include Citrus Valley Health Partners, Queen of the Valley Hospital, and West Covina Unified School District. In Virginia Beach, military installations, schools, and hospitals, such as Virginia Beach City Public Schools, and Sentara Healthcare, provide the most job opportunities.
In East San Gabriel Valley (Los Angeles County), 69.7% voted for Democrats and 27.8% for Republicans in 2012 Presidential Election. In Virginia Beach (Virginia Beach city), 48.1% voted for Democrats and 50.7% for Republicans.
Elections
Type
Democrats
Republicans
Other
Year
East San Gabriel Valley
Virginia Beach
East San Gabriel Valley
Virginia Beach
East San Gabriel Valley
Virginia Beach
2020
71.0%
51.6%
26.9%
46.2%
2.1%
2.2%
2016
72.0%
44.8%
22.5%
48.4%
5.5%
6.8%
2012
69.7%
48.1%
27.8%
50.7%
2.4%
1.2%
2008
69.2%
49.3%
28.8%
50.1%
1.9%
0.6%
2004
63.3%
40.4%
35.7%
59.3%
1.0%
0.4%
2000
63.6%
41.8%
32.4%
56.1%
4.0%
2.1%
1996
59.3%
41.4%
31.0%
50.6%
9.7%
8.0%
Breakdown of population affiliated with a religious congregation
Type
Adherents
Congregations
Religion
East San Gabriel Valley
Virginia Beach
East San Gabriel Valley
Virginia Beach
CATHOLIC CHURCH
36.1%
10.7%
4.7%
4.2%
SOUTHERN BAPTIST CONVENTION
1.0%
4.9%
9.0%
13.6%
MUSLIM ESTIMATE
0.7%
0.8%
1.0%
0.4%
AMERICAN BAPTIST CHURCHES IN THE USA
0.5%
0.4%
3.1%
0.4%
SEVENTH DAY ADVENTIST CHURCH
0.5%
0.1%
2.4%
1.1%
EPISCOPAL CHURCH
0.4%
1.4%
1.4%
4.2%
EVANGELICAL LUTHERAN CHURCH IN AMERICA
0.2%
0.4%
1.9%
1.5%
VINEYARD USA
0.1%
0.4%
0.3%
1.1%
Weather
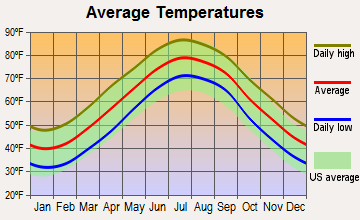
East San Gabriel Valley enjoys a Mediterranean climate with warm, dry summers and mild winters which is typical for Southern California. Virginia Beach, on the other hand, experiences a humid subtropical climate, with hot, humid summers, and mild to cool winters.
Weather and climate
Type
East San Gabriel Valley
Virginia Beach
Temperature - Average
62.7°F
59.7°F
Humidity - Average morning or afternoon humidity
64.7%
73%
Humidity - Differences between morning and afternoon humidity
19.6%
32%
Humidity - Maximum monthly morning or afternoon humidity
70.7%
83%
Humidity - Minimum monthly morning or afternoon humidity
51%
51%
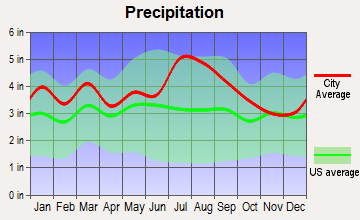
Precipitation - Yearly average
19.1 in
45.9 in
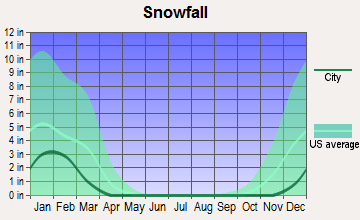
Snowfall - Yearly average
0 in
15.4 in
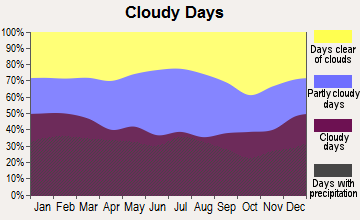
Clouds - Number of days clear of clouds
28.3%
17.6%
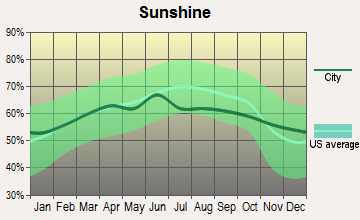
Sunshine amount - Average
78.4%
66.8%
Sunshine amount - Differences during a year
22%
14%
Sunshine amount - Maximum monthly
85%
67%
Sunshine amount - Minimum monthly
63%
53%
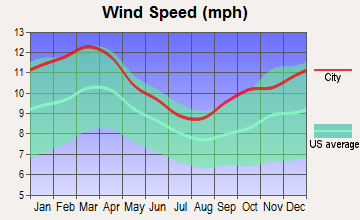
Wind speed - Average
3.7 mph
10.4 mph
Average climate in East San Gabriel Valley, California
Average climate in Virginia Beach, Virginia
Air pollution
Type
AQI
CO
NO2
OZONE
PB
PM10
PM25
SO2
Year
East San Gabriel Valley
Virginia Beach
East San Gabriel Valley
Virginia Beach
East San Gabriel Valley
Virginia Beach
East San Gabriel Valley
Virginia Beach
East San Gabriel Valley
Virginia Beach
East San Gabriel Valley
East San Gabriel Valley
Virginia Beach
East San Gabriel Valley
Virginia Beach
2018
143
57
0.36
0.27
14.1
6.3
29.2
31.3
0.007
0.002
29.6
N/A
13.4
6.1
0.3
0.4
2017
150
60
0.35
0.22
14.8
6.8
30.5
33.2
0.007
0.002
32.7
N/A
12.6
6.9
0.3
0.3
2016
141
66
0.31
0.21
15.5
6.5
29.3
31.7
0.007
0.002
30.3
N/A
12.0
6.1
0.3
0.4
2015
145
57
0.30
0.27
15.2
7.3
30.4
33.8
0.007
0.002
30.0
N/A
14.6
6.4
0.2
0.5
2014
142
59
0.32
0.27
16.8
7.5
29.7
33.8
0.008
0.002
33.6
N/A
11.7
6.8
0.3
1.1
2013
147
66
0.33
0.28
17.0
7.1
27.7
31.2
0.007
0.002
31.5
N/A
11.5
6.8
0.4
1.1
2012
149
76
0.39
0.29
18.3
7.8
27.5
34.6
0.005
0.002
30.9
N/A
15.6
8.1
0.6
1.1
2011
149
66
0.40
0.27
18.6
9.2
26.7
35.1
0.008
0.003
30.3
N/A
17.3
8.8
0.5
1.7
2010
139
71
0.44
0.25
19.3
4.8
26.8
38.4
N/A
0.004
26.6
N/A
14.8
N/A
0.4
2.2
2009
156
51
0.40
0.25
21.0
9.7
28.0
31.5
0.010
0.012
26.0
N/A
16.5
N/A
0.6
2.6
2008
156
77
0.48
0.23
22.7
10.3
27.7
36.2
0.012
0.004
27.0
N/A
15.1
N/A
1.0
3.3
2007
135
81
0.52
0.18
25.3
12.2
24.8
36.3
0.014
0.004
N/A
N/A
N/A
N/A
1.3
4.3
2006
128
62
0.55
0.32
25.1
N/A
24.0
36.2
0.009
0.004
N/A
N/A
N/A
N/A
1.9
3.4
2005
127
67
0.59
0.28
25.7
N/A
22.8
35.4
0.014
N/A
N/A
N/A
N/A
N/A
1.9
3.4
2004
132
80
0.68
0.30
25.4
15.9
24.6
33.3
0.016
N/A
N/A
N/A
N/A
N/A
1.7
4.3
2003
137
84
0.80
0.34
29.9
16.2
24.7
34.3
0.021
N/A
N/A
N/A
N/A
N/A
1.4
3.9
2002
134
99
0.83
0.40
31.4
17.8
23.1
38.0
0.021
N/A
N/A
N/A
N/A
N/A
2.0
5.9
2001
141
92
1.00
0.42
31.8
18.2
21.4
36.3
0.029
N/A
N/A
N/A
N/A
N/A
2.1
6.0
2000
150
85
1.05
0.44
34.7
15.7
20.7
36.5
0.027
N/A
N/A
N/A
N/A
N/A
2.0
6.5
Natural disasters
Type
East San Gabriel Valley
Virginia Beach
Tornado activity compared to U.S. average
18.5%
61.5%
Earthquake activity compared to U.S. average
7,292.4%
35.2%
Natural disasters compared to U.S. average
57%
0%
Transportation
Public transportation in East San Gabriel Valley is comprehensive, with buses and Metrolink trains providing connectivity to various parts of the county. Virginia Beach, however, mainly relies on personal vehicles and public buses, due to its sprawling geography.
Transport
Type
East San Gabriel Valley
Virginia Beach
Amtrak stations
0
1
Amtrak stations nearby
3
2
FAA registered aircraft
0
374
FAA registered aircraft manufacturers and dealers
0
4
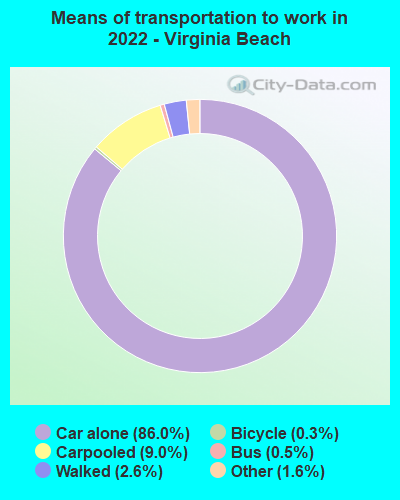
Means of transportation to work
Type
East San Gabriel Valley
Virginia Beach
Bicycle
0.6%
0.2%
Bus
2.9%
1%
Carpooled
17.1%
9.5%
Car alone
73.3%
84.2%
Motorcycle
0.2%
0.1%
Railroad
0.6%
0%
Walked
2.2%
3.2%
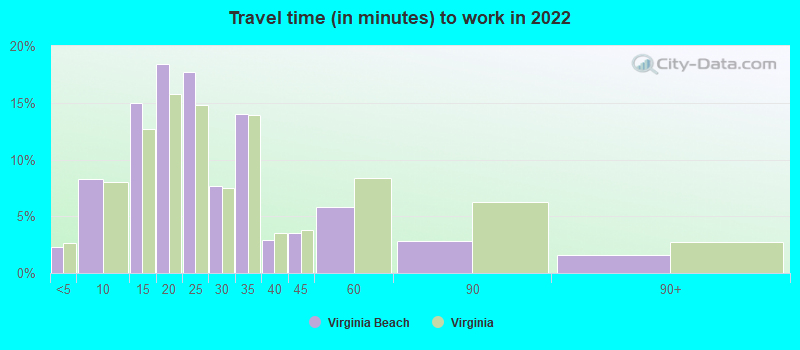
Average travel time to work
Type
East San Gabriel Valley
Virginia Beach
Average
32.3 min
24.8 min
Real Estate
Real estate in East San Gabriel Valley is highly coveted and significantly more costly than in Virginia Beach, given its location near Los Angeles. Virginia Beach offers affordable housing options with a lower cost per square foot, making home ownership more achievable.
Neighborhoods
There are well-established residential areas in both regions, each with unique characteristics. The East San Gabriel Valley has upscale suburbs such as Claremont and Walnut. Virginia Beach neighborhoods like Alanton and Bay Colony offer beachside living.
Houses and residents
Type
East San Gabriel Valley
Virginia Beach
Houses
270,240
190,981
Average household size (people)
3.5
2.6
Houses occupied
263,338 (97.4%)
182,775 (95.7%)
Houses occupied by owners
180,683 (68.6%)
119,144 (65.2%)
Houses occupied by renters
82,655 (31.4%)
63,631 (34.8%)
Median rent asked for vacant for-rent units
$1,935
$1,833
Median price asked for vacant for-sale houses and condos
$1,138,428
$508,833
Estimated median house or condo value
$643,048
$328,500
Median number of rooms in apartments
3.7
4.6
Median number of rooms in houses and condos
5.9
7
Renting percentage
32.3%
34.7%
Housing density (houses/condos per square mile)
1,270.8
769.2
Household income disparities
40.3%
40.6%
Housing units without a mortgage
26,635 (16.4%)
2,373 (2.6%)
Housing units with both a second mortgage and home equity loan
515 (0.3%)
9,070 (10%)
Housing units with a mortgage
136,243 (83.6%)
88,748 (97.4%)
Housing units with a home equity loan
11,429 (7%)
287 (0.3%)
Housing units with a second mortgage
21,150 (13%)
10,952 (12%)
Housing units lacking complete kitchen facilities
1%
1%
Housing units lacking complete plumbing facilities
Self-employed workers in own not incorporated business
25,753
9,992
State government workers
13,845
6,577
Unpaid family workers
1,494
251
Industries and Occupations
In East San Gabriel Valley, the biggest industries are healthcare, retail, and education. Virginia Beach has a significant military and defense presence due to its proximity to several military bases. Also, tourism and agribusiness play a crucial role.
In health care, both regions have high-quality medical facilities. East San Gabriel Valley is served by several renowned health care systems including Citrus Valley Health Partners. In Virginia Beach, Sentara Healthcare and Chesapeake Regional Healthcare provide excellent medical care.
Health (county statistics)
Type
East San Gabriel Valley
Virginia Beach
General health status score of residents in this county from 1 (poor) to 5 (excellent)
Infrastructure in both places is well-maintained and continuously being upgraded. However, East San Gabriel Valley benefits from being part of the Los Angeles Metropolitan area network of freeways, airports, and ports. Virginia Beach's infrastructure includes renowned seafront amenities, parks, and a well-developed downtown district.
Infrastructure
Type
East San Gabriel Valley
Virginia Beach
TV stations
24
24
Culture and Food
Both regions boast vibrant cultures and excellent food scenes. The East San Gabriel Valley offers a rich diversity of Asian cuisines while Virginia Beach offers a delightful mix of Southern cuisine, seafood, and international dishes. In terms of cultural activities, both regions host festivals, concerts, and art fairs throughout the year.
Sports Teams
East San Gabriel Valley does not have professional sports teams but being close to Los Angeles, residents have access to LA-based teams in the NFL, MLB, NBA, and NHL. Virginia Beach has no professional sports team but sports enthusiasts can follow teams from nearby cities like Norfolk and Richmond.
 East San Gabriel Valley, CA
 Virginia Beach, VA