Comparing East Seattle and Bellevue, one notes both significant similarities and striking differences. Nestled in the Pacific Northwest, both cities offer a mix of urban and outdoor lifestyle with unique economic conditions, educational opportunities, and cultural experiences. Here's a deep dive into their differences for those looking to relocate or simply visiting.
Based on data from the area, Bellevue is ranked as one of the safer cities in Washington State with a lower crime rate than East Seattle. Residents and tourists report feeling safer in Bellevue, both in terms of personal safety and property crime. However, East Seattle also provides a relatively safe environment, particularly in comparison to larger metropolitan areas, but it's crucial to research specific neighborhoods when planning a move or visit.
Cost of Living
Bellevue tends to be more expensive than East Seattle. This includes housing, which significantly influences the cost of living. Groceries, health care, and miscellaneous expenses such as clothing and entertainment are also more expensive in Bellevue. That being said, the income level in Bellevue is higher on average, potentially offsetting some of these additional costs.
Income Tax
An advantage of living in either East Seattle or Bellevue is that Washington State does not have a state income tax. This fact appeals to many residents, particularly those with higher incomes.
Property Tax
Both cities fall under King County's property tax jurisdiction, and rates are similar. However, due to the higher property values in Bellevue, homeowners may find their property tax bill significantly higher.
Sales Tax
Both cities are under the purview of Washington state's sales tax, which is relatively high compared to other states. There are no differences between East Seattle and Bellevue in this regard as they are governed by the same state tax laws.
Income
Type
East Seattle
Bellevue
Estimated median household income
$135,835
$144,274
Estimated per capita income
$77,151
$78,786
Cost of living index (U.S. average is 100)
128.6
118.2
If you make $50,000 in Bellevue, you will have to make $54,399 in East Seattle to maintain the same standard of living.
Geographical Conditions
Bellevue is characterized by its beautiful scenery, including views of the Olympic and Cascade Mountains, and Lake Washington. East Seattle residents also enjoy stunning Pacific Northwest landscapes, outdoor activities, and water views.
Geographical information
Type
East Seattle
Bellevue
Land area
217.1 sq. miles
30.7 sq. miles
Population density
2,361.6 people per sq. mile
4,860.3 people per sq. mile
Relative area comparison
East Seattle, WA Bellevue, WA
Education
Both East Seattle and Bellevue are known for their exceptional educational systems. Still, Bellevue often ranks a bit higher, particularly due to its public school system, regularly listed among the top in the nation. Bellevue also hosts several higher education campuses and offers proximity to the University of Washington.
Both cities have robust economies, but they offer distinct opportunities. Bellevue is a tech hub, hosting multiple high-tech companies, offering opportunities in the sector. East Seattle, while also having tech sector opportunities, has more diversity in employment, with sectors like healthcare, retail, and education also providing substantial employment.
Biggest Employers
Microsoft, T-Mobile, and Expedia are some of the largest employers in Bellevue. East Seattle, on the other hand, boasts employers such as Amazon, Starbucks, and the University of Washington. Both cities offer ample job opportunities, but in different industrials sectors.
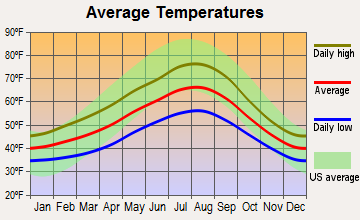
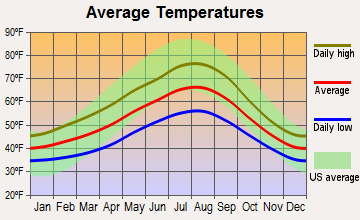
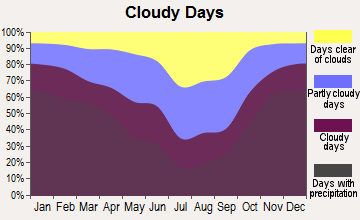
Weather
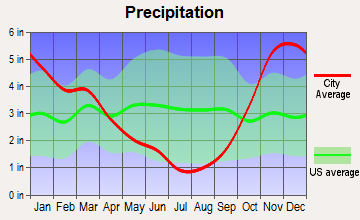
Bellevue and East Seattle share similar weather patterns as their geographical proximity impact their climates. They both experience mild winters and warm summers, though Bellevue may receive slightly less rainfall. Both cities may experience periodic fog due to their location near the Puget Sound, giving a mesmerizing ambiance that enhances the beauty of these cities.
Weather and climate
Type
East Seattle
Bellevue
Temperature - Average
52.5°F
52.5°F
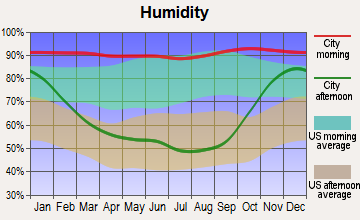
Humidity - Average morning or afternoon humidity
78.5%
78.5%
Humidity - Differences between morning and afternoon humidity
38%
38%
Humidity - Maximum monthly morning or afternoon humidity
86%
86%
Humidity - Minimum monthly morning or afternoon humidity
48%
48%
Precipitation - Yearly average
36.8 in
37 in
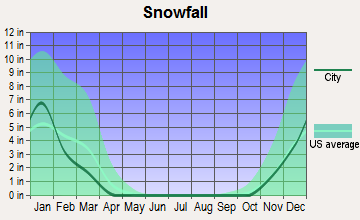
Snowfall - Yearly average
21.4 in
21.5 in
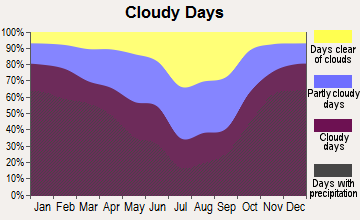
Clouds - Number of days clear of clouds
11.7%
11.7%
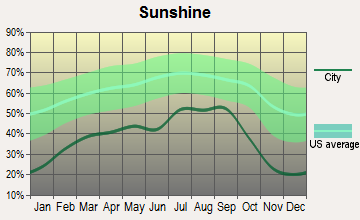
Sunshine amount - Average
49.4%
49.4%
Sunshine amount - Differences during a year
44%
44%
Sunshine amount - Maximum monthly
64%
64%
Sunshine amount - Minimum monthly
20%
20%
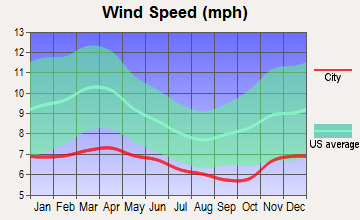
Wind speed - Average
8.6 mph
8.5 mph
Average climate in East Seattle, Washington
Average climate in Bellevue, Washington
Air pollution
Type
AQI
CO
NO2
OZONE
PB
PM10
PM25
SO2
Year
East Seattle
Bellevue
East Seattle
Bellevue
East Seattle
Bellevue
East Seattle
Bellevue
East Seattle
Bellevue
East Seattle
Bellevue
East Seattle
Bellevue
East Seattle
Bellevue
2018
85
85
0.21
0.21
10.6
10.6
21.0
21.1
N/A
N/A
N/A
N/A
5.1
3.4
0.7
0.7
2017
100
100
0.23
0.23
11.1
11.1
21.2
21.2
N/A
N/A
N/A
N/A
4.6
4.3
0.3
0.3
2016
67
67
0.22
0.22
11.9
11.9
20.2
20.2
N/A
N/A
N/A
N/A
3.8
3.5
0.6
0.6
2015
88
88
0.23
0.23
10.8
10.8
19.4
19.4
N/A
N/A
N/A
N/A
5.6
5.2
0.8
0.8
2014
75
75
0.24
0.24
11.5
11.5
19.5
19.5
N/A
N/A
N/A
N/A
5.7
5.5
N/A
N/A
2013
81
81
0.24
0.24
N/A
N/A
17.2
17.1
N/A
N/A
N/A
N/A
5.9
4.8
0.8
0.8
2012
83
83
0.23
0.23
N/A
N/A
19.3
19.2
N/A
N/A
N/A
N/A
5.2
4.8
1.0
1.0
2011
73
73
0.24
0.24
N/A
N/A
18.6
18.6
N/A
N/A
N/A
N/A
5.2
4.8
1.1
1.1
2010
73
73
0.24
0.24
N/A
N/A
18.0
18.0
N/A
N/A
N/A
N/A
4.4
4.1
1.1
1.1
2009
94
94
0.27
0.27
N/A
N/A
18.3
18.3
N/A
N/A
N/A
N/A
6.0
5.4
1.4
1.4
2008
80
80
0.30
0.30
N/A
N/A
17.8
17.8
N/A
N/A
N/A
N/A
5.4
5.1
1.3
1.3
2007
85
85
0.30
0.30
N/A
N/A
17.7
17.6
N/A
N/A
19.0
18.9
6.4
5.9
1.5
1.5
2006
102
102
N/A
N/A
N/A
N/A
18.4
18.4
N/A
N/A
21.1
21.0
7.2
6.9
N/A
N/A
2005
104
104
0.80
0.78
18.3
18.3
N/A
N/A
N/A
N/A
22.9
22.7
7.6
7.0
3.5
3.5
2004
110
110
0.81
0.78
17.9
17.9
N/A
N/A
N/A
N/A
N/A
N/A
8.3
7.7
3.0
3.0
2003
100
100
0.85
0.83
18.5
18.5
N/A
N/A
N/A
N/A
N/A
N/A
8.3
7.9
2.4
2.4
2002
90
90
1.07
1.10
19.3
19.3
N/A
N/A
N/A
N/A
N/A
N/A
10.7
10.8
2.7
2.7
2001
91
91
1.08
1.10
20.5
20.5
N/A
N/A
0.004
0.004
N/A
N/A
11.1
11.2
3.7
3.7
2000
99
99
1.21
1.23
20.9
20.9
N/A
N/A
N/A
N/A
N/A
N/A
12.1
12.1
3.2
3.2
Natural disasters
Type
East Seattle
Bellevue
Tornado activity compared to U.S. average
5.5%
5.5%
Earthquake activity compared to U.S. average
1,403%
1,407.6%
Natural disasters compared to U.S. average
30%
30%
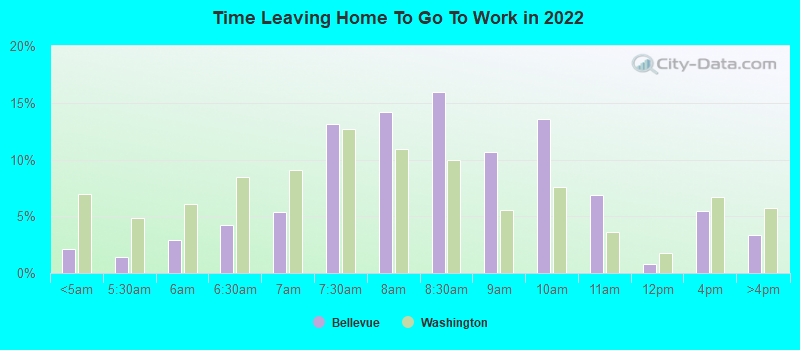
Transportation
East Seattle and Bellevue both offer good public transportation options, including buses and light rail. However, traffic can be heavy, especially during peak hours. While the commute might be slightly longer in East Seattle, it does have more public transit options than Bellevue.
Transport
Type
East Seattle
Bellevue
Amtrak stations nearby
3
2
FAA registered aircraft
0
238
FAA registered aircraft manufacturers and dealers
0
14
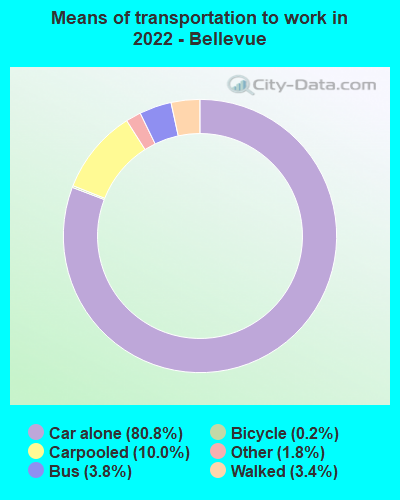
Means of transportation to work
Type
East Seattle
Bellevue
Bicycle
0.3%
1.1%
Bus
5%
3.2%
Carpooled
11%
8.5%
Car alone
76.3%
82.7%
Motorcycle
0.1%
0.1%
Walked
1.7%
2.6%
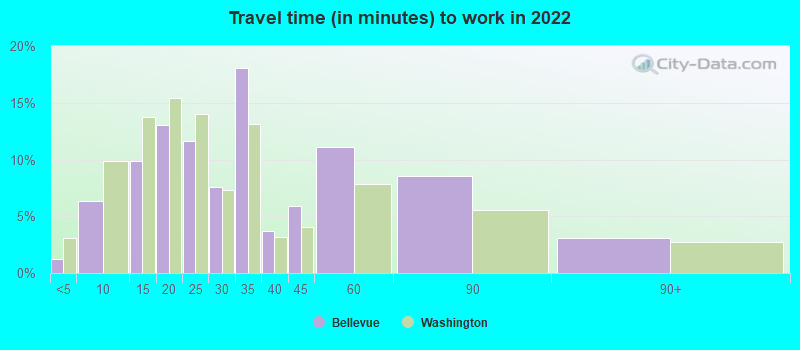
Average travel time to work
Type
East Seattle
Bellevue
Average
25 min
32.5 min
Real Estate
Real estate is significantly more expensive in Bellevue compared to East Seattle. The demand is high in both cities, but Bellevue, with its upscale image and concentration of high-income jobs, sees higher prices. East Seattle, while offering more affordable options, is also experiencing price increases due to the growing demand.
Neighborhoods
Both Bellevue and East Seattle boast a range of neighborhoods from urban to suburban, each with its unique characteristics. Bellevue is known for its upscale, manicured neighborhoods, while East Seattle has a more eclectic mix, with each neighborhood having its unique charm and character.
Houses and residents
Type
East Seattle
Bellevue
Houses
199,933
65,120
Average household size (people)
2.5
2.4
Houses occupied
191,630 (95.8%)
61,440 (94.3%)
Houses occupied by owners
128,209 (66.9%)
32,296 (52.6%)
Houses occupied by renters
63,421 (33.1%)
29,144 (47.4%)
Median rent asked for vacant for-rent units
$2,281
$3,990
Median price asked for vacant for-sale houses and condos
$820,468
$928,504
Estimated median house or condo value
$877,325
Over $1,000,000
Median number of rooms in apartments
3.5
3.3
Median number of rooms in houses and condos
7.8
7.3
Housing density (houses/condos per square mile)
920.9
2,117.9
Household income disparities
34.9%
36.3%
Housing units without a mortgage
22,582 (20.8%)
676 (3.4%)
Housing units with both a second mortgage and home equity loan
352 (0.3%)
1,494 (7.6%)
Housing units with a mortgage
85,751 (79.2%)
19,020 (96.6%)
Housing units with a home equity loan
11,674 (10.8%)
43 (0.2%)
Housing units with a second mortgage
9,796 (9%)
1,911 (9.7%)
Housing units lacking complete kitchen facilities
0.8%
0.8%
Housing units lacking complete plumbing facilities
Self-employed workers in own not incorporated business
16,907
4,294
State government workers
10,270
1,883
Unpaid family workers
584
141
Industries and Occupations
East Seattle offers a diverse range of industries including healthcare, education, and retail. Bellevue, is predominantly focused on technology with Microsoft’s headquarters and many tech startups located here. Both cities offer a robust job market, but Bellevue tends to skew towards higher-paying tech jobs.
Health Care
Bellevue is served by Overlake Hospital, one of the top hospitals in the region, while East Seattle residents predominantly rely on Seattle's prominent healthcare facilities, including the University of Washington Medical Center.
Infrastructure
Bellevue has newer infrastructure compared to East Seattle, providing a more modern city experience. This includes newer schools, community centers, and public buildings. It also extends to some public services and utilities. However, both cities continue to invest in infrastructure, including efforts to become more sustainable and eco-friendly.
Infrastructure
Type
East Seattle
Bellevue
TV stations
16
16
Schools
School facilities
Type
East Seattle
Bellevue
Private elementary/middle schools
1
18
Private high schools
1
5
Public elementary/middle schools
2
23
Public high schools
2
8
Colleges/Universities
0
2
Culture and Food
While both cities offer a diverse range of food and culture, East Seattle features a more diverse culinary scene reflecting its rich cultural diversity. Bellevue, while not as diverse, offers numerous high-end dining and shopping experiences.
Sports Teams
Bellevue has no major sports teams of its own, but due to its proximity to Seattle, residents and visitors can easily access the city's sports culture. East Seattle, being part of the larger Seattle area, offers easy access to major sports teams such as the Seattle Seahawks, Mariners, and Sounders.
 East Seattle, WA
 Bellevue, WA