El Paso, Texas, and Albuquerque, New Mexico, both offer unique living experiences, but they differ when it comes to various factors. These include crime and safety rates, weather patterns, cost of living, educational opportunities, economic stability, city infrastructure, predominant industries, employment opportunities, real-estate scenarios, neighborhood characteristics, commuting options, tax obligations, cultural and culinary experiences, sports teams, geographical landscapes, and healthcare facilities. Both cities have their own set of advantages and challenges, which are important to understand for potential residents or tourists.
Distance between
El Paso, TX and
Albuquerque, NM : 229.7 miles
El Paso's population is larger by 21%. Its population has grown by 114,753 people (20.4%) since 2000. The population of Albuquerque has grown by 113,992 people (25.4%) during that time.
Both El Paso and Albuquerque have crime rates that are higher than the national average. However, El Paso is often cited as one of the safest cities in the country. Albuquerque's crime rates, particularly related to property crime, are notably higher than both the national and state averages. As potential residents or tourists, security considerations would likely weigh more favorably for El Paso.
City-data.com crime index counts serious crimes and violent crime more heavily. It adjusts for the number of visitors and daily workers commuting into cities. (higher means more crime, U.S. average = 301.1)
City-data.com crime index counts serious crimes and violent crime more heavily. It adjusts for the number of visitors and daily workers commuting into cities. (higher means more crime, U.S. average = 301.1)
Sex Offenders
According to our data, there are 1,268 registered sex offenders living in El Paso and 849 registered sex offenders living in . The ratio of residents to sex offenders in El Paso is 539 to 1; the ratio in Albuquerque is 659 to 1. The number of registered sex offenders compared to the number of residents in El Paso is near to than in Albuquerque.
Cost of Living
The cost of living in El Paso is substantially lower than in Albuquerque. This applies to various expenses, such as housing, grocery shopping, and healthcare. This affordable living standard could potentially appeal to those considering relocating or visiting El Paso.
Income Tax
Residents of Albuquerque must pay state income tax while residents of El Paso do not. This feature may be a significant financial incentive for those considering relocating to El Paso.
Property Tax
Property taxes in El Paso are significantly higher than in Albuquerque, which could play a crucial role in the decision-making process for potential homeowners.
Sales Tax
Texas, and by extension El Paso, does not impose state income tax, but Albuquerque, in New Mexico, does. However, the sales tax rate in El Paso is higher than in Albuquerque.
Income
Type
El Paso
Albuquerque
Estimated median household income
$51,241
$58,512
Estimated per capita income
$25,670
$35,738
Cost of living index (U.S. average is 100)
82.2
93.6
If you make $50,000 in El Paso, you will have to make $56,934 in Albuquerque to maintain the same standard of living.
Geographical Conditions
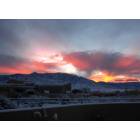
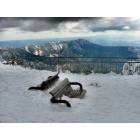
El Paso is essentially a desert city with the Franklin Mountains running through it. Albuquerque, located higher in elevation, is nestled between the Rio Grande River and the Sandia Mountains, offering a range of outdoor activities.
Albuquerque offers more variety in terms of higher education with the University of New Mexico and Central New Mexico Community College. However, El Paso is home to the University of Texas at El Paso, providing quality education that braids both cities' affluence in cultural diversity into its programs.
El Paso's economy is anchored on sectors like manufacturing and healthcare, while Albuquerque's economy is diversified with sectors like technology, healthcare, and film production playing significant roles. Both cities have seen job growth, but El Paso has a lower unemployment rate.
Biggest Employers
In El Paso, the biggest employers include the University Medical Center of El Paso and the El Paso Independent School District. Albuquerque's largest employers include the University of New Mexico and Sandia National Laboratories.
There were 1,961 building permits issued in El Paso in 2012 (1005 less than in 2011) compared to 773 building permits issued in Albuquerque in 2012 (19 more than in 2011).
In El Paso (El Paso County), 65.5% voted for Democrats and 33.2% for Republicans in 2012 Presidential Election. In Albuquerque (Bernalillo County), 55.8% voted for Democrats and 39.4% for Republicans.
Elections
Type
Democrats
Republicans
Other
Year
El Paso
Albuquerque
El Paso
Albuquerque
El Paso
Albuquerque
2020
66.8%
61.3%
31.6%
36.7%
1.6%
2.0%
2016
69.1%
52.4%
26.0%
34.6%
4.9%
13.0%
2012
65.5%
55.8%
33.2%
39.4%
1.3%
4.9%
2008
66.0%
60.2%
33.4%
38.8%
0.6%
1.0%
2004
56.2%
51.6%
43.3%
47.4%
0.5%
0.9%
2000
57.9%
48.8%
39.8%
46.8%
2.3%
4.4%
1996
62.3%
48.3%
32.1%
43.2%
5.6%
8.5%
Breakdown of population affiliated with a religious congregation
Type
Adherents
Congregations
Religion
El Paso
Albuquerque
El Paso
Albuquerque
CATHOLIC CHURCH
43.2%
26.5%
11.3%
10.7%
SOUTHERN BAPTIST CONVENTION
3.3%
2.6%
26.6%
11.4%
SEVENTH DAY ADVENTIST CHURCH
0.3%
0.4%
1.6%
1.9%
LUTHERAN CHURCH
0.2%
0.3%
1.0%
1.7%
EPISCOPAL CHURCH
0.1%
0.7%
1.0%
1.9%
EVANGELICAL LUTHERAN CHURCH IN AMERICA
0.1%
0.4%
1.0%
1.9%
CUMBERLAND PRESBYTERIAN CHURCH
0.0%
0.4%
0.4%
0.2%
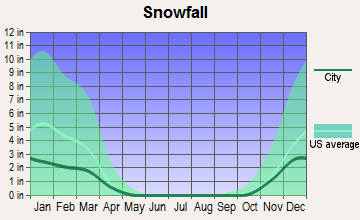
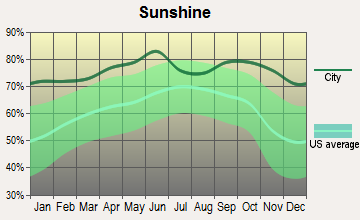
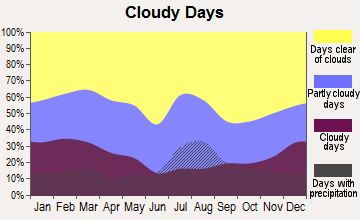
Weather
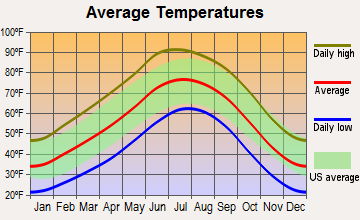
El Paso, situated in a desert, gets more sun and less rainfall than Albuquerque. The summer in El Paso is hotter, whereas Albuquerque experiences a colder winter due to its higher elevation. Both cities can offer fantastic sunsets and are suitable for people who enjoy a dry climate.
Weather and climate
Type
El Paso
Albuquerque
Temperature - Average
64.6°F
55.6°F
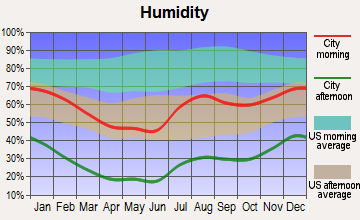
Humidity - Average morning or afternoon humidity
42.7%
44.3%
Humidity - Differences between morning and afternoon humidity
42.8%
46%
Humidity - Maximum monthly morning or afternoon humidity
59.8%
63%
Humidity - Minimum monthly morning or afternoon humidity
17%
17%
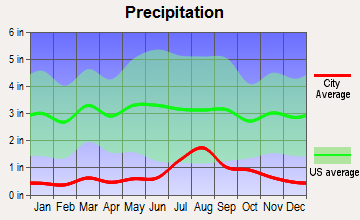
Precipitation - Yearly average
9.4 in
9.4 in
Snowfall - Yearly average
10.7 in
19.2 in
Clouds - Number of days clear of clouds
31.8%
27.8%
Sunshine amount - Average
89.4%
82.7%
Sunshine amount - Differences during a year
13.9%
9%
Sunshine amount - Maximum monthly
89.3%
82%
Sunshine amount - Minimum monthly
75.4%
73%
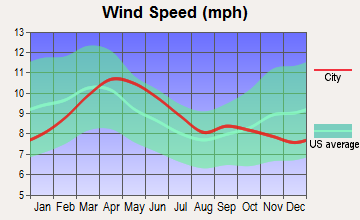
Wind speed - Average
8.9 mph
8.9 mph
Average climate in El Paso, Texas
Average climate in Albuquerque, New Mexico
Air pollution
Type
AQI
CO
NO2
OZONE
PB
PM10
PM25
SO2
Year
El Paso
Albuquerque
El Paso
Albuquerque
El Paso
Albuquerque
El Paso
Albuquerque
El Paso
Albuquerque
El Paso
Albuquerque
El Paso
Albuquerque
El Paso
Albuquerque
2018
139
95
0.17
0.23
14.0
10.3
32.0
35.3
N/A
N/A
35.7
20.3
9.2
4.3
N/A
0.5
2017
173
82
0.19
0.24
13.0
10.4
30.5
33.5
N/A
N/A
40.4
18.4
9.5
5.7
0.5
0.4
2016
148
86
0.17
0.22
12.6
10.4
30.6
33.2
N/A
N/A
35.2
16.0
9.2
5.3
0.5
0.8
2015
112
84
0.18
0.23
12.7
11.2
30.8
30.8
N/A
N/A
31.2
16.0
8.0
6.1
0.5
0.7
2014
157
89
0.13
0.22
12.8
11.7
30.0
31.8
N/A
N/A
40.3
22.0
9.7
6.1
0.4
0.6
2013
211
91
0.23
0.22
14.1
11.8
30.5
34.1
N/A
N/A
43.9
21.8
10.8
5.7
0.4
0.8
2012
229
116
0.30
0.18
15.9
13.7
31.6
33.6
N/A
N/A
40.2
26.6
11.6
9.3
0.4
0.7
2011
221
130
0.23
0.21
15.9
13.5
31.2
34.0
N/A
N/A
34.7
28.6
11.6
9.9
0.5
0.4
2010
211
92
0.25
0.15
15.3
12.2
29.4
32.1
N/A
N/A
28.8
25.1
7.9
6.8
0.3
N/A
2009
117
81
0.23
0.16
15.4
12.5
29.5
30.4
N/A
N/A
28.6
26.2
8.3
6.9
0.3
N/A
2008
210
91
0.25
0.21
15.2
11.8
30.1
31.5
0.017
N/A
34.6
20.8
9.7
6.5
0.6
N/A
2007
134
112
0.28
0.29
13.9
13.0
30.6
31.4
0.019
N/A
40.5
19.7
8.4
6.7
0.4
N/A
2006
241
103
0.37
0.33
14.3
14.2
30.6
31.8
0.018
N/A
55.0
21.1
11.1
N/A
0.3
N/A
2005
159
85
0.43
0.32
13.1
13.9
29.6
29.7
0.013
N/A
44.5
20.0
9.6
N/A
0.6
N/A
2004
183
89
0.38
0.32
13.5
16.6
29.2
29.8
0.020
0.003
47.3
21.5
8.2
N/A
0.4
N/A
2003
278
115
0.46
0.37
15.5
17.6
29.5
31.9
0.039
0.004
60.4
25.1
10.8
N/A
0.6
N/A
2002
203
91
0.43
0.43
16.4
18.9
30.5
29.1
0.034
0.005
53.3
23.1
11.0
N/A
0.4
N/A
2001
139
81
0.51
0.67
15.5
17.2
28.7
29.4
0.046
N/A
N/A
20.9
9.8
N/A
0.7
N/A
2000
145
95
0.67
0.81
17.8
17.0
27.8
27.9
0.072
N/A
N/A
17.7
9.1
N/A
1.0
N/A
Natural disasters
Type
El Paso
Albuquerque
Tornado activity compared to U.S. average
4.2%
6.4%
Earthquake activity compared to U.S. average
524.4%
802.6%
Natural disasters compared to U.S. average
11%
9%
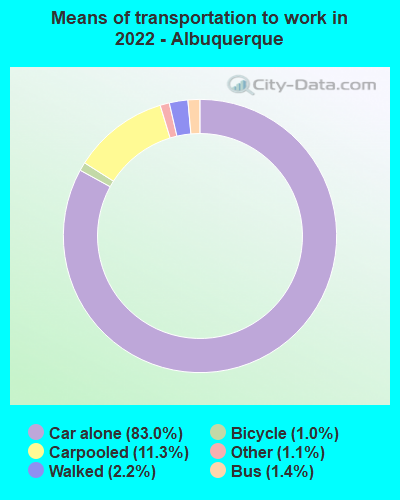
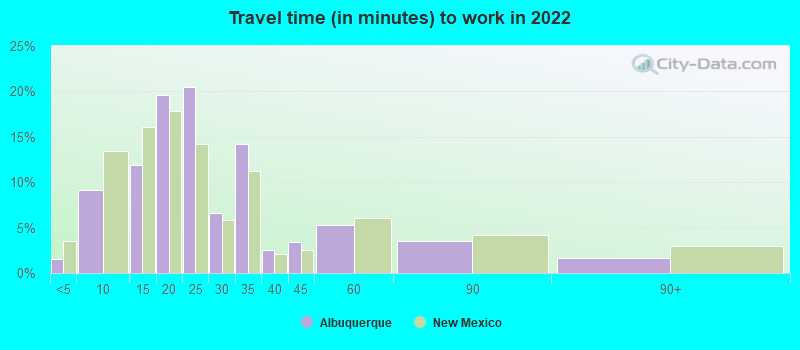
Transportation
Both cities have comprehensive bus systems. Albuquerque also offers a rail service, but El Paso does not. The average commute time is shorter in El Paso when compared to Albuquerque, making it a slightly more commuter-friendly city.
Transport
Type
El Paso
Albuquerque
Amtrak stations
1
1
Amtrak stations nearby
1
1
FAA registered aircraft
331
1
FAA registered aircraft manufacturers and dealers
6
17
Means of transportation to work
Type
El Paso
Albuquerque
Bicycle
0.3%
0.9%
Bus
1.3%
0.8%
Carpooled
11.2%
9.6%
Car alone
83.4%
85.1%
Motorcycle
0.2%
0.2%
Walked
1.6%
2.3%
Average travel time to work
Type
El Paso
Albuquerque
Average
25.1 min
24.5 min
Other means
22.2 min
20.8 min
Public transportation
46.4 min
37.8 min
Private vehicle occupancy
Type
El Paso
Albuquerque
Average
1.2
1.1
Drove alone
88.5%
91.6%
In 2 person carpool
7.9%
6.6%
In 3 person carpool
2.1%
1.2%
In 4 person carpool
0.7%
0.3%
In 5-6 person carpool
0.7%
0.1%
In 7+ person carpool
0.1%
0.2%
How many people usually rode to work in the car, truck or van.
Real Estate
Housing values in El Paso are markedly lower than in Albuquerque. However, both cities have seen a positive trend in real estate with an increase in property values over recent years, suggesting a promising investment environment.
Neighborhoods
El Paso's neighborhoods are primarily residential and known for their low crime rates, while neighborhoods in Albuquerque display a broader mix of residential, commercial, and industrial areas. Albuquerque offers more urban-intensive living with its downtown area.
Houses and residents
Type
El Paso
Albuquerque
Houses
261,779
256,814
Average household size (people)
3
2.4
Median year apartment built
1982
1983
Median year house/condo built
1985
1984
Length of stay in the house since moving in
14.7 years
12.6 years
Houses occupied
242,529 (92.6%)
243,582 (94.8%)
Houses occupied by owners
147,788 (60.9%)
147,964 (60.7%)
Houses occupied by renters
94,741 (39.1%)
95,618 (39.3%)
Median rent asked for vacant for-rent units
$570.82
$893.82
Median monthly housing costs
$939
$1,021
Median price asked for vacant for-sale houses and condos
$227,007
$171,149
Estimated median house or condo value
$152,800
$251,500
Median numbers of rooms
5.4
5.3
Median number of rooms in apartments
4.3
3.9
Median number of rooms in houses and condos
6.2
6.2
Median house price - detached houses
$187,761
$290,578
Median house price - in 2-unit structures
Over $1,000,000
$636,758
Median house price - in 3-to-4-unit structures
$75,782
$274,794
Median house price - in 5 or more unit structures
$266,003
$224,872
Median house price - mobile homes
$43,095
$52,392
Median house price - occupied boats, rvs, vans etc.
$9,296
$35,209
Median house price - Townhouses or other attached units
$149,459
$209,825
Median house price - All housing units
$186,951
$271,083
Median house age
38
38
Renting percentage
39.6%
39.7%
Housing density (houses/condos per square mile)
1,051
1,421.7
House value disparities
32.7%
29.8%
Household income disparities
46.6%
45.9%
Median household income for houses/condes with a mortgage
$74,665
$87,851
Median household income for apartments without a mortgage
$52,954
$63,195
Housing units without a mortgage
1,889 (2.2%)
1,631 (1.6%)
Housing units with both a second mortgage and home equity loan
2,956 (3.4%)
3,560 (3.6%)
Housing units with a mortgage
84,973 (97.8%)
97,744 (98.4%)
Housing units with a home equity loan
250 (0.3%)
309 (0.3%)
Housing units with a second mortgage
3,635 (4.2%)
6,864 (6.9%)
House/condo owner moved in on average (years ago)
14
11
House/condo renter moved in on average (years ago)
1
1
Housing units lacking complete kitchen facilities
2%
1.1%
Housing units lacking complete plumbing facilities
2%
0.3%
Housing units in structures
Housing units in structures
El Paso
Albuquerque
One, detached
67.7%
61.4%
One, attached
4.4%
6.6%
Two
2.4%
1.0%
3 or 4
4.1%
6.1%
5 to 9
5.9%
4.7%
10 to 19
5.8%
4.7%
20 to 49
2.4%
4.8%
50 or more
4.8%
6.3%
Mobile homes
2.3%
4.2%
Boats, RVs, vans, etc.
0.2%
0.0%
Median real estate property taxes paid for housing units
Self-employed workers in own not incorporated business
19,650
14,060
State government workers
12,525
20,531
Unpaid family workers
901
359
Industries and Occupations
The major industries in El Paso include manufacturing, defense, and healthcare services, whereas Albuquerque has a strong presence of tech companies, film production, and healthcare services. The respective cities attract professionals pertinent to these industries.
While both cities offer comprehensive healthcare services, El Paso is renowned for its hospitals like Providence Memorial and Las Palmas. In contrast, Albuquerque is home to the University of New Mexico Hospital, a reputed medical institution.
Health (county statistics)
Type
El Paso
Albuquerque
General health status score of residents in this county from 1 (poor) to 5 (excellent)
Albuquerque is home to an international airport, a rail system, and a bus transit system. El Paso also features an international airport and a bus system, without a rail system. The infrastructure of both cities supports active commercial and tourist activities.
Infrastructure
Type
El Paso
Albuquerque
Hospitals
41
36
TV stations
10
18
Arenas or stadiums
2
1
Bank branches located here
89
137
Bank institutions located here
19
24
Main business address for public companies
7
8
Drinking water stations with no reported violations in the past
0
7
Drinking water stations with reported violations in the past
HMDA - Conventional home purchase loans - Applications denied
Year
El Paso
Albuquerque
1999
1,994
2,651
2000
993
1,303
2001
704
752
2002
594
693
2003
1,268
1,022
2004
1,646
1,729
2005
2,316
2,199
2006
2,701
2,639
2007
2,051
1,575
2008
1,034
654
2009
454
368
Culture and Food
Both cities have rich Hispanic cultures and cuisines. Albuquerque is known for its annual International Balloon Fiesta and New Mexican cuisine, while El Paso offers a unique blend of Mexican and Texas culinary traditions along with being called "Sun City" due to its number of sunny days.
Sports Teams
Albuquerque hosts a AAA minor league baseball team, the Albuquerque Isotopes. El Paso hosts the El Paso Chihuahuas, a AAA minor league baseball team, and El Paso Locomotive FC, a USL Championship soccer team.


 El Paso, TX
 Albuquerque, NM