El Paso, TX vs Omaha, NE - Advanced U.S. city comparison tool

El Paso, TX vs Omaha, NE

El Paso, Texas, and Omaha, Nebraska are unique cities, each with their attributes that attract residents and tourists alike. El Paso, located at the border of Mexico and the US, boasts a rich Hispanic culture, warm weather, and low cost of living. Omaha, nestled in the Midwest, is noted for its stable economy, low unemployment rate, and a small-town feel in a large metropolitan area. This comparison will help those considering relocation or a trip to these cities understand their dynamics better.
 
 
Distance between El Paso, TX and Omaha, NE : 871.7 miles

El Paso's population is larger by 39%. Its population has grown by 114,753 people (20.4%) since 2000. The population of Omaha has grown by 97,293 people (24.9%) during that time.

Population
Type El Paso Omaha
Population 678,415 487,300
Female / male percentage 50.7% / 49.3%
50.7%
49.3%
50.2% / 49.8%
50.2%
49.8%
Racial makeup - percentage
Ethnicity El PasoOmaha
Hispanic 82.0% 15.0%
White Non-Hispanic 11.5% 64.5%
Black 3.1% 11.4%
Two or more 1.6% 4.3%
Asian 1.2% 3.9%
American Indian 0.2% 0.2%
Racial makeup - absolute values
Ethnicity El PasoOmaha
Hispanic 556,625 73,189
White Non-Hispanic 78,203 314,231
Black 20,772 55,510
Two or more 10,877 21,052
Asian 8,252 19,209
American Indian 1,210 866
Pacific Islander 136 89

Crime and Safety

El Paso is nationally recognized as one of the safest large cities in the US. Its crime rate is much lower than the national average, making it very appealing for families. On the other hand, Omaha has a slightly higher crime rate than the national average. It's not considered dangerous, but neighborhoods vary and some crime hotspots exist.

Crime by year per 100,000 residents
Type City-data.com crime indexRobberies per 100,000Murders per 100,000Rapes per 100,000Assaults per 100,000Burglaries per 100,000Theft per 100,000Auto theft per 100,000Arson per 100,000
Year El PasoOmahaEl PasoOmahaEl PasoOmahaEl PasoOmahaEl PasoOmahaEl PasoOmahaEl PasoOmahaEl PasoOmahaEl PasoOmaha
2020 153.5 355.3 42.2 96.6 4.1 7.7 38.1 73.1 231.9 453.9 123.6 316.7 1,057.2 2,227.2 60.6 630.7 2.0 0.0
2019 187.0 374.0 49.2 110.3 5.8 4.9 47.9 80.6 255.7 417.0 154.3 357.9 1,256.6 2,615.8 125.9 670.2 4.2 0.0
2018 190.8 359.1 54.6 97.2 3.3 4.7 58.8 85.9 254.2 372.2 160.8 393.7 1,226.1 2,416.7 118.7 665.4 3.8 0.0
2017 201.9 410.8 58.1 139.1 2.8 6.9 53.9 91.2 264.1 410.1 188.3 464.6 1,514.4 2,636.7 116.2 778.8 5.5 2.2
2016 199.7 364.7 69.3 136.7 2.5 6.5 45.7 54.9 272.8 369.1 205.2 473.1 1,474.8 2,593.4 118.2 700.4 7.1 14.1
2015 199.3 340.3 59.8 144.8 2.5 10.6 46.9 38.5 257.4 321.1 206.8 477.6 1,591.1 2,555.7 116.3 562.3 8.3 17.9
2014 217.2 389.4 61.0 164.9 3.1 7.3 49.2 41.1 279.3 347.3 232.1 683.5 1,789.0 2,944.4 120.7 717.5 7.1 8.4
2013 203.2 409.4 67.2 168.9 1.5 9.9 25.9 43.3 276.4 354.1 260.6 825.5 1,911.6 2,945.1 116.8 724.6 10.7 19.5
2012 226.2 416.5 69.7 195.0 3.4 9.8 27.2 44.7 322.9 345.0 270.3 792.2 1,987.3 3,139.0 171.7 657.2 13.9 17.5
2011 232.9 411.3 70.0 168.7 2.4 10.4 32.7 53.3 326.1 327.2 280.5 804.9 1,961.0 3,100.5 219.7 642.3 18.1 22.1
2010 239.3 387.3 73.8 176.8 0.8 8.3 27.6 50.1 338.6 320.8 300.9 744.8 2,141.2 2,956.5 239.1 537.2 15.6 29.1
2009 261.5 371.2 73.0 201.3 1.9 6.8 29.4 43.3 352.9 281.9 321.7 728.6 2,367.0 2,920.3 305.4 479.6 17.8 29.6
2008 279.3 404.3 74.5 217.0 2.8 10.1 29.6 41.2 354.5 337.3 339.5 726.1 2,428.3 2,948.5 449.6 623.2 19.3 0.0
2007 279.5 428.5 76.6 189.4 2.8 9.7 41.9 43.8 296.6 354.1 348.8 774.6 2,361.1 3,213.5 491.5 795.7 13.1 0.0
2006 288.5 446.7 81.7 203.5 2.1 7.9 48.7 44.9 260.9 344.8 360.7 761.1 2,436.2 3,640.4 573.8 826.1 15.1 0.0
2005 246.3 380.1 74.4 165.5 2.3 7.5 50.0 48.3 308.7 343.3 358.2 767.7 2,493.2 3,658.8 433.0 925.2 26.8 33.5
2004 262.2 398.4 96.0 202.9 1.9 4.9 33.8 46.0 414.2 388.3 387.9 896.6 2,812.1 3,814.2 309.8 838.4 33.7 36.9
2003 282.6 432.1 99.1 223.1 3.6 8.7 37.3 44.6 457.2 377.7 372.6 858.6 3,024.4 4,199.5 317.2 1,044.1 20.0 52.3

City-data.com crime index counts serious crimes and violent crime more heavily. It adjusts for the number of visitors and daily workers commuting into cities. (higher means more crime, U.S. average = 301.1)


Crime per year
Type City-data.com crime indexRobberiesMurdersRapesAssaultsBurglariesTheftAuto theftArson
Year El PasoOmahaEl PasoOmahaEl PasoOmahaEl PasoOmahaEl PasoOmahaEl PasoOmahaEl PasoOmahaEl PasoOmahaEl PasoOmaha
2019 187.0 374.0 338 519 40 23 329 379 1,756 1,962 1,060 1,684 8,630 12,307 865 3,153 29 0
2018 190.8 359.1 376 456 23 22 405 403 1,750 1,747 1,107 1,848 8,441 11,343 817 3,123 26 0
2017 201.9 410.8 400 625 19 31 371 410 1,819 1,843 1,297 2,088 10,429 11,849 800 3,500 38 10
2016 199.7 364.7 476 610 17 29 314 245 1,875 1,647 1,410 2,111 10,135 11,571 812 3,125 49 63
2015 199.3 340.3 410 655 17 48 322 174 1,766 1,452 1,419 2,160 10,916 11,558 798 2,543 57 81
2014 217.2 389.4 415 723 21 32 335 180 1,900 1,523 1,579 2,997 12,170 12,910 821 3,146 48 37
2013 203.2 409.4 457 718 10 42 176 184 1,879 1,505 1,771 3,509 12,993 12,519 794 3,080 73 83
2012 226.2 416.5 471 815 23 41 184 187 2,181 1,442 1,826 3,311 13,425 13,120 1,160 2,747 94 73
2011 232.9 411.3 464 696 16 43 217 220 2,161 1,350 1,859 3,321 12,997 12,793 1,456 2,650 120 91
2010 239.3 387.3 479 723 5 34 179 205 2,198 1,312 1,953 3,046 13,899 12,091 1,552 2,197 101 119
2009 261.5 371.2 452 892 12 30 182 192 2,184 1,249 1,991 3,228 14,647 12,938 1,890 2,125 110 131
2008 279.3 404.3 456 949 17 44 181 180 2,171 1,475 2,079 3,175 14,870 12,892 2,753 2,725 118 0
2007 279.5 428.5 472 818 17 42 258 189 1,827 1,529 2,149 3,345 14,545 13,876 3,028 3,436 81 0
2006 288.5 446.7 503 848 13 33 300 187 1,606 1,437 2,220 3,172 14,996 15,172 3,532 3,443 93 0
2005 246.3 380.1 448 682 14 31 301 199 1,858 1,415 2,156 3,164 15,005 15,079 2,606 3,813 161 138
2004 262.2 398.4 570 824 11 20 201 187 2,460 1,577 2,304 3,641 16,702 15,490 1,840 3,405 200 150
2003 282.6 432.1 581 896 21 35 219 179 2,681 1,517 2,185 3,449 17,735 16,869 1,860 4,194 117 210

City-data.com crime index counts serious crimes and violent crime more heavily. It adjusts for the number of visitors and daily workers commuting into cities. (higher means more crime, U.S. average = 301.1)

Sex Offenders

According to our data, there are 1,274 registered sex offenders living in El Paso and 1,375 registered sex offenders living in .
The ratio of residents to sex offenders in El Paso is 536 to 1; the ratio in Omaha is 325 to 1.
The number of registered sex offenders compared to the number of residents is a smaller in El Paso than in Omaha.

Cost of Living

El Paso enjoys a relatively low cost of living compared to the national average. This benefits low and middle-class families. Omaha also has a low cost of living but is slightly higher than El Paso, primarily because of the higher housing costs.

Income Tax

In Texas, residents enjoy the privilege of having no city or state income tax. Nebraska, however, imposes a city tax for Omaha residents and a state income tax ranging from 2.46% to 6.84% based on income.

Property Tax

Property taxes in both cities are high compared to the national average. El Paso homeowners pay a median property tax of 2.13%, while Omaha residents pay 2% of the assessed home value.

Sales Tax

El Paso residents pay an 8.25% sales tax, while Omaha residents pay 7%. Texas doesn't have a state income tax, which may appeal to those with higher incomes. In contrast, Nebraska does levy a state income tax with rates ranging from 2.46% to 6.84%.
Income
Type El Paso Omaha
Estimated median household income $51,241 $62,948
Estimated per capita income $25,670 $38,062
Cost of living index (U.S. average is 100) 82.2 89.4

If you make $50,000 in El Paso, you will have to make $54,380 in Omaha to maintain the same standard of living.

Geographical Conditions

El Paso sits in the Chihuahuan Desert on the Rio Grande and features spectacular mountain views. Omaha is situated on the Missouri River and characterized by rolling hills, providing a rich agricultural landscape.
Geographical information
Type El Paso Omaha
Land area 249.1 sq. miles 115.7 sq. miles
Population density 2,723.7 people per sq. mile 4,211.6 people per sq. mile
Relative area comparison
El Paso, TX Omaha, NE
First ancestry reported - percentage
Ancestry El PasoOmaha
German 1.4% 16.9%
English 0.7% 3.5%
Irish 0.7% 5.4%
Italian 0.3% 2.2%
Polish 0.2% 2.0%
Danish 0.1% 0.9%
French 0.1% 0.5%
Norwegian 0.1% 1.1%
Scotch-Irish 0.1% 0.4%
Scottish 0.1% 0.8%
Czech 0.0% 1.8%
Dutch 0.0% 0.5%
Russian 0.0% 0.3%
Swedish 0.0% 1.2%
Population origin - absolute values
Ancestry El PasoOmaha
German 6,837 40,655
English 3,718 8,477
Irish 3,433 12,871
Italian 1,389 5,267
Polish 763 4,831
Scottish 696 1,838
French 527 1,171
Scotch-Irish 522 858
Danish 299 2,189
Norwegian 291 2,684
Russian 237 657
French Canadian 229 406
Dutch 195 1,298
Portuguese 186 32
Greek 170 447
Welsh 151 366
Czech 112 4,279
Hungarian 101 298
Swedish 80 2,980
West Indian 78 5
Foreign born residents - absolute values
Type Count
Region El PasoOmaha
All 160,130 53,164
Africa 1,963 7,353
Asia 6,694 16,357
Europe 3,584 3,323
Latin America 142,736 25,220
North America 419 821
Oceania 158 155
Foreign born residents - percentage
Type Percentage
Region El PasoOmaha
All 23.5% 10.8%
Africa 0.3% 1.5%
Asia 1.0% 3.3%
Europe 0.5% 0.7%
Latin America 20.9% 5.1%
North America 0.1% 0.2%

Education

El Paso's public education system is managed by several different school districts, the largest being the El Paso Independent School District. Omaha, on the other hand, is served by Omaha Public Schools and several private institutions. Both cities face educational challenges typical for urban areas, but they also feature programs to address these issues.
School enrollment
Type El Paso Omaha
Nursery, preschool 8,469 (4.5%) 7,769 (6.1%)
Kindergarten 8,714 (4.6%) 5,318 (4.2%)
Grade 1 to 4 37,359 (19.7%) 24,205 (18.9%)
Grade 5 to 8 41,735 (22.1%) 28,925 (22.6%)
Grade 9 to 12 42,053 (22.2%) 27,207 (21.2%)
College undergrad 40,542 (21.4%) 25,520 (19.9%)
Graduate or professional 10,335 (5.5%) 9,148 (7.1%)
Students in private schools - absolute values
Type Count
Grade El PasoOmaha
Grades 1 to 8 (elementary and middle school) 8,156 7,255
Grades 9 to 12 (high school) 2,433 4,608
Undergraduate colleges 4,538 8,503
Students in private schools - percentage
Type Percentage
Grade El PasoOmaha
Grades 1 to 8 (elementary and middle school) 10.3% 13.7%
Grades 9 to 12 (high school) 5.8% 16.9%
Undergraduate colleges 11.2% 33.3%
Educational attainment
Type El Paso Omaha
Less than high school 17.9% 8.8%
High school or equiv. 24.8% 22.6%
Less than 1 year of college 5.9% 6.9%
1 or more years of college 14.4% 15.2%
Associate degree 9% 8.4%
Bachelor's degree 19.5% 24.7%
Master's degree 6% 8.1%
Profess. school degree 1.6% 3.6%
Doctorate degree 0.9% 1.7%
Education level (25-year-olds and older)
Type El Paso Omaha
Bachelor's degree or higher 28% 38.1%
Graduate or professional degree 8.5% 13.4%
High school or higher 82.1% 91.2%

Work and Economy

Both cities exhibit diverse economies. El Paso's economy is largely driven by federal government jobs, education, and healthcare. Omaha, dubbed the "Silicon Prairie," has a strong economy with significant contributions from finance, insurance, and technology sectors.

Biggest Employers

In El Paso, the biggest employers are the US government and the local school districts. In Omaha, the five Fortune 500 companies headquartered there are among the city's largest employers - Berkshire Hathaway, Union Pacific Railroad, Mutual of Omaha, Kiewit Corporation, and TD Ameritrade.
Employment and residency - absolute values
Kind El PasoOmaha
Work and live in this city 182,077 170,544
Work and live in this county 276,305 215,308
Workers who work outside the city they live in 381,585 219,463
Workers who work outside the county they live in 18,231 34,981
Working at home 29,842 45,741
Not working at home 264,694 204,548
Daytime population change due to commuting 7,018 76,558
Employment and residency - percentage
Kind El PasoOmaha
Work and live in this city 87.5% 86.7%
Work and live in this county 93.8% 86.0%
Workers who work outside the city they live in 12.5% 13.3%
Workers who work outside the county they live in 6.2% 14.0%
Working at home 10.1% 18.3%
Not working at home 89.9% 81.7%
Daytime population change due to commuting 1.2% 19.6%
Geographical mobility: all
Type all
Mobility El PasoOmaha
Same house 1 year ago 86.0% 85.3%
Moved from abroad 0.9% 0.5%
Moved within same county 9.4% 9.2%
Moved from different state 2.2% 2.7%
Moved within same state 1.5% 2.2%
Geographical mobility: Asian
Type Asian
Mobility El PasoOmaha
Same house 1 year ago 74.0% 78.2%
Moved from abroad 0% 7.1%
Moved within same county 17.6% 10.4%
Moved from different state 2.3% 2.5%
Moved within same state 6.1% 1.8%
Geographical mobility: Black
Type Black
Mobility El PasoOmaha
Same house 1 year ago 83.3% 83.2%
Moved from abroad 1.1% 1.0%
Moved within same county 10.8% 13.4%
Moved from different state 4.0% 1.6%
Moved within same state 0.8% 0.7%
Geographical mobility: White
Type White
Mobility El PasoOmaha
Same house 1 year ago 83.0% 86.4%
Moved from abroad 0.6% 0.2%
Moved within same county 11.0% 8.1%
Moved from different state 2.6% 3.0%
Moved within same state 2.8% 2.3%
Building permits
Type Average valueCount
City El PasoOmahaEl PasoOmaha
1997 $49,700 $86,500 2,132 1,533
1998 $48,700 $97,800 2,873 1,623
1999 $52,400 $97,500 3,046 1,980
2000 $53,300 $93,800 2,589 2,008
2001 $55,500 $96,900 2,964 2,175
2002 $55,400 $115,700 3,180 2,282
2003 $60,000 $118,400 4,582 2,581
2004 $85,600 $119,300 2,720 2,646
2005 $122,100 $110,800 3,252 2,870
2006 $138,400 $110,800 2,903 1,879
2007 $151,900 $108,300 2,666 1,905
2008 $150,600 $105,100 2,521 1,576
2009 $162,300 $104,500 2,330 1,542
2010 $188,600 $132,800 2,478 1,191
2011 $150,600 $132,600 2,966 1,160
2012 $148,200 $142,000 2,815 1,305
2013 $160,000 $148,600 2,271 1,567
2014 $165,700 $149,300 2,021 1,306
2015 $167,100 $146,100 2,282 1,498
2016 $254,100 $137,900 2,014 1,427
2017 $220,600 $145,400 2,020 1,533
2018 $231,200 $147,700 1,588 1,237
2019 $241,400 $144,300 1,873 1,179
2020 $233,100 $144,800 1,570 1,686
2021 $235,800 $141,000 1,961 1,620

There were 1,961 building permits issued in El Paso in 2012 (1005 less than in 2011) compared to 1,620 building permits issued in Omaha in 2012 (460 more than in 2011).

In El Paso (El Paso County), 65.5% voted for Democrats and 33.2% for Republicans in 2012 Presidential Election. In Omaha (Douglas County), 47.5% voted for Democrats and 50.6% for Republicans.

Elections
Type DemocratsRepublicansOther
Year El PasoOmahaEl PasoOmahaEl PasoOmaha
2020 66.8% 54.4% 31.6% 43.1% 1.6% 2.5%
2016 69.1% 47.3% 26.0% 45.0% 4.9% 7.7%
2012 65.5% 47.5% 33.2% 50.6% 1.3% 1.9%
2008 66.0% 51.7% 33.4% 47.0% 0.6% 1.3%
2004 56.2% 40.4% 43.3% 58.6% 0.5% 1.0%
2000 57.9% 40.1% 39.8% 55.2% 2.3% 4.7%
1996 62.3% 39.3% 32.1% 51.4% 5.6% 9.3%
Breakdown of population affiliated with a religious congregation
Type AdherentsCongregations
Religion El PasoOmahaEl PasoOmaha
CATHOLIC CHURCH 43.2% 24.0% 11.3% 11.8%
SOUTHERN BAPTIST CONVENTION 3.3% 1.5% 26.6% 5.2%
SEVENTH DAY ADVENTIST CHURCH 0.3% 0.3% 1.6% 1.7%
LUTHERAN CHURCH 0.2% 2.5% 1.0% 4.3%
SALVATION ARMY 0.2% 0.4% 0.4% 0.9%
EPISCOPAL CHURCH 0.1% 0.5% 1.0% 1.4%
EVANGELICAL LUTHERAN CHURCH IN AMERICA 0.1% 4.1% 1.0% 6.6%
MUSLIM ESTIMATE 0.1% 0.9% 0.2% 0.7%

Weather

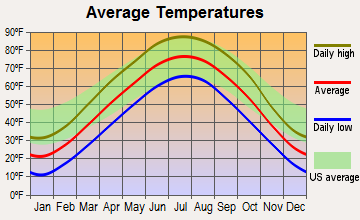
Weather is a significant contrast between the two cities. El Paso experiences a desert climate, with most days sunny and sweltering in summers and mild winters. Omaha, however, has a more temperate climate. It experiences all four seasons with hot, humid summers, and cold, snowy winters.
Weather and climate
Type El Paso Omaha
Temperature - Average 64.6°F 50.6°F
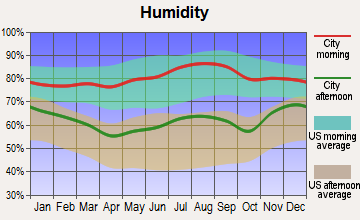
Humidity - Average morning or afternoon humidity 42.7% 75.9%
Humidity - Differences between morning and afternoon humidity 42.8% 35%
Humidity - Maximum monthly morning or afternoon humidity 59.8% 87%
Humidity - Minimum monthly morning or afternoon humidity 17% 52%
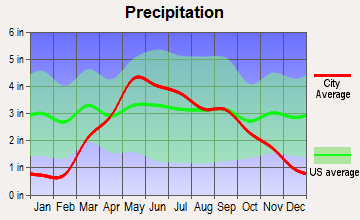
Precipitation - Yearly average 9.4 in 30 in
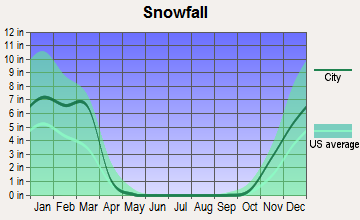
Snowfall - Yearly average 10.7 in 57.2 in
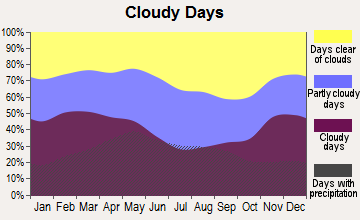
Clouds - Number of days clear of clouds 31.8% 18.4%
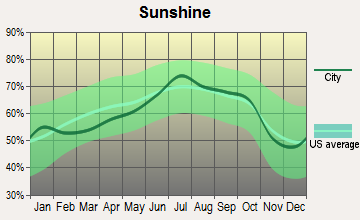
Sunshine amount - Average 89.4% 66.7%
Sunshine amount - Differences during a year 13.9% 27%
Sunshine amount - Maximum monthly 89.3% 74%
Sunshine amount - Minimum monthly 75.4% 47%
Wind speed - Average 8.9 mph 10.8 mph

Average climate in El Paso, Texas

Chicago, Illinois average temperatures Chicago, Illinois average precipitation Chicago, Illinois humidity Chicago, Illinois wind speed Chicago, Illinois snowfall Chicago, Illinois sunshine Chicago, Illinois clear and cloudy days
 

Average climate in Omaha, Nebraska

Chicago, Illinois average temperatures Chicago, Illinois average precipitation Chicago, Illinois humidity Chicago, Illinois wind speed Chicago, Illinois snowfall Chicago, Illinois sunshine Chicago, Illinois clear and cloudy days
 

Air pollution
Type AQICONO2OZONEPBPM10PM25SO2
Year El PasoOmahaEl PasoOmahaEl Paso El PasoOmahaEl PasoOmahaEl PasoOmahaEl PasoOmahaEl PasoOmaha
2018 139 75 0.17 0.18 14.0 N/A 32.0 26.7 N/A N/A 35.7 19.3 9.2 8.4 N/A 0.5
2017 173 76 0.19 0.19 13.0 N/A 30.5 26.3 N/A N/A 40.4 21.6 9.5 9.6 0.5 0.9
2016 148 80 0.17 0.18 12.6 N/A 30.6 26.3 N/A N/A 35.2 19.3 9.2 8.1 0.5 0.7
2015 112 79 0.18 0.20 12.7 N/A 30.8 26.9 N/A N/A 31.2 20.3 8.0 9.3 0.5 0.9
2014 157 80 0.13 0.23 12.8 N/A 30.0 27.9 N/A N/A 40.3 23.5 9.7 8.8 0.4 1.2
2013 211 79 0.23 0.20 14.1 N/A 30.5 28.0 N/A N/A 43.9 26.9 10.8 9.3 0.4 1.4
2012 229 100 0.30 0.21 15.9 N/A 31.6 27.1 N/A N/A 40.2 39.0 11.6 8.4 0.4 1.6
2011 221 96 0.23 0.21 15.9 N/A 31.2 25.4 N/A N/A 34.7 32.9 11.6 9.2 0.5 1.6
2010 211 102 0.25 N/A 15.3 N/A 29.4 28.0 N/A N/A 28.8 43.2 7.9 10.5 0.3 2.1
2009 117 73 0.23 N/A 15.4 N/A 29.5 24.3 N/A N/A 28.6 28.7 8.3 N/A 0.3 1.8
2008 210 104 0.25 N/A 15.2 N/A 30.1 26.9 0.017 N/A 34.6 45.0 9.7 18.9 0.6 1.1
2007 134 109 0.28 0.51 13.9 N/A 30.6 29.0 0.019 N/A 40.5 N/A 8.4 16.5 0.4 1.7
2006 241 86 0.37 0.50 14.3 N/A 30.6 30.0 0.018 N/A 55.0 N/A 11.1 13.0 0.3 1.3
2005 159 78 0.43 0.47 13.1 N/A 29.6 32.8 0.013 N/A 44.5 N/A 9.6 12.9 0.6 2.8
2004 183 51 0.38 0.44 13.5 N/A 29.2 30.9 0.020 N/A 47.3 N/A 8.2 N/A 0.4 1.5
2003 278 50 0.46 0.43 15.5 N/A 29.5 26.6 0.039 N/A 60.4 N/A 10.8 N/A 0.6 0.7
2002 203 48 0.43 0.38 16.4 N/A 30.5 27.6 0.034 0.030 53.3 N/A 11.0 N/A 0.4 1.1
2001 139 39 0.51 0.35 15.5 N/A 28.7 25.0 0.046 0.038 N/A N/A 9.8 N/A 0.7 0.4
2000 145 44 0.67 0.50 17.8 N/A 27.8 26.1 0.072 0.049 N/A N/A 9.1 N/A 1.0 0.5
Natural disasters
Type El Paso Omaha
Tornado activity compared to U.S. average 4.2% 191.9%
Earthquake activity compared to U.S. average 524.4% 415.1%
Natural disasters compared to U.S. average 11% 21%

Transportation

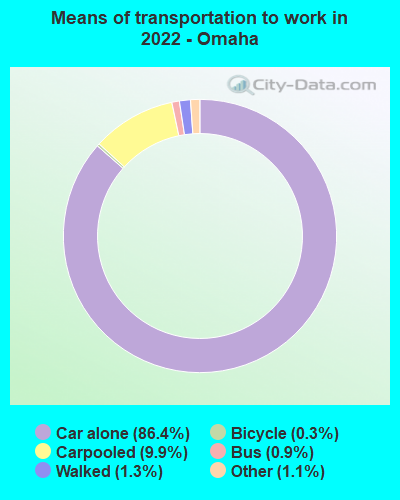
In both cities, most residents rely on personal vehicles for transportation. Both cities' public transit systems are not robust, but El Paso also offers a new streetcar system linking downtown with the University of Texas at El Paso.
Transport
Type El Paso Omaha
Amtrak stations 1 1
Amtrak stations nearby 1 1
FAA registered aircraft 331 405
FAA registered aircraft manufacturers and dealers 6 24
Means of transportation to work
Type El Paso Omaha
Bicycle 0.3% 0.2%
Bus 1.3% 0.7%
Carpooled 11.2% 8.2%
Car alone 83.4% 87.8%
Motorcycle 0.2% 0.1%
Walked 1.6% 2%
Means of transportation to work
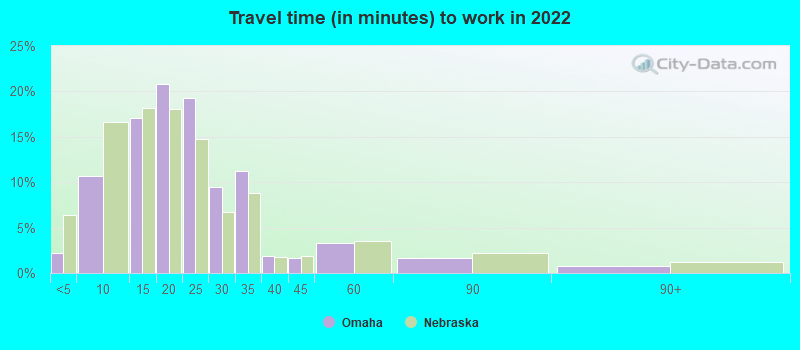
Average travel time to work
Type El Paso Omaha
Average 25.1 min 22.5 min
Other means 22.2 min 18.8 min
Public transportation 46.4 min 39 min
Travel time to work
Time leaving to work
Travel time to work
Time leaving to work
Private vehicle occupancy
Type El Paso Omaha
Average 1.2 1.1
Drove alone 88.5% 90.4%
In 2 person carpool 7.9% 6.9%
In 3 person carpool 2.1% 1.4%
In 4 person carpool 0.7% 0.7%
In 5-6 person carpool 0.7% 0.6%

How many people usually rode to work in the car, truck or van.

Real Estate

Real estate in El Paso is generally cheaper than the national average, with diverse residential options. On the other hand, Omaha real estate, while also affordable, tends to have higher price points than El Paso.

Neighborhoods

El Paso's neighborhoods are characterized by a mix of Hispanic culture in neighborhoods like Segundo Barrio and more modern, suburban areas like West El Paso. Omaha houses diverse neighborhoods like the historic Old Market and the upscale West Omaha.
Houses and residents
Type El Paso Omaha
Houses 261,779 212,802
Average household size (people) 3 2.5
Median year apartment built 1982 1976
Median year house/condo built 1985 1970
Length of stay in the house since moving in 14.7 years 13.3 years
Houses occupied 242,529 (92.6%) 201,469 (94.7%)
Houses occupied by owners 147,788 (60.9%) 117,404 (58.3%)
Houses occupied by renters 94,741 (39.1%) 84,065 (41.7%)
Median rent asked for vacant for-rent units $570.82 $892.09
Median monthly housing costs $939 $1,119
Median price asked for vacant for-sale houses and condos $227,007 $261,376
Estimated median house or condo value $152,800 $211,900
Median numbers of rooms 5.4 5.8
Median number of rooms in apartments 4.3 4
Median number of rooms in houses and condos 6.2 7.1
Median house price - detached houses $187,761 $249,098
Median house price - in 2-unit structures Over $1,000,000 $191,723
Median house price - in 3-to-4-unit structures $75,782 $100,661
Median house price - in 5 or more unit structures $266,003 $319,464
Median house price - mobile homes $43,095 $35,876
Median house price - Townhouses or other attached units $149,459 $186,544
Median house price - All housing units $186,951 $246,177
Median house age 38 49
Renting percentage 39.6% 41.7%
Housing density (houses/condos per square mile) 1,051 1,839.2
House value disparities 32.7% 33.1%
Household income disparities 46.6% 45.6%
Median household income for houses/condes with a mortgage $74,665 $98,149
Median household income for apartments without a mortgage $52,954 $71,454
Housing units without a mortgage 1,889 (2.2%) 2,417 (2.9%)
Housing units with both a second mortgage and home equity loan 2,956 (3.4%) 7,375 (8.9%)
Housing units with a mortgage 84,973 (97.8%) 80,503 (97.1%)
Housing units with a home equity loan 250 (0.3%) 335 (0.4%)
Housing units with a second mortgage 3,635 (4.2%) 9,200 (11.1%)
House/condo owner moved in on average (years ago) 14 12
House/condo renter moved in on average (years ago) 1 1
Housing units lacking complete kitchen facilities 2% 1.6%
Housing units lacking complete plumbing facilities 2% 0.7%
Housing units in structures
Housing units in structures El PasoOmaha
One, detached 67.7% 63.2%
One, attached 4.4% 3.9%
Two 2.4% 1.5%
3 or 4 4.1% 2.2%
5 to 9 5.9% 6.8%
10 to 19 5.8% 8.3%
20 to 49 2.4% 5.3%
50 or more 4.8% 8.1%
Mobile homes 2.3% 0.6%
Boats, RVs, vans, etc. 0.2% 0.0%
Median real estate property taxes paid for housing units
Type El Paso Omaha
With mortgages $3,795 (2.3%) $3,566 (1.6%)
With no mortgages $2,698 (2%) $3,525 (1.8%)
Marital status
Type El Paso Omaha
Divorced 10.1% 11.4%
Never married 33.6% 37.1%
Now married 47.2% 45.4%
Separated 3.4% 1%
Widowed 5.7% 5%
Class of workers - percentage
Class of Workers El PasoOmaha
Employee of private company 62.4% 68.7%
Local government workers 10.4% 6.1%
Self-employed workers in own not incorporated business 6.8% 4.7%
Private not-for-profit wage and salary workers 6.4% 11.0%
Federal government workers 6.3% 2.4%
State government workers 4.3% 3.1%
Self-employed in own incorporated business 3.2% 3.9%
Unpaid family workers 0.3% 0.1%
Class of workers - absolute values
Class of Workers El PasoOmaha
Employee of private company 181,601 173,032
Federal government workers 18,228 5,968
Local government workers 30,154 15,378
Private not-for-profit wage and salary workers 18,638 27,768
Self-employed in own incorporated business 9,323 9,846
Self-employed workers in own not incorporated business 19,650 11,886
State government workers 12,525 7,835
Unpaid family workers 901 205

Industries and Occupations

El Paso's largest industries are education, healthcare, and federal government, reflecting the leading employers. In contrast, Omaha hosts significant finance, insurance, and telecommunications sectors.
Most common male industries
Industry El PasoOmaha
Retail trade 10.1% 10.3%
Construction 9.8% 13.2%
Transportation and warehousing 9.5% 7.2%
Manufacturing 9.2% 11.9%
Health care and social assistance 9.2% 6.4%
Accommodation and food services 8.7% 6.5%
Public administration 8.2% 3.7%
Educational services 8.0% 5.5%
Administrative and support and waste management services 7.7% 4.3%
Professional, scientific, and technical services 5.6% 8.3%
Other services, except public administration 2.9% 3.7%
Wholesale trade 2.5% 3.5%
Finance and insurance 2.4% 8.2%
Information 1.7% 1.3%
Real estate and rental and leasing 1.2% 1.7%
Arts, entertainment, and recreation 1.2% 2.0%
Mining, quarrying, and oil and gas extraction 1.0% 0.0%
Utilities 0.6% 1.3%
Management of companies and enterprises 0.2% 0.1%
Agriculture, forestry, fishing and hunting 0.2% 0.9%
Most common female industries
Industry El PasoOmaha
Health care and social assistance 22.5% 24.2%
Educational services 16.1% 12.1%
Retail trade 10.8% 8.2%
Accommodation and food services 8.8% 7.3%
Administrative and support and waste management services 6.3% 5.0%
Professional, scientific, and technical services 6.0% 7.4%
Finance and insurance 5.4% 9.5%
Public administration 5.4% 3.2%
Other services, except public administration 3.9% 6.2%
Transportation and warehousing 3.7% 2.1%
Manufacturing 3.2% 4.9%
Real estate and rental and leasing 2.1% 2.1%
Information 1.7% 1.5%
Construction 1.3% 2.0%
Wholesale trade 1.3% 1.6%
Arts, entertainment, and recreation 0.9% 2.3%
Utilities 0.4% 0.3%
Mining, quarrying, and oil and gas extraction 0.3% 0.0%
Management of companies and enterprises 0.0% 0.2%
Most common male occupations
Occupation El PasoOmaha
Management occupations 11.4% 10.6%
Sales and related occupations 8.7% 7.2%
Construction and extraction occupations 7.9% 10.9%
Transportation occupations 7.5% 5.5%
Installation, maintenance, and repair occupations 7.3% 4.0%
Office and administrative support occupations 6.4% 6.3%
Food preparation and serving related occupations 5.7% 4.9%
Material moving occupations 5.4% 6.2%
Health diagnosing and treating practitioners and other technical occupations 4.5% 2.9%
Law enforcement workers including supervisors 4.3% 0.8%
Educational instruction, and library occupations 4.3% 3.3%
Production occupations 4.2% 8.8%
Building and grounds cleaning and maintenance occupations 4.1% 3.4%
Computer and mathematical occupations 3.6% 5.6%
Firefighting and prevention, and other protective service workers including supervisors 2.8% 1.8%
Architecture and engineering occupations 2.7% 2.4%
Business and financial operations occupations 2.3% 6.2%
Health technologists and technicians 2.1% 0.8%
Arts, design, entertainment, sports, and media occupations 1.2% 1.5%
Healthcare support occupations 0.9% 1.3%
Most common female occupations
Occupation El PasoOmaha
Office and administrative support occupations 17.6% 17.4%
Sales and related occupations 11.0% 8.0%
Educational instruction, and library occupations 10.6% 9.1%
Healthcare support occupations 8.7% 5.7%
Food preparation and serving related occupations 7.0% 6.0%
Management occupations 6.7% 10.3%
Health diagnosing and treating practitioners and other technical occupations 5.6% 8.7%
Business and financial operations occupations 5.5% 6.1%
Building and grounds cleaning and maintenance occupations 4.3% 2.5%
Personal care and service occupations 3.9% 4.2%
Transportation occupations 2.8% 0.9%
Health technologists and technicians 2.8% 3.9%
Production occupations 2.1% 2.9%
Community and social service occupations 2.0% 2.0%
Arts, design, entertainment, sports, and media occupations 1.8% 2.5%
Material moving occupations 1.5% 1.9%
Firefighting and prevention, and other protective service workers including supervisors 1.3% 0.4%
Law enforcement workers including supervisors 1.2% 0.2%
Legal occupations 0.9% 1.2%
Computer and mathematical occupations 0.8% 3.1%
Food environment data per 10,000 residents
Food environment statistics El PasoOmaha
Number of convenience stores (no gas) 3.0 3.1
Number of convenience stores (with gas) 0.6 0.3
Number of full-service restaurants 6.1 7.9
Number of grocery stores 1.6 1.6
Number of supercenters and club stores 0.2 0.1
Food environment - absolute values
Food environment statistics El PasoOmaha
Number of convenience stores (no gas) 216 154
Number of convenience stores (with gas) 41 15
Number of full-service restaurants 444 392
Number of grocery stores 116 78
Number of supercenters and club stores 11 7
Obesity and diabetes
Food environment statistics rate El PasoOmaha
Adult diabetes rate 7.5% 7.9%
Adult obesity rate 24.0% 26.7%
Low-income preschool obesity rate 12.3% 13.5%

Health Care

Health care facilities in both cities are robust. El Paso has several quality hospitals, including the well-rated University Medical Center of El Paso. In Omaha, residents have access to world-renowned hospitals, such as the Nebraska Medical Center.
Health (county statistics)
Type El Paso Omaha
General health status score of residents in this county from 1 (poor) to 5 (excellent) 3.1 3.5
Average weight of females (lbs) 160 lbs 167.4 lbs
Average weight of males (lbs) 194.1 lbs 204 lbs
Residents visited a dentist within the past year 57.3% 71.1%
Residents exercised in the past month 67.8% 73.8%
Adult residents drank alcohol in the past 30 days 44% 59.5%
Residents smoked 100+ cigarettes in their lives 34.8% 43%

Fatal vehicle accidents per 100,000 residents
Type Total count per 100,000Drunk per 100,000Fatal count per 100,000Pedestrian count per 100,000Person count per 100,000Vehicle count per 100,000
Year El PasoOmahaEl PasoOmahaEl PasoOmahaEl PasoOmahaEl PasoOmahaEl PasoOmaha
2021 11.5 5.7 0.0 0.0 12.1 6.0 2.5 0.8 29.9 12.3 19.2 9.4
2020 8.0 7.7 1.6 2.6 9.6 8.6 2.1 1.6 20.8 16.1 13.4 12.4
2019 9.9 6.7 2.6 1.5 10.1 6.9 5.1 1.3 21.8 14.2 15.1 10.5
2018 10.2 6.9 2.5 2.7 10.5 7.3 5.0 1.7 20.2 16.5 14.7 12.1
2017 7.5 7.1 1.3 3.1 7.6 8.0 2.5 1.7 15.7 13.8 11.2 12.4
2016 9.1 6.3 2.7 4.8 9.9 6.3 3.7 0.8 24.0 13.5 17.8 11.2
2015 7.4 8.5 2.5 3.2 7.8 8.9 1.5 1.5 19.4 21.4 13.6 13.5
2014 6.5 6.0 2.7 2.5 7.2 6.0 2.2 0.9 15.0 11.9 10.2 9.0
2013 7.0 4.8 2.2 2.1 7.4 5.3 1.8 1.4 17.8 10.8 10.7 7.1
2012 7.6 7.4 1.8 3.8 8.2 7.6 3.7 1.9 17.1 14.5 12.5 10.2
2011 9.2 4.3 3.3 1.4 10.7 4.3 2.4 0.7 23.3 10.8 14.4 7.2
2010 7.9 4.9 3.7 2.4 8.0 5.1 1.8 1.5 17.7 10.3 11.1 8.1
2009 7.7 4.4 2.7 3.5 9.0 4.8 2.3 0.4 21.0 13.0 12.9 8.1
2008 7.1 2.5 3.9 0.9 7.7 2.5 2.1 0.2 17.4 4.7 10.8 3.6
2007 6.8 6.6 1.2 3.8 7.2 7.0 2.5 0.7 17.7 17.6 10.2 10.8
2006 4.2 6.4 0.8 3.4 4.5 7.1 0.7 0.7 10.1 17.8 6.2 11.7
2005 7.7 5.8 4.4 2.5 8.5 6.2 2.2 1.2 19.4 15.7 12.4 10.0
2004 7.4 5.6 3.8 3.0 7.5 6.1 1.5 0.9 21.4 14.1 12.0 8.9
2003 7.8 5.7 3.3 1.4 9.0 5.9 3.3 1.4 20.5 15.7 10.6 9.5
2002 11.2 5.0 2.5 2.4 12.4 5.5 2.1 0.7 33.7 14.4 17.0 7.4
2001 8.6 7.5 1.6 3.1 9.9 8.0 2.5 3.1 25.6 23.0 13.6 12.3
2000 8.7 4.9 2.5 2.6 10.3 5.1 2.8 2.1 23.2 10.8 12.8 6.9
1999 8.2 6.2 2.4 2.8 9.5 6.7 2.6 1.0 27.3 16.3 12.9 9.6
1998 9.1 6.3 1.6 1.8 9.4 6.5 3.3 2.1 25.9 16.2 12.7 9.4
1997 8.2 6.6 2.5 3.7 9.0 7.1 3.7 0.8 22.3 18.4 11.5 10.5
1996 10.0 9.3 3.7 2.9 11.3 9.8 3.9 2.6 34.4 24.9 15.7 14.8
1995 9.4 5.4 2.4 2.4 9.5 5.9 4.1 1.6 24.7 16.1 13.3 8.6
1994 11.1 6.8 2.9 2.4 11.8 7.0 3.8 1.1 33.3 16.2 18.9 10.3
1993 15.0 6.8 5.3 2.4 16.4 7.3 6.9 3.3 43.3 19.3 21.9 10.6
1992 15.4 9.6 5.1 4.1 16.5 11.2 7.0 1.6 46.5 28.7 21.8 15.0
1991 15.6 5.0 5.8 1.7 16.7 5.0 7.9 1.1 47.4 14.9 21.2 9.7
1990 14.4 7.0 7.5 3.9 15.8 7.2 0.0 0.0 44.9 22.0 23.9 10.9
1989 14.4 7.2 8.1 3.0 15.6 7.2 0.0 0.0 37.9 17.7 19.2 10.2
1988 17.1 9.1 8.4 5.4 17.9 10.0 0.0 0.0 51.3 24.7 25.1 15.4
1987 13.5 9.1 4.9 3.9 14.3 10.6 0.0 0.0 34.4 22.5 17.6 12.8
1986 14.2 11.3 5.8 7.0 15.9 12.2 0.0 0.0 37.8 30.3 19.0 19.3
1985 18.1 6.5 4.3 3.7 20.0 6.8 0.0 0.0 54.0 17.5 23.8 11.1
1984 15.2 10.5 2.4 4.6 16.0 12.1 0.0 0.0 34.9 26.7 20.4 15.5
1983 15.7 8.1 4.4 4.4 17.2 8.7 0.0 0.0 39.8 21.2 23.0 12.8
1982 17.6 10.1 4.7 5.3 18.7 12.3 0.0 0.0 43.8 25.4 24.6 15.4
1981 19.8 14.2 5.8 6.6 21.6 16.4 0.0 0.0 57.6 36.1 27.9 20.9
1980 17.6 13.1 5.2 4.8 19.0 13.7 0.0 0.0 39.3 33.1 21.4 21.3
1979 15.9 9.5 5.1 3.8 16.9 9.8 0.0 0.0 39.8 29.0 22.2 15.8
1978 16.6 10.6 5.2 5.3 17.8 11.2 0.0 0.0 40.8 24.3 22.2 14.4
1977 15.5 13.0 4.8 5.9 16.5 15.1 0.0 0.0 40.1 31.5 20.5 19.8
1976 12.2 10.4 1.3 4.6 13.3 11.9 0.0 0.0 31.0 29.0 15.1 16.5
1975 12.6 10.3 1.3 4.5 13.6 11.8 0.0 0.0 31.8 28.8 15.5 16.3

Fatal vehicle accidents
Type Total countDrunkFatal countPedestrian countPerson countVehicle count
Year El PasoOmahaEl PasoOmahaEl PasoOmahaEl PasoOmahaEl PasoOmahaEl PasoOmaha
1975 47 34 5 15 51 39 0 0 119 95 58 54
1976 47 34 5 15 51 39 0 0 119 95 58 54
1977 61 42 19 19 65 49 0 0 158 102 81 64
1978 67 34 21 17 72 36 0 0 165 78 90 46
1979 66 30 21 12 70 31 0 0 165 92 92 50
1980 75 41 22 15 81 43 0 0 167 104 91 67
1981 86 45 25 21 94 52 0 0 250 114 121 66
1982 78 32 21 17 83 39 0 0 194 81 109 49
1983 71 26 20 14 78 28 0 0 180 68 104 41
1984 70 34 11 15 74 39 0 0 161 86 94 50
1985 85 21 20 12 94 22 0 0 254 57 112 36
1986 68 37 28 23 76 40 0 0 181 99 91 63
1987 66 30 24 13 70 35 0 0 168 74 86 42
1988 85 30 42 18 89 33 0 0 255 82 125 51
1989 73 24 41 10 79 24 0 0 192 59 97 34
1990 75 25 39 14 82 26 0 0 233 79 124 39
1991 83 18 31 6 89 18 42 4 253 54 113 35
1992 84 35 28 15 90 41 38 6 254 105 119 55
1993 84 25 30 9 92 27 39 12 243 71 123 39
1994 64 25 17 9 68 26 22 4 192 60 109 38
1995 55 20 14 9 56 22 24 6 145 60 78 32
1996 59 35 22 11 67 37 23 10 203 94 93 56
1997 49 25 15 14 54 27 22 3 134 70 69 40
1998 55 24 10 7 57 25 20 8 157 62 77 36
1999 50 24 15 11 58 26 16 4 167 63 79 37
2000 49 19 14 10 58 20 16 8 131 42 72 27
2001 49 31 9 13 56 33 14 13 145 95 77 51
2002 64 21 14 10 71 23 12 3 192 60 97 31
2003 45 24 19 6 52 25 19 6 118 66 61 40
2004 43 24 22 13 44 26 9 4 125 60 70 38
2005 45 25 26 11 50 27 13 5 114 68 73 43
2006 25 28 5 15 27 31 4 3 60 78 37 51
2007 41 29 7 17 43 31 15 3 106 78 61 48
2008 43 11 24 4 47 11 13 1 106 21 66 16
2009 48 20 17 16 56 22 14 2 130 59 80 37
2010 51 20 24 10 52 21 12 6 115 42 72 33
2011 61 18 22 6 71 18 16 3 155 45 96 30
2012 51 31 12 16 55 32 25 8 115 61 84 43
2013 47 21 15 9 50 23 12 6 120 47 72 31
2014 44 27 18 11 49 27 15 4 102 53 69 40
2015 50 40 17 15 53 42 10 7 131 101 92 64
2016 62 30 18 23 67 30 25 4 163 64 121 53
2017 51 34 9 15 52 38 17 8 107 66 76 59
2018 69 33 17 13 71 35 34 8 137 79 100 58
2019 67 32 18 7 69 33 35 6 148 68 103 50
2020 54 38 11 13 65 42 14 8 141 79 91 61
2021 78 28 0 0 82 29 17 4 203 60 130 46
Police full-time law enforcement employees
Year El PasoOmaha
2021 1,395 1,044
2020 1,455 1,012
2019 1,412 1,020
2018 1,341 1,016
2017 1,269 963
2016 1,236 926
2015 1,264 963
2014 0 928
2013 1,281 901
2012 1,254 943
2011 1,280 924
2010 1,279 918
2009 1,459 913
2008 1,455 893
2007 1,446 920
2006 1,444 946
2005 1,428 954
2004 1,438 922
2003 1,449 888
Police full-time law enforcement employees (per 1,000 residents)
Year El PasoOmaha
2021 2.0 2.2
2020 2.1 2.1
2019 2.1 2.2
2018 1.9 2.2
2017 1.8 2.1
2016 1.8 2.1
2015 1.8 2.1
2014 0.0 2.1
2013 1.9 2.1
2012 1.9 2.3
2011 1.9 2.2
2010 2.0 2.2
2009 2.4 2.1
2008 2.4 2.0
2007 2.3 2.1
2006 2.3 2.3
2005 2.4 2.3
2004 2.4 2.3
2003 2.5 2.2
Local government: full-time employees
Job El PasoOmaha
Airports 260 0
Financial administration 183 35
Firefighters 874 670
Fire - other 224 6
Health 413 0
Judicial and legal 121 33
Local libraries 134 98
Other and unallocable 734 130
Other government administration 207 75
Parks and recreation 388 140
Police - other 298 145
Police protection - officers 1,121 888
Sewerage 183 177
Solid waste management 360 0
Streets and highways 211 328
Totals for government 6,498 2,781
Transit 569 0
Water supply 181 0
Local government: part-time employees
Job El PasoOmaha
Airports 1 0
Financial administration 2 7
Health 17 0
Local libraries 17 153
Natural resources 0 2
Other and unallocable 3 15
Other government administration 12 7
Parks and recreation 220 284
Police - other 1 32
Police protection - officers 0 41
Sewerage 0 10
Solid waste management 2 0
Streets and highways 6 15
Totals for government 283 573
Transit 2 0
Place of birth - Foreign born
Residents El PasoOmaha
All residents 22.4% 10.7%
American Indian / Alaska Native residents 16.5% 34.5%
Asian residents 63.2% 80.3%
Black or African American residents 10.9% 9.0%
Native Hawaiian / Pacific Islander residents 5.8% 19.7%
Other race residents 34.3% 38.6%
Two or more races residents 24.5% 15.4%
White residents 10.8% 2.5%
White alone, not Hispanic / Latino residents 5.8% 1.7%
Place of birth - Native, outside of US
Residents El PasoOmaha
All residents 2.4% 1.1%
American Indian / Alaska Native residents 0.0% 1.3%
Asian residents 1.4% 0.7%
Black or African American residents 3.4% 0.1%
Native Hawaiian / Pacific Islander residents 41.5% 2.6%
Other race residents 2.2% 2.2%
Two or more races residents 2.2% 2.5%
White residents 3.1% 1.0%
White alone, not Hispanic / Latino residents 3.8% 0.8%
Place of birth - Born in state of residence
Residents El PasoOmaha
All residents 58.7% 59.0%
American Indian / Alaska Native residents 60.7% 47.3%
Asian residents 21.0% 12.0%
Black or African American residents 30.8% 64.7%
Native Hawaiian / Pacific Islander residents 35.3% 15.5%
Other race residents 55.2% 42.1%
Two or more races residents 62.3% 60.0%
White residents 59.0% 63.1%
White alone, not Hispanic / Latino residents 36.9% 64.9%
Place of birth - Born in other state
Residents El PasoOmaha
All residents 16.5% 29.2%
American Indian / Alaska Native residents 22.9% 16.9%
Asian residents 14.3% 7.0%
Black or African American residents 54.9% 26.2%
Native Hawaiian / Pacific Islander residents 17.3% 62.3%
Other race residents 8.3% 17.2%
Two or more races residents 11.0% 22.2%
White residents 27.1% 33.4%
White alone, not Hispanic / Latino residents 53.5% 32.6%
English speakers (speaking English at home)
Type El Paso Omaha
Born in the United States residents 67.7% 92.6%
Foreign born residents 7.2% 12.3%
Native, born elsewhere residents 39.7% 65.2%
Total residents 32.8% 83.4%
Mechanisms of homicide
Mechanism El PasoOmaha
Homicides from 2000 to 2006 166 203
Cut / Pierce 24 21
Firearm 69 131
Mechanisms of homicide per 1,000,000 residents
Mechanism El PasoOmaha
Homicides from 2000 to 2006 34.0 60.8
Cut / Pierce 4.9 6.3
Firearm 14.1 39.2
Mechanisms of suicide per 1,000,000 residents
Mechanism El PasoOmaha
Suicides from 2000 to 2006 73.6 103.0
Firearm 35.5 48.5
Poisoning 14.8 19.8
Suffocation 19.3 29.0

Infrastructure

El Paso and Omaha both have growing infrastructures but in different ways. El Paso is investing in public projects like road improvements and community centers, while Omaha has a focus on revitalizing its downtown and riverfront areas with new developments.
Infrastructure
Type El Paso Omaha
Hospitals 41 23
TV stations 10 19
Arenas or stadiums 2 2
Bank branches located here 89 183
Bank institutions located here 19 31
Main business address for public companies 7 30
Nuclear power plants nearby 0 1
Drinking water stations with no reported violations in the past 0 8
Drinking water stations with reported violations in the past 10 10

Schools

School facilities
Type El Paso Omaha
Private elementary/middle schools 22 39
Private high schools 16 12
Public elementary/middle schools 174 133
Public high schools 53 20
Colleges/Universities 18 18
HMDA - Conventional home purchase loans - Applications denied
Year El PasoOmaha
1999 1,994 1,177
2000 993 545
2001 704 390
2002 594 441
2003 1,268 747
2004 1,646 1,022
2005 2,316 1,055
2006 2,701 1,083
2007 2,051 646
2008 1,034 318
2009 454 220

Culture and Food

El Paso is renowned for its rich Hispanic culture, which is reflected in its food, events, music, and architecture. Omaha has a more Midwestern feel, with a vibrant food scene that goes beyond steaks, and an energetic arts and music environment.

Sports Teams

El Paso has minor league sports teams like the El Paso Chihuahuas (baseball) and El Paso Locomotive FC (soccer), while Omaha hosts the College World Series and is home to the Omaha Storm Chasers, a minor league baseball team.