El Paso, TX vs Portland, OR - Advanced U.S. city comparison tool

El Paso, TX vs Portland, OR

When comparing El Paso, Texas, and Portland, Oregon, the contrast between these two U.S. cities is evident. El Paso, a border city with a strong Mexican influence, offers a slower pace of life, dominated by warm weather, and lower living costs. Portland, with its progressive charm and robust tech industry, offers an eclectic mix of urban and outdoor living opportunities. As we dig deeper, sectors such as crime/safety, weather, cost of living, education, work and economy, infrastructure, industries, and others will reveal more about what it's like to live or visit these two unique cities.
 
 
Distance between El Paso, TX and Portland, OR : 1,285.7 miles

El Paso's population is larger by 6%. Its population has grown by 114,753 people (20.4%) since 2000. The population of Portland has grown by 112,041 people (21.2%) during that time.

Population
Type El Paso Portland
Population 678,415 641,162
Female / male percentage 50.7% / 49.3%
50.7%
49.3%
50.4% / 49.6%
50.4%
49.6%
Racial makeup - percentage
Ethnicity El PasoPortland
Hispanic 82.0% 11.4%
White Non-Hispanic 11.5% 66.6%
Black 3.1% 5.4%
Two or more 1.6% 6.8%
Asian 1.2% 8.4%
American Indian 0.2% 0.4%
Pacific Islander 0.0% 0.4%
Racial makeup - absolute values
Ethnicity El PasoPortland
Hispanic 556,625 73,526
White Non-Hispanic 78,203 427,830
Black 20,772 34,384
Two or more 10,877 43,827
Asian 8,252 53,691
American Indian 1,210 2,788
Pacific Islander 136 2,286

Crime and Safety

Statistically, El Paso is considered one of the safest large cities in the U.S. with crime rates lower than the national average. Portland, on the other hand, has crime rates similar to the national average. Visitors and residents alike can feel secure in El Paso. Portland, meanwhile, is dealing with some public safety issues Downtown, but overall it tends to be safe, particularly law-abiding neighborhoods.

Crime by year per 100,000 residents
Type City-data.com crime indexRobberies per 100,000Murders per 100,000Rapes per 100,000Assaults per 100,000Burglaries per 100,000Theft per 100,000Auto theft per 100,000Arson per 100,000
Year El PasoPortlandEl PasoPortlandEl PasoPortlandEl PasoPortlandEl PasoPortlandEl PasoPortlandEl PasoPortlandEl PasoPortlandEl PasoPortland
2020 153.5 399.8 42.2 121.7 4.1 8.0 38.1 39.5 231.9 353.4 123.6 567.0 1,057.2 3,211.0 60.6 960.9 2.0 44.5
2019 187.0 434.8 49.2 148.2 5.8 4.4 47.9 58.3 255.7 338.5 154.3 636.7 1,256.6 3,620.1 125.9 973.2 4.2 38.4
2018 190.8 454.2 54.6 162.2 3.3 4.0 58.8 70.6 254.2 292.1 160.8 683.1 1,226.1 3,755.6 118.7 1,058.6 3.8 41.8
2017 201.9 461.8 58.1 161.2 2.8 4.0 53.9 68.1 264.1 284.3 188.3 731.7 1,514.4 3,825.3 116.2 1,123.6 5.5 47.6
2016 199.7 415.4 69.3 156.5 2.5 2.5 45.7 61.4 272.8 281.6 205.2 637.9 1,474.8 3,768.4 118.2 782.9 7.1 37.4
2015 199.3 106.8 59.8 38.4 2.5 1.6 46.9 18.0 257.4 83.4 206.8 170.2 1,591.1 931.1 116.3 148.0 8.3 10.3
2014 217.2 393.0 61.0 137.6 3.1 4.2 49.2 42.6 279.3 288.5 232.1 673.4 1,789.0 4,013.0 120.7 548.3 7.1 27.0
2013 203.2 375.3 67.2 150.5 1.5 2.3 25.9 38.4 276.4 291.6 260.6 677.7 1,911.6 3,647.1 116.8 539.9 10.7 27.6
2012 226.2 398.6 69.7 158.9 3.4 3.3 27.2 38.6 322.9 316.4 270.3 747.6 1,987.3 3,745.3 171.7 599.5 13.9 42.5
2011 232.9 398.1 70.0 155.4 2.4 3.4 32.7 43.7 326.1 312.2 280.5 729.3 1,961.0 3,812.6 219.7 546.6 18.1 52.2
2010 239.3 390.1 73.8 172.2 0.8 3.8 27.6 39.4 338.6 307.3 300.9 705.8 2,141.2 3,601.7 239.1 555.9 15.6 36.7
2009 261.5 393.6 73.0 184.9 1.9 3.4 29.4 44.9 352.9 320.4 321.7 658.9 2,367.0 3,498.6 305.4 566.0 17.8 48.0
2008 279.3 439.7 74.5 204.7 2.8 4.7 29.6 45.2 354.5 368.3 339.5 778.8 2,428.3 3,905.3 449.6 603.8 19.3 54.8
2007 279.5 497.3 76.6 239.5 2.8 4.1 41.9 52.0 296.6 392.1 348.8 899.4 2,361.1 4,084.1 491.5 886.0 13.1 61.5
2006 288.5 505.3 81.7 239.2 2.1 3.7 48.7 54.0 260.9 417.2 360.7 1,011.7 2,436.2 4,063.8 573.8 825.9 15.1 75.3
2005 246.3 455.5 74.4 210.4 2.3 3.7 50.0 60.1 308.7 439.7 358.2 1,132.7 2,493.2 4,773.2 433.0 1,060.3 26.8 69.4
2004 262.2 490.7 96.0 236.7 1.9 5.3 33.8 57.6 414.2 442.2 387.9 1,330.7 2,812.1 5,207.8 309.8 1,091.5 33.7 66.7
2003 282.6 500.7 99.1 250.7 3.6 5.0 37.3 56.9 457.2 501.0 372.6 1,189.1 3,024.4 5,428.3 317.2 1,076.2 20.0 70.4

City-data.com crime index counts serious crimes and violent crime more heavily. It adjusts for the number of visitors and daily workers commuting into cities. (higher means more crime, U.S. average = 301.1)


Crime per year
Type City-data.com crime indexRobberiesMurdersRapesAssaultsBurglariesTheftAuto theftArson
Year El PasoPortlandEl PasoPortlandEl PasoPortlandEl PasoPortlandEl PasoPortlandEl PasoPortlandEl PasoPortlandEl PasoPortlandEl PasoPortland
2019 187.0 434.8 338 981 40 29 329 386 1,756 2,241 1,060 4,216 8,630 23,969 865 6,444 29 254
2018 190.8 454.2 376 1,066 23 26 405 464 1,750 1,920 1,107 4,490 8,441 24,684 817 6,958 26 275
2017 201.9 461.8 400 1,047 19 26 371 442 1,819 1,846 1,297 4,752 10,429 24,842 800 7,297 38 309
2016 199.7 415.4 476 1,005 17 16 314 394 1,875 1,808 1,410 4,096 10,135 24,198 812 5,027 49 240
2015 199.3 106.8 410 241 17 10 322 113 1,766 524 1,419 1,069 10,916 5,849 798 930 57 65
2014 217.2 393.0 415 847 21 26 335 262 1,900 1,776 1,579 4,146 12,170 24,707 821 3,376 48 166
2013 203.2 375.3 457 917 10 14 176 234 1,879 1,776 1,771 4,128 12,993 22,216 794 3,289 73 168
2012 226.2 398.6 471 950 23 20 184 231 2,181 1,892 1,826 4,471 13,425 22,398 1,160 3,585 94 254
2011 232.9 398.1 464 917 16 20 217 258 2,161 1,842 1,859 4,303 12,997 22,494 1,456 3,225 120 308
2010 239.3 390.1 479 1,005 5 22 179 230 2,198 1,794 1,953 4,120 13,899 21,026 1,552 3,245 101 214
2009 261.5 393.6 452 1,037 12 19 182 252 2,184 1,797 1,991 3,696 14,647 19,624 1,890 3,175 110 269
2008 279.3 439.7 456 1,132 17 26 181 250 2,171 2,037 2,079 4,307 14,870 21,597 2,753 3,339 118 303
2007 279.5 497.3 472 1,289 17 22 258 280 1,827 2,110 2,149 4,840 14,545 21,978 3,028 4,768 81 331
2006 288.5 505.3 503 1,297 13 20 300 293 1,606 2,262 2,220 5,485 14,996 22,033 3,532 4,478 93 408
2005 246.3 455.5 448 1,137 14 20 301 325 1,858 2,376 2,156 6,121 15,005 25,794 2,606 5,730 161 375
2004 262.2 490.7 570 1,287 11 29 201 313 2,460 2,405 2,304 7,237 16,702 28,322 1,840 5,936 200 363
2003 282.6 500.7 581 1,367 21 27 219 310 2,681 2,732 2,185 6,484 17,735 29,599 1,860 5,868 117 384

City-data.com crime index counts serious crimes and violent crime more heavily. It adjusts for the number of visitors and daily workers commuting into cities. (higher means more crime, U.S. average = 301.1)

Sex Offenders

According to our data, there are 1,274 registered sex offenders living in El Paso and 374 registered sex offenders living in .
The ratio of residents to sex offenders in El Paso is 536 to 1; the ratio in Portland is 1,710 to 1.
The number of registered sex offenders compared to the number of residents is much larger in El Paso than that in Portland.

Cost of Living

The cost of living in El Paso is markedly less than Portland. Everything from housing to groceries to health care is cheaper in El Paso. Conversely, Portland's cost of living is higher than the national average, making El Paso more budget-friendly, especially for those looking to relocate.

Income Tax

Texas, including El Paso, does not levy a state income tax. However, Oregon has one of the highest state income taxes, affecting Portland residents, reaching up to 9.9% for the highest earners.

Property Tax

El Paso homeowners face higher property taxes, generally higher than the national average. While Portland's property taxes can be considered high, Oregon's property taxes are similar to the national median.

Sales Tax

El Paso residents pay a combined city and state sales tax rate of 8.25%. On the other side, Portland residents benefit from Oregon's 0% sales tax, a significant financial advantage for the latter city's residents.
Income
Type El Paso Portland
Estimated median household income $51,241 $79,057
Estimated per capita income $25,670 $49,003
Cost of living index (U.S. average is 100) 82.2 106.5

If you make $50,000 in El Paso, you will have to make $64,781 in Portland to maintain the same standard of living.

Geographical Conditions

El Paso is in the high desert, marked by mountains and a plateau that offers panoramic views. Portland is situated in the Pacific Northwest, characterized by rivers, forests, and mountains, providing ample opportunities for outdoor activities.
Geographical information
Type El Paso Portland
Land area 249.1 sq. miles 134.3 sq. miles
Population density 2,723.7 people per sq. mile 4,773.4 people per sq. mile
Relative area comparison
El Paso, TX Portland, OR
First ancestry reported - percentage
Ancestry El PasoPortland
German 1.4% 6.9%
English 0.7% 5.8%
Irish 0.7% 4.8%
Italian 0.3% 2.1%
Polish 0.2% 1.1%
Scotch-Irish 0.1% 0.8%
French 0.1% 0.6%
Danish 0.1% 0.4%
Norwegian 0.1% 1.5%
Scottish 0.1% 1.3%
Ukrainian 0.0% 1.1%
Swiss 0.0% 0.2%
Swedish 0.0% 0.9%
Czech 0.0% 0.2%
Russian 0.0% 1.5%
Greek 0.0% 0.4%
French Canadian 0.0% 0.5%
Dutch 0.0% 0.8%
Welsh 0.0% 0.2%
Population origin - absolute values
Ancestry El PasoPortland
German 6,837 20,316
English 3,718 17,180
Irish 3,433 14,108
Italian 1,389 6,173
Polish 763 3,121
Scottish 696 3,719
French 527 1,648
Scotch-Irish 522 2,290
Danish 299 1,068
Norwegian 291 4,491
Russian 237 4,547
French Canadian 229 1,334
Dutch 195 2,298
Portuguese 186 350
Greek 170 1,119
Welsh 151 657
Czech 112 656
Hungarian 101 587
Swedish 80 2,743
West Indian 78 14
Foreign born residents - absolute values
Type Count
Region El PasoPortland
All 160,130 84,598
Africa 1,963 5,680
Asia 6,694 38,734
Europe 3,584 16,276
Latin America 142,736 17,770
North America 419 3,109
Oceania 158 2,332
Foreign born residents - percentage
Type Percentage
Region El PasoPortland
All 23.5% 13.2%
Africa 0.3% 0.9%
Asia 1.0% 6.0%
Europe 0.5% 2.5%
Latin America 20.9% 2.8%
North America 0.1% 0.5%
Oceania 0.0% 0.4%

Education

Both cities have reputable education systems, with public, private, and charter school options. El Paso holds the University of Texas at El Paso, while Portland is home to Portland State University and the prestigious Reed College. However, Portland often ranks higher in terms of education quality.
School enrollment
Type El Paso Portland
Nursery, preschool 8,469 (4.5%) 5,642 (4.4%)
Kindergarten 8,714 (4.6%) 5,572 (4.4%)
Grade 1 to 4 37,359 (19.7%) 26,106 (20.5%)
Grade 5 to 8 41,735 (22.1%) 24,017 (18.8%)
Grade 9 to 12 42,053 (22.2%) 22,286 (17.5%)
College undergrad 40,542 (21.4%) 32,232 (25.3%)
Graduate or professional 10,335 (5.5%) 11,567 (9.1%)
Students in private schools - absolute values
Type Count
Grade El PasoPortland
Grades 1 to 8 (elementary and middle school) 8,156 7,146
Grades 9 to 12 (high school) 2,433 2,342
Undergraduate colleges 4,538 8,610
Students in private schools - percentage
Type Percentage
Grade El PasoPortland
Grades 1 to 8 (elementary and middle school) 10.3% 14.3%
Grades 9 to 12 (high school) 5.8% 10.5%
Undergraduate colleges 11.2% 26.7%
Educational attainment
Type El Paso Portland
Less than high school 17.9% 6.7%
High school or equiv. 24.8% 13.7%
Less than 1 year of college 5.9% 5.5%
1 or more years of college 14.4% 13.1%
Associate degree 9% 6.6%
Bachelor's degree 19.5% 32.4%
Master's degree 6% 14%
Profess. school degree 1.6% 4.6%
Doctorate degree 0.9% 3.4%
Education level (25-year-olds and older)
Type El Paso Portland
Bachelor's degree or higher 28% 54.3%
Graduate or professional degree 8.5% 21.9%
High school or higher 82.1% 93.3%

Work and Economy

Both cities have robust economies but differ in their leading sectors. El Paso's economy revolves around military, government, education, and healthcare. Portland's economy is more diverse, with tech, manufacturing, and healthcare being major sectors. Unemployment rates are comparable in both cities.

Biggest Employers

In El Paso, the biggest employers include Fort Bliss and the University of Texas at El Paso. In Portland, Intel and Providence Health & Services are among the largest employers.
Employment and residency - absolute values
Kind El PasoPortland
Work and live in this city 182,077 200,158
Work and live in this county 276,305 294,789
Workers who work outside the city they live in 381,585 328,963
Workers who work outside the county they live in 18,231 57,602
Working at home 29,842 122,913
Not working at home 264,694 229,478
Daytime population change due to commuting 7,018 121,743
Employment and residency - percentage
Kind El PasoPortland
Work and live in this city 87.5% 73.9%
Work and live in this county 93.8% 83.7%
Workers who work outside the city they live in 12.5% 26.1%
Workers who work outside the county they live in 6.2% 16.3%
Working at home 10.1% 34.9%
Not working at home 89.9% 65.1%
Daytime population change due to commuting 1.2% 23.0%
Geographical mobility: all
Type all
Mobility El PasoPortland
Same house 1 year ago 86.0% 81.6%
Moved from abroad 0.9% 0.5%
Moved within same county 9.4% 10.2%
Moved from different state 2.2% 4.7%
Moved within same state 1.5% 3.1%
Geographical mobility: Asian
Type Asian
Mobility El PasoPortland
Same house 1 year ago 74.0% 86.0%
Moved from abroad 0% 0.7%
Moved within same county 17.6% 6.9%
Moved from different state 2.3% 3.0%
Moved within same state 6.1% 3.3%
Geographical mobility: Black
Type Black
Mobility El PasoPortland
Same house 1 year ago 83.3% 76.0%
Moved from abroad 1.1% 0.9%
Moved within same county 10.8% 12.8%
Moved from different state 4.0% 7.6%
Moved within same state 0.8% 2.8%
Geographical mobility: White
Type White
Mobility El PasoPortland
Same house 1 year ago 83.0% 80.9%
Moved from abroad 0.6% 0.2%
Moved within same county 11.0% 10.9%
Moved from different state 2.6% 5.0%
Moved within same state 2.8% 2.8%
Building permits
Type Average valueCount
City El PasoPortlandEl PasoPortland
1997 $49,700 $104,200 2,132 1,071
1998 $48,700 $109,000 2,873 1,155
1999 $52,400 $110,500 3,046 929
2000 $53,300 $144,700 2,589 866
2001 $55,500 $153,100 2,964 1,040
2002 $55,400 $156,100 3,180 1,088
2003 $60,000 $161,400 4,582 1,093
2004 $85,600 $169,700 2,720 956
2005 $122,100 $175,700 3,252 981
2006 $138,400 $185,400 2,903 1,256
2007 $151,900 $196,500 2,666 1,205
2008 $150,600 $194,700 2,521 648
2009 $162,300 $202,900 2,330 427
2010 $188,600 $220,300 2,478 435
2011 $150,600 $224,600 2,966 451
2012 $148,200 $231,200 2,815 644
2013 $160,000 $237,400 2,271 763
2014 $165,700 $257,800 2,021 792
2015 $167,100 $265,800 2,282 877
2016 $254,100 $254,100 2,014 831
2017 $220,600 $247,200 2,020 703
2018 $231,200 $241,100 1,588 775
2019 $241,400 $274,100 1,873 703
2020 $233,100 $273,300 1,570 584
2021 $235,800 $275,100 1,961 474

There were 1,961 building permits issued in El Paso in 2012 (1005 less than in 2011) compared to 474 building permits issued in Portland in 2012 (23 more than in 2011).

In El Paso (El Paso County), 65.5% voted for Democrats and 33.2% for Republicans in 2012 Presidential Election. In Portland (Multnomah County), 75.4% voted for Democrats and 20.6% for Republicans.

Elections
Type DemocratsRepublicansOther
Year El PasoPortlandEl PasoPortlandEl PasoPortland
2020 66.8% 79.2% 31.6% 17.9% 1.6% 2.9%
2016 69.1% 73.3% 26.0% 17.0% 4.9% 9.7%
2012 65.5% 75.4% 33.2% 20.6% 1.3% 4.0%
2008 66.0% 76.7% 33.4% 20.6% 0.6% 2.7%
2004 56.2% 71.6% 43.3% 27.1% 0.5% 1.3%
2000 57.9% 63.8% 39.8% 28.3% 2.3% 7.9%
1996 62.3% 59.2% 32.1% 26.3% 5.6% 14.4%
Breakdown of population affiliated with a religious congregation
Type AdherentsCongregations
Religion El PasoPortlandEl PasoPortland
CATHOLIC CHURCH 43.2% 15.2% 11.3% 6.7%
SOUTHERN BAPTIST CONVENTION 3.3% 0.5% 26.6% 3.8%
SEVENTH DAY ADVENTIST CHURCH 0.3% 0.9% 1.6% 3.4%
LUTHERAN CHURCH 0.2% 0.4% 1.0% 2.2%
EPISCOPAL CHURCH 0.1% 0.7% 1.0% 2.2%
EVANGELICAL LUTHERAN CHURCH IN AMERICA 0.1% 0.9% 1.0% 4.0%

Weather

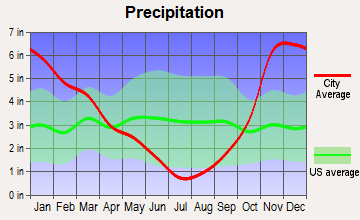
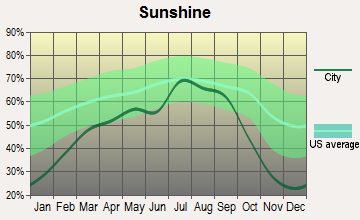
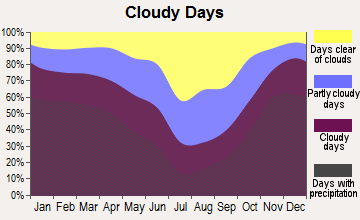
El Paso enjoys about 300 days of sunshine per year, making it a haven for those who enjoy warm, dry weather. However, it can get extremely hot in the summer. Contrarily, Portland experiences four distinct seasons with warm, dry summers and cool, rainy winters. Given the Pacific Northwest location, Portland has a significant amount of rainfall compared to El Paso.
Weather and climate
Type El Paso Portland
Temperature - Average 64.6°F 53.9°F
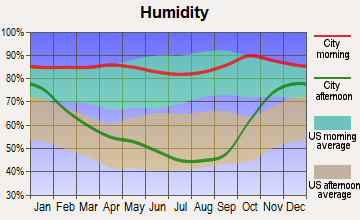
Humidity - Average morning or afternoon humidity 42.7% 76.5%
Humidity - Differences between morning and afternoon humidity 42.8% 42%
Humidity - Maximum monthly morning or afternoon humidity 59.8% 86%
Humidity - Minimum monthly morning or afternoon humidity 17% 44%
Precipitation - Yearly average 9.4 in 41.6 in
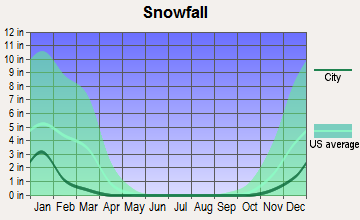
Snowfall - Yearly average 10.7 in 12.8 in
Clouds - Number of days clear of clouds 31.8% 11.3%
Sunshine amount - Average 89.4% 54.7%
Sunshine amount - Differences during a year 13.9% 52%
Sunshine amount - Maximum monthly 89.3% 72%
Sunshine amount - Minimum monthly 75.4% 20%
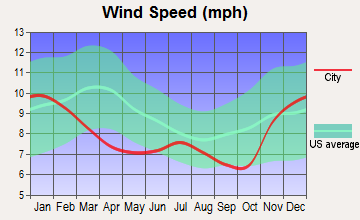
Wind speed - Average 8.9 mph 8.1 mph

Average climate in El Paso, Texas

Chicago, Illinois average temperatures Chicago, Illinois average precipitation Chicago, Illinois humidity Chicago, Illinois wind speed Chicago, Illinois snowfall Chicago, Illinois sunshine Chicago, Illinois clear and cloudy days
 

Average climate in Portland, Oregon

Chicago, Illinois average temperatures Chicago, Illinois average precipitation Chicago, Illinois humidity Chicago, Illinois wind speed Chicago, Illinois snowfall Chicago, Illinois sunshine Chicago, Illinois clear and cloudy days
 

Air pollution
Type AQICONO2OZONEPBPM10PM25SO2
Year El PasoPortlandEl PasoPortlandEl PasoPortlandEl PasoPortlandEl PasoPortlandEl Paso El PasoPortlandEl PasoPortland
2018 139 79 0.17 0.26 14.0 8.8 32.0 21.4 N/A N/A 35.7 N/A 9.2 7.2 N/A 0.4
2017 173 93 0.19 0.26 13.0 8.7 30.5 22.6 N/A N/A 40.4 N/A 9.5 7.1 0.5 0.4
2016 148 72 0.17 0.25 12.6 8.7 30.6 20.8 N/A N/A 35.2 N/A 9.2 5.2 0.5 0.2
2015 112 91 0.18 0.28 12.7 9.2 30.8 20.1 N/A N/A 31.2 N/A 8.0 7.4 0.5 0.5
2014 157 91 0.13 0.24 12.8 8.5 30.0 21.0 N/A N/A 40.3 N/A 9.7 6.3 0.4 0.8
2013 211 85 0.23 0.29 14.1 9.6 30.5 17.9 N/A N/A 43.9 N/A 10.8 8.6 0.4 1.1
2012 229 78 0.30 0.30 15.9 9.1 31.6 21.0 N/A N/A 40.2 N/A 11.6 7.4 0.4 0.6
2011 221 89 0.23 0.34 15.9 9.4 31.2 18.5 N/A N/A 34.7 N/A 11.6 8.1 0.5 0.8
2010 211 80 0.25 0.33 15.3 9.1 29.4 19.4 N/A N/A 28.8 N/A 7.9 6.4 0.3 1.4
2009 117 95 0.23 0.32 15.4 10.2 29.5 20.0 N/A N/A 28.6 N/A 8.3 8.4 0.3 1.6
2008 210 101 0.25 0.34 15.2 10.9 30.1 19.2 0.017 N/A 34.6 N/A 9.7 8.8 0.6 1.0
2007 134 101 0.28 0.35 13.9 11.4 30.6 18.1 0.019 N/A 40.5 N/A 8.4 8.8 0.4 1.3
2006 241 106 0.37 N/A 14.3 N/A 30.6 N/A 0.018 N/A 55.0 N/A 11.1 7.8 0.3 1.5
2005 159 96 0.43 N/A 13.1 N/A 29.6 N/A 0.013 N/A 44.5 N/A 9.6 8.9 0.6 1.7
2004 183 92 0.38 N/A 13.5 N/A 29.2 N/A 0.020 N/A 47.3 N/A 8.2 9.8 0.4 N/A
2003 278 77 0.46 N/A 15.5 N/A 29.5 N/A 0.039 0.008 60.4 N/A 10.8 8.6 0.6 N/A
2002 203 68 0.43 N/A 16.4 N/A 30.5 N/A 0.034 0.010 53.3 N/A 11.0 8.4 0.4 N/A
2001 139 73 0.51 N/A 15.5 N/A 28.7 N/A 0.046 0.008 N/A N/A 9.8 8.9 0.7 N/A
2000 145 52 0.67 N/A 17.8 N/A 27.8 N/A 0.072 N/A N/A N/A 9.1 N/A 1.0 N/A
Natural disasters
Type El Paso Portland
Tornado activity compared to U.S. average 4.2% 8.4%
Earthquake activity compared to U.S. average 524.4% 1,575.5%
Natural disasters compared to U.S. average 11% 9%

Transportation

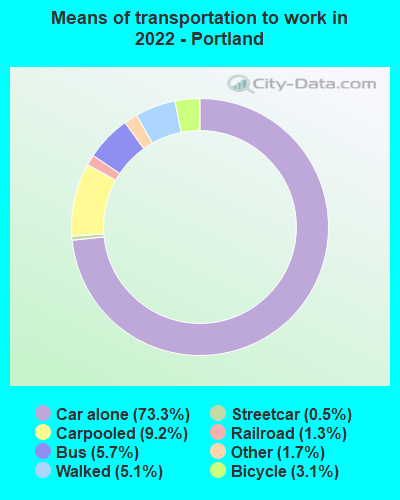
El Paso relies heavily on car commuting, although the city does have a public bus system. Conversely, Portland is known for its extensive public transit system that includes buses, light rail, and streetcars. Portland is also bike-friendly, with many residents cycling to work.
Transport
Type El Paso Portland
Amtrak stations 1 1
Amtrak stations nearby 1 3
FAA registered aircraft 331 804
FAA registered aircraft manufacturers and dealers 6 6
Means of transportation to work
Type El Paso Portland
Bicycle 0.3% 3.1%
Bus 1.3% 4.6%
Carpooled 11.2% 9.4%
Car alone 83.4% 76.2%
Motorcycle 0.2% 0.2%
Railroad 0% 0.9%
Streetcar 0% 0.3%
Walked 1.6% 3.8%
Means of transportation to work
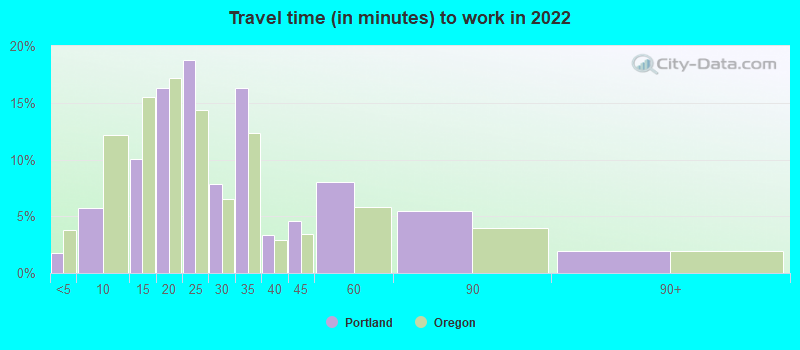
Average travel time to work
Type El Paso Portland
Average 25.1 min 28.8 min
Other means 22.2 min 21.8 min
Public transportation 46.4 min 38.2 min
Travel time to work
Time leaving to work
Travel time to work
Time leaving to work
Private vehicle occupancy
Type El Paso Portland
Average 1.2 1.2
Drove alone 88.5% 88.2%
In 2 person carpool 7.9% 8.4%
In 3 person carpool 2.1% 1.6%
In 4 person carpool 0.7% 0.8%
In 5-6 person carpool 0.7% 0.6%
In 7+ person carpool 0.1% 0.4%

How many people usually rode to work in the car, truck or van.

Real Estate

Real estate is more affordable in El Paso, with the median home value substantially lower than Portland. Portland's real estate market is fairly expensive, attributed to the city's increasing popularity and consequent demand.

Neighborhoods

El Paso offers a mix of suburban and rural neighborhoods. Downtown El Paso has seen significant revitalization recently. On the other hand, Portland is known for its diverse, vibrant neighborhoods, each with a unique identity and community feel.
Houses and residents
Type El Paso Portland
Houses 261,779 303,483
Average household size (people) 3 2.3
Median year apartment built 1982 1976
Median year house/condo built 1985 1954
Length of stay in the house since moving in 14.7 years 12.1 years
Houses occupied 242,529 (92.6%) 286,734 (94.5%)
Houses occupied by owners 147,788 (60.9%) 153,121 (53.4%)
Houses occupied by renters 94,741 (39.1%) 133,613 (46.6%)
Median rent asked for vacant for-rent units $570.82 $1,917
Median monthly housing costs $939 $1,535
Median price asked for vacant for-sale houses and condos $227,007 $248,225
Estimated median house or condo value $152,800 $520,200
Median numbers of rooms 5.4 4.8
Median number of rooms in apartments 4.3 3.4
Median number of rooms in houses and condos 6.2 6.2
Median house price - detached houses $187,761 $568,464
Median house price - in 2-unit structures Over $1,000,000 $576,814
Median house price - in 3-to-4-unit structures $75,782 $426,181
Median house price - in 5 or more unit structures $266,003 $466,898
Median house price - mobile homes $43,095 $136,996
Median house price - occupied boats, rvs, vans etc. $9,296 $126,313
Median house price - Townhouses or other attached units $149,459 $416,951
Median house price - All housing units $186,951 $544,799
Median house age 38 56
Renting percentage 39.6% 46.3%
Housing density (houses/condos per square mile) 1,051 2,259.4
House value disparities 32.7% 23.1%
Household income disparities 46.6% 44.7%
Median household income for houses/condes with a mortgage $74,665 $122,948
Median household income for apartments without a mortgage $52,954 $72,663
Housing units without a mortgage 1,889 (2.2%) 2,404 (2.2%)
Housing units with both a second mortgage and home equity loan 2,956 (3.4%) 11,239 (10.1%)
Housing units with a mortgage 84,973 (97.8%) 108,864 (97.8%)
Housing units with a home equity loan 250 (0.3%) 396 (0.4%)
Housing units with a second mortgage 3,635 (4.2%) 12,832 (11.5%)
House/condo owner moved in on average (years ago) 14 9
House/condo renter moved in on average (years ago) 1 1
Housing units lacking complete kitchen facilities 2% 1.2%
Housing units lacking complete plumbing facilities 2% 0.9%
Housing units in structures
Housing units in structures El PasoPortland
One, detached 67.7% 53.3%
One, attached 4.4% 5.7%
Two 2.4% 3.5%
3 or 4 4.1% 4.5%
5 to 9 5.9% 4.0%
10 to 19 5.8% 4.7%
20 to 49 2.4% 6.6%
50 or more 4.8% 16.2%
Mobile homes 2.3% 1.2%
Boats, RVs, vans, etc. 0.2% 0.3%
Median real estate property taxes paid for housing units
Type El Paso Portland
With mortgages $3,795 (2.3%) $4,785 (0.9%)
With no mortgages $2,698 (2%) $5,119 (1%)
Marital status
Type El Paso Portland
Divorced 10.1% 11.8%
Never married 33.6% 41.9%
Now married 47.2% 41.7%
Separated 3.4% 1.3%
Widowed 5.7% 3.3%
Class of workers - percentage
Class of Workers El PasoPortland
Employee of private company 62.4% 63.6%
Local government workers 10.4% 6.0%
Self-employed workers in own not incorporated business 6.8% 7.1%
Private not-for-profit wage and salary workers 6.4% 12.9%
Federal government workers 6.3% 2.1%
State government workers 4.3% 4.4%
Self-employed in own incorporated business 3.2% 3.8%
Unpaid family workers 0.3% 0.2%
Class of workers - absolute values
Class of Workers El PasoPortland
Employee of private company 181,601 228,214
Federal government workers 18,228 7,432
Local government workers 30,154 21,455
Private not-for-profit wage and salary workers 18,638 46,135
Self-employed in own incorporated business 9,323 13,673
Self-employed workers in own not incorporated business 19,650 25,437
State government workers 12,525 15,615
Unpaid family workers 901 688

Industries and Occupations

The leading industries in El Paso are education, healthcare, and the government, including the military. In Portland, the tech industry is significant, with numerous startups and established companies.
Most common male industries
Industry El PasoPortland
Retail trade 10.1% 10.7%
Construction 9.8% 7.2%
Transportation and warehousing 9.5% 6.1%
Manufacturing 9.2% 11.8%
Health care and social assistance 9.2% 9.7%
Accommodation and food services 8.7% 5.2%
Public administration 8.2% 3.5%
Educational services 8.0% 6.0%
Administrative and support and waste management services 7.7% 3.8%
Professional, scientific, and technical services 5.6% 16.2%
Other services, except public administration 2.9% 5.4%
Wholesale trade 2.5% 3.1%
Finance and insurance 2.4% 3.3%
Information 1.7% 2.8%
Real estate and rental and leasing 1.2% 2.3%
Arts, entertainment, and recreation 1.2% 1.6%
Mining, quarrying, and oil and gas extraction 1.0% 0.0%
Utilities 0.6% 0.7%
Management of companies and enterprises 0.2% 0.1%
Agriculture, forestry, fishing and hunting 0.2% 0.5%
Most common female industries
Industry El PasoPortland
Health care and social assistance 22.5% 22.2%
Educational services 16.1% 10.6%
Retail trade 10.8% 11.9%
Accommodation and food services 8.8% 6.6%
Administrative and support and waste management services 6.3% 2.7%
Professional, scientific, and technical services 6.0% 11.7%
Public administration 5.4% 4.5%
Finance and insurance 5.4% 5.2%
Other services, except public administration 3.9% 6.4%
Transportation and warehousing 3.7% 3.3%
Manufacturing 3.2% 5.1%
Real estate and rental and leasing 2.1% 2.1%
Information 1.7% 1.5%
Construction 1.3% 1.8%
Wholesale trade 1.3% 1.8%
Arts, entertainment, and recreation 0.9% 2.1%
Utilities 0.4% 0.4%
Mining, quarrying, and oil and gas extraction 0.3% 0.0%
Agriculture, forestry, fishing and hunting 0.0% 0.2%
Most common male occupations
Occupation El PasoPortland
Management occupations 11.4% 12.5%
Sales and related occupations 8.7% 7.9%
Construction and extraction occupations 7.9% 5.5%
Transportation occupations 7.5% 3.8%
Installation, maintenance, and repair occupations 7.3% 2.9%
Office and administrative support occupations 6.4% 6.3%
Food preparation and serving related occupations 5.7% 3.8%
Material moving occupations 5.4% 3.9%
Health diagnosing and treating practitioners and other technical occupations 4.5% 4.4%
Law enforcement workers including supervisors 4.3% 0.3%
Educational instruction, and library occupations 4.3% 4.2%
Production occupations 4.2% 6.3%
Building and grounds cleaning and maintenance occupations 4.1% 2.7%
Computer and mathematical occupations 3.6% 8.5%
Firefighting and prevention, and other protective service workers including supervisors 2.8% 1.3%
Architecture and engineering occupations 2.7% 5.3%
Business and financial operations occupations 2.3% 6.9%
Health technologists and technicians 2.1% 0.7%
Arts, design, entertainment, sports, and media occupations 1.2% 5.4%
Healthcare support occupations 0.9% 1.2%
Most common female occupations
Occupation El PasoPortland
Office and administrative support occupations 17.6% 12.3%
Sales and related occupations 11.0% 9.0%
Educational instruction, and library occupations 10.6% 6.4%
Healthcare support occupations 8.7% 4.8%
Food preparation and serving related occupations 7.0% 5.2%
Management occupations 6.7% 13.2%
Health diagnosing and treating practitioners and other technical occupations 5.6% 8.8%
Business and financial operations occupations 5.5% 8.0%
Building and grounds cleaning and maintenance occupations 4.3% 1.4%
Personal care and service occupations 3.9% 3.7%
Transportation occupations 2.8% 1.2%
Health technologists and technicians 2.8% 2.6%
Production occupations 2.1% 2.4%
Community and social service occupations 2.0% 3.7%
Arts, design, entertainment, sports, and media occupations 1.8% 4.9%
Material moving occupations 1.5% 1.7%
Firefighting and prevention, and other protective service workers including supervisors 1.3% 0.3%
Law enforcement workers including supervisors 1.2% 0.2%
Legal occupations 0.9% 2.1%
Computer and mathematical occupations 0.8% 2.9%
Food environment data per 10,000 residents
Food environment statistics El PasoPortland
Number of convenience stores (no gas) 3.0 1.3
Number of convenience stores (with gas) 0.6 2.6
Number of full-service restaurants 6.1 14.3
Number of grocery stores 1.6 1.7
Number of supercenters and club stores 0.2 0.2
Food environment - absolute values
Food environment statistics El PasoPortland
Number of convenience stores (no gas) 216 89
Number of convenience stores (with gas) 41 178
Number of full-service restaurants 444 999
Number of grocery stores 116 122
Number of supercenters and club stores 11 16
Obesity and diabetes
Food environment statistics rate El PasoPortland
Adult diabetes rate 7.5% 7.0%
Adult obesity rate 24.0% 23.3%
Low-income preschool obesity rate 12.3% 12.9%

Health Care

Both cities provide access to high-quality healthcare. El Paso's major providers are the University Medical Center and Las Palmas Medical Center. Portland boasts the highly-rated Oregon Health & Science University, alongside other major healthcare providers.
Health (county statistics)
Type El Paso Portland
General health status score of residents in this county from 1 (poor) to 5 (excellent) 3.1 3.6
Average weight of females (lbs) 160 lbs 162.3 lbs
Average weight of males (lbs) 194.1 lbs 196.6 lbs
Residents visited a dentist within the past year 57.3% 72.4%
Residents exercised in the past month 67.8% 80.5%
Adult residents drank alcohol in the past 30 days 44% 62.6%
Residents smoked 100+ cigarettes in their lives 34.8% 42.1%

Fatal vehicle accidents per 100,000 residents
Type Total count per 100,000Drunk per 100,000Fatal count per 100,000Pedestrian count per 100,000Person count per 100,000Vehicle count per 100,000
Year El PasoPortlandEl PasoPortlandEl PasoPortlandEl PasoPortlandEl PasoPortlandEl PasoPortland
2021 11.5 9.2 0.0 0.0 12.1 10.0 2.5 4.5 29.9 16.8 19.2 14.3
2020 8.0 7.8 1.6 1.7 9.6 8.6 2.1 3.8 20.8 13.9 13.4 10.9
2019 9.9 7.0 2.6 1.8 10.1 7.5 5.1 2.8 21.8 12.5 15.1 10.4
2018 10.2 5.5 2.5 1.8 10.5 5.5 5.0 2.8 20.2 8.6 14.7 8.1
2017 7.5 6.9 1.3 1.9 7.6 7.4 2.5 3.2 15.7 11.1 11.2 9.3
2016 9.1 6.5 2.7 2.0 9.9 6.5 3.7 3.0 24.0 14.9 17.8 9.8
2015 7.4 5.4 2.5 2.7 7.8 5.5 1.5 2.2 19.4 10.6 13.6 8.2
2014 6.5 3.6 2.7 1.3 7.2 3.6 2.2 1.8 15.0 6.3 10.2 4.7
2013 7.0 5.9 2.2 3.1 7.4 6.1 1.8 2.3 17.8 13.3 10.7 8.2
2012 7.6 5.1 1.8 1.8 8.2 5.3 3.7 2.8 17.1 9.3 12.5 7.1
2011 9.2 5.7 3.3 2.4 10.7 5.7 2.4 2.2 23.3 11.3 14.4 10.1
2010 7.9 3.9 3.7 0.9 8.0 4.1 1.8 3.3 17.7 8.6 11.1 6.0
2009 7.7 5.3 2.7 2.8 9.0 5.5 2.3 2.5 21.0 11.3 12.9 6.9
2008 7.1 3.2 3.9 1.3 7.7 3.4 2.1 0.9 17.4 7.0 10.8 4.3
2007 6.8 6.0 1.2 1.8 7.2 6.2 2.5 2.7 17.7 13.0 10.2 7.5
2006 4.2 5.2 0.8 1.5 4.5 5.4 0.7 1.3 10.1 11.7 6.2 8.4
2005 7.7 6.2 4.4 2.6 8.5 6.4 2.2 2.2 19.4 16.1 12.4 10.5
2004 7.4 5.8 3.8 2.6 7.5 6.9 1.5 2.1 21.4 16.3 12.0 8.6
2003 7.8 8.0 3.3 3.2 9.0 8.5 3.3 4.1 20.5 18.0 10.6 10.2
2002 11.2 7.1 2.5 2.8 12.4 7.6 2.1 2.2 33.7 18.6 17.0 11.1
2001 8.6 6.4 1.6 1.9 9.9 6.9 2.5 2.8 25.6 15.1 13.6 9.0
2000 8.7 4.9 2.5 1.9 10.3 5.1 2.8 1.9 23.2 11.9 12.8 7.2
1999 8.2 7.1 2.4 3.2 9.5 7.1 2.6 3.0 27.3 19.7 12.9 11.3
1998 9.1 8.7 1.6 4.4 9.4 9.1 3.3 3.8 25.9 28.2 12.7 14.9
1997 8.2 8.3 2.5 3.4 9.0 9.7 3.7 3.4 22.3 20.5 11.5 11.5
1996 10.0 10.8 3.7 3.6 11.3 11.8 3.9 4.0 34.4 32.9 15.7 16.1
1995 9.4 8.0 2.4 2.4 9.5 8.2 4.1 2.2 24.7 21.7 13.3 12.4
1994 11.1 8.6 2.9 2.4 11.8 9.2 3.8 3.8 33.3 20.1 18.9 10.7
1993 15.0 9.7 5.3 3.6 16.4 9.9 6.9 4.6 43.3 24.3 21.9 13.3
1992 15.4 7.7 5.1 3.2 16.5 8.3 7.0 2.4 46.5 19.0 21.8 9.9
1991 15.6 9.2 5.8 4.3 16.7 9.6 7.9 4.1 47.4 27.9 21.2 14.5
1990 14.4 11.7 7.5 6.4 15.8 12.5 0.0 0.0 44.9 37.5 23.9 18.7
1989 14.4 13.7 8.1 5.1 15.6 14.4 0.0 0.0 37.9 36.2 19.2 22.1
1988 17.1 14.4 8.4 7.1 17.9 15.6 0.0 0.0 51.3 37.8 25.1 21.5
1987 13.5 17.5 4.9 9.6 14.3 18.2 0.0 0.0 34.4 49.2 17.6 27.8
1986 14.2 16.8 5.8 7.3 15.9 20.0 0.0 0.0 37.8 48.3 19.0 27.1
1985 18.1 14.4 4.3 7.0 20.0 14.9 0.0 0.0 54.0 40.0 23.8 22.1
1984 15.2 12.6 2.4 5.8 16.0 13.1 0.0 0.0 34.9 32.1 20.4 18.9
1983 15.7 13.6 4.4 7.2 17.2 14.9 0.0 0.0 39.8 36.0 23.0 19.0
1982 17.6 12.6 4.7 6.8 18.7 13.6 0.0 0.0 43.8 33.0 24.6 19.4
1981 19.8 20.8 5.8 10.4 21.6 21.6 0.0 0.0 57.6 55.7 27.9 31.5
1980 17.6 15.8 5.2 7.1 19.0 16.6 0.0 0.0 39.3 39.9 21.4 21.2
1979 15.9 12.5 5.1 7.9 16.9 12.7 0.0 0.0 39.8 28.7 22.2 16.8
1978 16.6 16.2 5.2 7.3 17.8 17.0 0.0 0.0 40.8 43.7 22.2 23.8
1977 15.5 15.3 4.8 5.7 16.5 17.2 0.0 0.0 40.1 40.4 20.5 21.8
1976 12.2 13.4 1.3 5.6 13.3 13.9 0.0 0.0 31.0 37.5 15.1 19.3
1975 12.6 13.4 1.3 5.6 13.6 13.9 0.0 0.0 31.8 37.4 15.5 19.2

Fatal vehicle accidents
Type Total countDrunkFatal countPedestrian countPerson countVehicle count
Year El PasoPortlandEl PasoPortlandEl PasoPortlandEl PasoPortlandEl PasoPortlandEl PasoPortland
1975 47 50 5 21 51 52 0 0 119 140 58 72
1976 47 50 5 21 51 52 0 0 119 140 58 72
1977 61 57 19 21 65 64 0 0 158 150 81 81
1978 67 60 21 27 72 63 0 0 165 162 90 88
1979 66 46 21 29 70 47 0 0 165 106 92 62
1980 75 58 22 26 81 61 0 0 167 147 91 78
1981 86 78 25 39 94 81 0 0 250 209 121 118
1982 78 48 21 26 83 52 0 0 194 126 109 74
1983 71 53 20 28 78 58 0 0 180 140 104 74
1984 70 50 11 23 74 52 0 0 161 127 94 75
1985 85 58 20 28 94 60 0 0 254 161 112 89
1986 68 69 28 30 76 82 0 0 181 198 91 111
1987 66 73 24 40 70 76 0 0 168 205 86 116
1988 85 61 42 30 89 66 0 0 255 160 125 91
1989 73 59 41 22 79 62 0 0 192 156 97 95
1990 75 57 39 31 82 61 0 0 233 183 124 91
1991 83 45 31 21 89 47 42 20 253 137 113 71
1992 84 38 28 16 90 41 38 12 254 94 119 49
1993 84 48 30 18 92 49 39 23 243 121 123 66
1994 64 43 17 12 68 46 22 19 192 100 109 53
1995 55 40 14 12 56 41 24 11 145 108 78 62
1996 59 54 22 18 67 59 23 20 203 165 93 81
1997 49 42 15 17 54 49 22 17 134 103 69 58
1998 55 44 10 22 57 46 20 19 157 142 77 75
1999 50 36 15 16 58 36 16 15 167 99 79 57
2000 49 26 14 10 58 27 16 10 131 63 72 38
2001 49 34 9 10 56 37 14 15 145 81 77 48
2002 64 38 14 15 71 41 12 12 192 100 97 60
2003 45 43 19 17 52 46 19 22 118 97 61 55
2004 43 31 22 14 44 37 9 11 125 87 70 46
2005 45 33 26 14 50 34 13 12 114 86 73 56
2006 25 28 5 8 27 29 4 7 60 63 37 45
2007 41 33 7 10 43 34 15 15 106 71 61 41
2008 43 18 24 7 47 19 13 5 106 39 66 24
2009 48 30 17 16 56 31 14 14 130 64 80 39
2010 51 23 24 5 52 24 12 19 115 50 72 35
2011 61 34 22 14 71 34 16 13 155 67 96 60
2012 51 31 12 11 55 32 25 17 115 56 84 43
2013 47 36 15 19 50 37 12 14 120 81 72 50
2014 44 22 18 8 49 22 15 11 102 39 69 29
2015 50 34 17 17 53 35 10 14 131 67 92 52
2016 62 42 18 13 67 42 25 19 163 96 121 63
2017 51 45 9 12 52 48 17 21 107 72 76 60
2018 69 36 17 12 71 36 34 18 137 56 100 53
2019 67 46 18 12 69 49 35 18 148 82 103 68
2020 54 51 11 11 65 56 14 25 141 91 91 71
2021 78 59 0 0 82 64 17 29 203 108 130 92
Police full-time law enforcement employees
Year El PasoPortland
2021 1,395 1,040
2020 1,455 1,132
2019 1,412 1,157
2018 1,341 1,177
2017 1,269 1,174
2016 1,236 1,150
2015 1,264 1,150
2014 0 1,149
2013 1,281 1,156
2012 1,254 1,195
2011 1,280 1,201
2010 1,279 1,186
2009 1,459 1,242
2008 1,455 1,259
2007 1,446 1,259
2006 1,444 0
2005 1,428 1,259
2004 1,438 1,251
2003 1,449 1,267
Police full-time law enforcement employees (per 1,000 residents)
Year El PasoPortland
2021 2.0 1.6
2020 2.1 1.7
2019 2.1 1.7
2018 1.9 1.8
2017 1.8 1.8
2016 1.8 1.8
2015 1.8 1.8
2014 0.0 1.9
2013 1.9 1.9
2012 1.9 2.0
2011 1.9 2.0
2010 2.0 2.0
2009 2.4 2.2
2008 2.4 2.3
2007 2.3 2.3
2006 2.3 0.0
2005 2.4 2.3
2004 2.4 2.3
2003 2.5 2.3
Local government: full-time employees
Job El PasoPortland
Airports 260 0
Financial administration 183 486
Firefighters 874 639
Fire - other 224 63
Health 413 0
Judicial and legal 121 60
Local libraries 134 0
Other and unallocable 734 133
Other government administration 207 616
Parks and recreation 388 588
Police - other 298 385
Police protection - officers 1,121 857
Sewerage 183 548
Solid waste management 360 26
Streets and highways 211 849
Totals for government 6,498 5,923
Transit 569 0
Water supply 181 563
Local government: part-time employees
Job El PasoPortland
Airports 1 0
Financial administration 2 23
Health 17 0
Local libraries 17 0
Other and unallocable 3 7
Other government administration 12 24
Parks and recreation 220 1,031
Police - other 1 16
Police protection - officers 0 1
Sewerage 0 26
Solid waste management 2 0
Streets and highways 6 22
Totals for government 283 1,194
Transit 2 0
Water supply 0 22
Place of birth - Foreign born
Residents El PasoPortland
All residents 22.4% 12.7%
American Indian / Alaska Native residents 16.5% 13.0%
Asian residents 63.2% 60.8%
Black or African American residents 10.9% 16.8%
Native Hawaiian / Pacific Islander residents 5.8% 34.3%
Other race residents 34.3% 29.5%
Two or more races residents 24.5% 9.1%
White residents 10.8% 5.2%
White alone, not Hispanic / Latino residents 5.8% 5.3%
Place of birth - Native, outside of US
Residents El PasoPortland
All residents 2.4% 1.6%
American Indian / Alaska Native residents 0.0% 1.0%
Asian residents 1.4% 1.7%
Black or African American residents 3.4% 1.8%
Native Hawaiian / Pacific Islander residents 41.5% 12.9%
Other race residents 2.2% 1.9%
Two or more races residents 2.2% 3.3%
White residents 3.1% 1.5%
White alone, not Hispanic / Latino residents 3.8% 1.3%
Place of birth - Born in state of residence
Residents El PasoPortland
All residents 58.7% 37.7%
American Indian / Alaska Native residents 60.7% 41.1%
Asian residents 21.0% 21.1%
Black or African American residents 30.8% 47.2%
Native Hawaiian / Pacific Islander residents 35.3% 20.4%
Other race residents 55.2% 33.6%
Two or more races residents 62.3% 47.2%
White residents 59.0% 38.1%
White alone, not Hispanic / Latino residents 36.9% 39.6%
Place of birth - Born in other state
Residents El PasoPortland
All residents 16.5% 48.0%
American Indian / Alaska Native residents 22.9% 44.8%
Asian residents 14.3% 16.4%
Black or African American residents 54.9% 34.3%
Native Hawaiian / Pacific Islander residents 17.3% 32.4%
Other race residents 8.3% 34.9%
Two or more races residents 11.0% 40.3%
White residents 27.1% 55.2%
White alone, not Hispanic / Latino residents 53.5% 53.8%
English speakers (speaking English at home)
Type El Paso Portland
Born in the United States residents 67.7% 93.1%
Foreign born residents 7.2% 21.2%
Native, born elsewhere residents 39.7% 69%
Total residents 32.8% 81.5%
Mechanisms of homicide
Mechanism El PasoPortland
Homicides from 2000 to 2006 166 202
Cut / Pierce 24 29
Firearm 69 116
Mechanisms of homicide per 1,000,000 residents
Mechanism El PasoPortland
Homicides from 2000 to 2006 34.0 42.9
Cut / Pierce 4.9 6.2
Firearm 14.1 24.6
Mechanisms of suicide per 1,000,000 residents
Mechanism El PasoPortland
Suicides from 2000 to 2006 73.6 140.5
Drowning 0 5.1
Fall 0 10.0
Firearm 35.5 57.3
Poisoning 14.8 31.2
Suffocation 19.3 31.2

Infrastructure

El Paso's infrastructure is standard for a midsize city, with regular upgrades and maintenance. Portland, as a more significant urban area, has more developed infrastructure with comprehensive bike lanes and green building initiatives.
Infrastructure
Type El Paso Portland
Hospitals 41 21
TV stations 10 18
Arenas or stadiums 2 3
Bank branches located here 89 208
Bank institutions located here 19 30
Main business address for public companies 7 32
Drinking water stations with no reported violations in the past 0 2
Drinking water stations with reported violations in the past 10 16

Schools

School facilities
Type El Paso Portland
Private elementary/middle schools 22 45
Private high schools 16 27
Public elementary/middle schools 174 126
Public high schools 53 21
Colleges/Universities 18 37
HMDA - Conventional home purchase loans - Applications denied
Year El PasoPortland
1999 1,994 1,922
2000 993 1,651
2001 704 1,193
2002 594 1,235
2003 1,268 1,844
2004 1,646 2,651
2005 2,316 3,396
2006 2,701 3,510
2007 2,051 3,008
2008 1,034 1,465
2009 454 712

Culture and Food

El Paso is rich in Mexican culture and cuisine, with countless authentic restaurants and cultural events. Portland, renowned for its food scene, offers an eclectic mix of cuisines with an emphasis on fresh, local ingredients. Both cities enjoy thriving music and arts scenes.

Sports Teams

El Paso boasts minor league baseball, soccer teams, and college sports. Portland has major league basketball with the Trail Blazers, soccer with the Timbers and Thorns, and a strong collegiate sports presence.