In this comparison between Fort Worth, Texas, and Chattanooga, Tennessee, several factors are considered to determine the quality of life, cost of living, and the overall attractiveness for prospective residents and tourists alike. Both cities offer unique attributes in various sectors such as crime and safety, weather, education, economy, infrastructure, industries, real estate, and healthcare. This comparative analysis aims to give a rounded perspective to those considering relocating or visiting either city.
Distance between
Fort Worth, TX and
Chattanooga, TN : 709.6 miles
Fort Worth's population is larger by 414%. Its population has grown by 400,814 people (75.0%) since 2000. The population of Chattanooga has grown by 26,559 people (17.1%) during that time.
Fort Worth has a relatively higher crime rate compared to the national average, with most incidents being property crime. Chattanooga, on the other hand, also has a crime rate higher than the national average, but with a higher proportion of violent crimes. Both cities, however, are undertaking progressive strategies to improve public safety and crime rates. The city government in Fort Worth is heavily investing in law enforcement upgrades, while Chattanooga is focusing more on community-centric crime reduction strategies.
City-data.com crime index counts serious crimes and violent crime more heavily. It adjusts for the number of visitors and daily workers commuting into cities. (higher means more crime, U.S. average = 301.1)
City-data.com crime index counts serious crimes and violent crime more heavily. It adjusts for the number of visitors and daily workers commuting into cities. (higher means more crime, U.S. average = 301.1)
Sex Offenders
According to our data, there are 3,166 registered sex offenders living in Fort Worth and 467 registered sex offenders living in . The ratio of residents to sex offenders in Fort Worth is 270 to 1; the ratio in Chattanooga is 383 to 1. The number of registered sex offenders compared to the number of residents is larger in Fort Worth than in Chattanooga.
Cost of Living
In terms of cost of living, Chattanooga is generally cheaper than Fort Worth. Housing is significantly more affordable in Chattanooga, while healthcare, groceries, and other costs tend to be similar. While Fort Worth still comes under the national average for cost of living, Chattanooga's lower housing costs make it a more affordable choice overall.
Income Tax
Both Texas and Tennessee are known for no state income tax, offering an economic advantage to residents. In Tennessee, however, residents and those with investments will note that there is a tax on interest and dividends income.
Property Tax
Properties in Fort Worth are subject to property tax, with rates being somewhat competitive for Texas, making it slightly more taxing to homeowners compared to Chattanooga, which has lower property taxes due to the lower cost of housing.
Sales Tax
Sales tax in Fort Worth, TX is relatively higher at 8.25% as compared to Chattanooga, TN’s 9.25%. Texas does not impose a state income tax, making it appealing for workers, whereas Tennessee also does not have a state income tax but does tax dividends and interest income.
Income
Type
Fort Worth
Chattanooga
Estimated median household income
$68,235
$55,065
Estimated per capita income
$34,106
$34,297
Cost of living index (U.S. average is 100)
95.4
89.2
If you make $50,000 in Chattanooga, you will have to make $53,475 in Fort Worth to maintain the same standard of living.
Geographical Conditions
Fort Worth is situated in the Prairie and Lakes region of Texas offering mostly flat terrain with scattered hills. Chattanooga, however, lies between the Appalachian Mountains and the Cumberland Plateau, providing various outdoor activities such as hiking, rock climbing, and river activities due to its more diverse topography.
For education, both cities provide extensive public school systems and higher education opportunities, with Fort Worth's public education having a slightly higher rating. There are numerous universities and community colleges in Fort Worth, including Texas Christian University. Chattanooga also boasts well-regarded institutions such as the University of Tennessee at Chattanooga.
Fort Worth has a steadily growing economy centered around industries like aviation, healthcare, and education. Chattanooga's economy is more diversified, with strong sectors in manufacturing, healthcare, and tourism. Both cities have lower unemployment rates compared to the national average, suggesting ample job opportunities.
Biggest Employers
In Fort Worth, major employers include American Airlines, Lockheed Martin, and the healthcare sector's numerous hospitals. Chattanooga's biggest employers are in healthcare - Erlanger Health System, manufacturing - Volkswagen, Amazon and in the public sector, Hamilton County Department of Education.
There were 7,236 building permits issued in Fort Worth in 2012 (4810 more than in 2011) compared to 575 building permits issued in Chattanooga in 2012 (373 more than in 2011).
In Fort Worth (Tarrant County), 41.4% voted for Democrats and 57.1% for Republicans in 2012 Presidential Election. In Chattanooga (Hamilton County), 41.6% voted for Democrats and 56.6% for Republicans.
Elections
Type
Democrats
Republicans
Other
Year
Fort Worth
Chattanooga
Fort Worth
Chattanooga
Fort Worth
Chattanooga
2020
49.3%
44.5%
49.1%
54.2%
1.6%
1.3%
2016
43.2%
39.1%
51.8%
55.6%
5.0%
5.4%
2012
41.4%
41.6%
57.1%
56.6%
1.4%
1.8%
2008
43.8%
43.4%
55.5%
55.2%
0.7%
1.3%
2004
37.0%
41.9%
62.5%
57.4%
0.5%
0.7%
2000
36.9%
43.1%
60.9%
55.5%
2.3%
1.3%
1996
41.6%
22.5%
50.9%
74.2%
7.5%
3.3%
Breakdown of population affiliated with a religious congregation
Type
Adherents
Congregations
Religion
Fort Worth
Chattanooga
Fort Worth
Chattanooga
SOUTHERN BAPTIST CONVENTION
17.3%
21.9%
33.3%
20.5%
CATHOLIC CHURCH
11.1%
3.8%
1.9%
1.1%
MUSLIM ESTIMATE
2.2%
0.6%
0.9%
1.3%
LUTHERAN CHURCH
0.5%
0.4%
0.9%
0.9%
SEVENTH DAY ADVENTIST CHURCH
0.4%
3.1%
1.6%
3.8%
EPISCOPAL CHURCH
0.3%
1.8%
0.8%
2.1%
PRESBYTERIAN CHURCH IN AMERICA
0.1%
2.1%
0.4%
2.3%
CUMBERLAND PRESBYTERIAN CHURCH
0.0%
0.4%
0.3%
0.9%
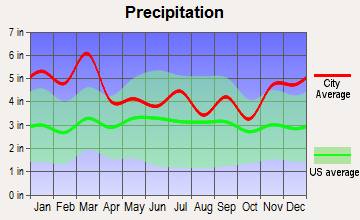
Weather
Weather-wise, Fort Worth is characterized by a humid subtropical climate with long, hot summers and mild winters. Chattanooga experiences a humid subtropical climate as well, but with more variation. Residents and visitors can expect cooler winters and a bit more rainfall spread throughout the year compared to Fort Worth.
Weather and climate
Type
Fort Worth
Chattanooga
Temperature - Average
65°F
60°F
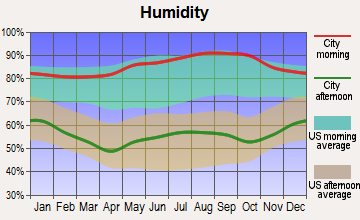
Humidity - Average morning or afternoon humidity
71.4%
76%
Humidity - Differences between morning and afternoon humidity
34.1%
42%
Humidity - Maximum monthly morning or afternoon humidity
82.1%
90%
Humidity - Minimum monthly morning or afternoon humidity
48%
48%
Precipitation - Yearly average
35 in
53.2 in
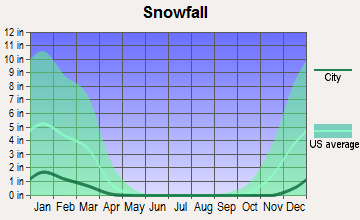
Snowfall - Yearly average
4.2 in
7.8 in
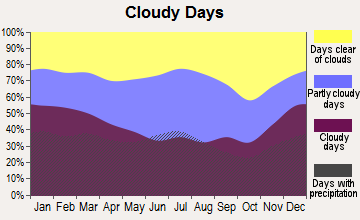
Clouds - Number of days clear of clouds
22.8%
17.3%
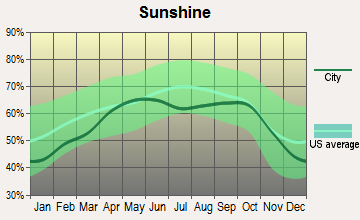
Sunshine amount - Average
66.6%
59.8%
Sunshine amount - Differences during a year
20%
19%
Sunshine amount - Maximum monthly
74%
63%
Sunshine amount - Minimum monthly
54%
44%
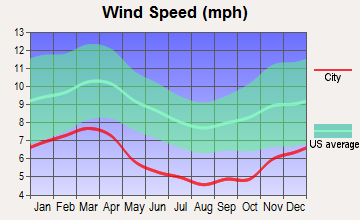
Wind speed - Average
10.3 mph
5.4 mph
Average climate in Fort Worth, Texas
Average climate in Chattanooga, Tennessee
Air pollution
Type
AQI
CO
NO2
OZONE
PM25
SO2
Year
Fort Worth
Chattanooga
Fort Worth
Chattanooga
Fort Worth
Chattanooga
Fort Worth
Chattanooga
Fort Worth
Chattanooga
Fort Worth
Chattanooga
2018
67
68
N/A
N/A
5.8
N/A
27.1
32.2
N/A
9.0
N/A
N/A
2017
67
74
N/A
N/A
6.2
N/A
27.2
32.8
N/A
9.5
N/A
N/A
2016
56
88
N/A
N/A
6.3
N/A
25.5
37.3
N/A
10.4
N/A
N/A
2015
61
76
N/A
N/A
6.5
N/A
24.8
31.5
N/A
9.7
N/A
N/A
2014
56
74
0.22
N/A
6.8
N/A
26.6
33.5
N/A
10.1
N/A
N/A
2013
64
77
0.25
N/A
6.4
N/A
26.5
33.0
N/A
10.2
N/A
N/A
2012
87
89
0.26
N/A
7.8
N/A
30.3
36.1
N/A
11.8
N/A
N/A
2011
79
91
0.23
N/A
7.9
N/A
30.7
35.6
N/A
13.8
N/A
N/A
2010
70
93
0.23
N/A
8.5
N/A
27.7
37.2
N/A
13.2
N/A
N/A
2009
81
81
0.25
N/A
8.7
N/A
29.5
33.0
N/A
11.8
N/A
N/A
2008
69
95
0.25
N/A
9.6
N/A
25.8
37.2
N/A
15.0
N/A
N/A
2007
75
118
0.30
N/A
10.6
N/A
24.6
41.7
N/A
N/A
N/A
N/A
2006
90
99
0.34
N/A
10.2
N/A
29.7
37.4
N/A
N/A
N/A
N/A
2005
102
93
0.34
N/A
10.9
5.5
28.4
34.5
11.3
N/A
0.9
1.5
2004
78
105
0.39
N/A
10.6
N/A
25.4
33.8
N/A
N/A
N/A
N/A
2003
82
95
0.40
N/A
11.1
N/A
27.2
27.2
N/A
N/A
N/A
N/A
2002
94
103
0.37
1.00
11.8
5.1
25.8
30.2
N/A
N/A
N/A
1.4
2001
16
110
0.48
N/A
N/A
N/A
N/A
27.8
N/A
N/A
N/A
N/A
2000
17
132
0.55
N/A
N/A
N/A
N/A
28.8
N/A
N/A
N/A
N/A
Natural disasters
Type
Fort Worth
Chattanooga
Tornado activity compared to U.S. average
249.6%
149.2%
Earthquake activity compared to U.S. average
562.8%
214.8%
Natural disasters compared to U.S. average
23%
17%
Transportation
Fort Worth services residents and visitors with the Trinity Metro public transit system, which links major city areas and suburbs, offering opportunities for efficient commuting. Chattanooga provides an efficient electric shuttle in the downtown area and CARTA buses, alongside bike-sharing program Bike Chattanooga.
Transport
Type
Fort Worth
Chattanooga
Amtrak stations
1
1
Amtrak stations nearby
1
1
FAA registered aircraft
2
145
FAA registered aircraft manufacturers and dealers
19
13
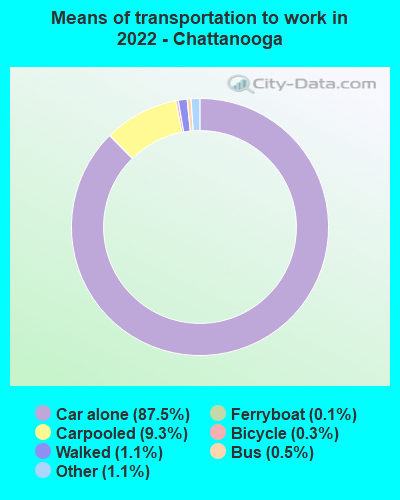
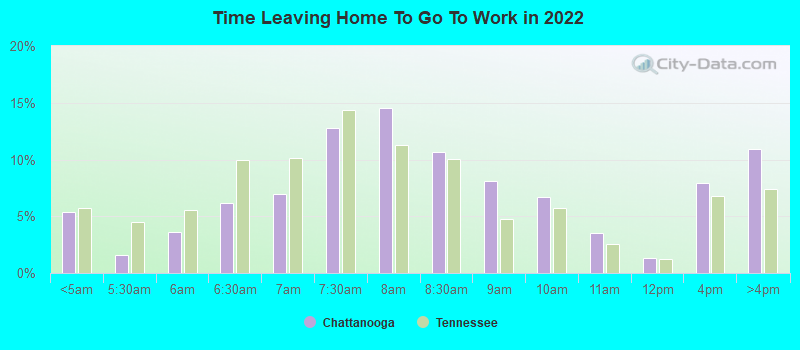
Means of transportation to work
Type
Fort Worth
Chattanooga
Bicycle
0.1%
0.1%
Bus
0.4%
0.4%
Carpooled
11%
8.6%
Car alone
85.8%
89%
Motorcycle
0.1%
0.1%
Taxicab
0.1%
0.4%
Walked
1.3%
1%
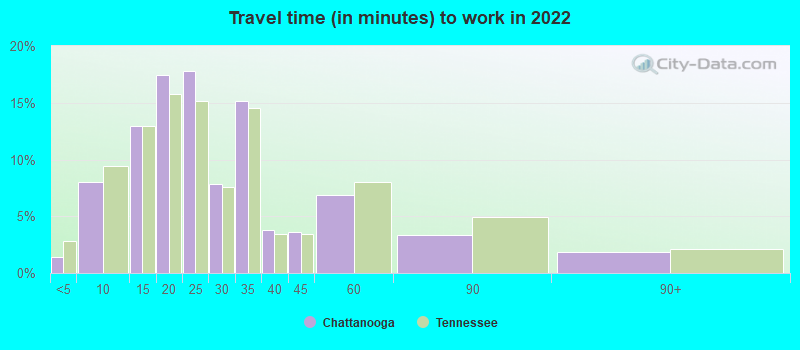
Average travel time to work
Type
Fort Worth
Chattanooga
Average
28.5 min
27.1 min
Other means
25.3 min
20.4 min
Public transportation
41.8 min
34 min
Private vehicle occupancy
Type
Fort Worth
Chattanooga
Average
1.2
1.1
Drove alone
87.6%
91%
In 2 person carpool
8.5%
7.1%
In 3 person carpool
2.5%
1.1%
In 4 person carpool
1.1%
0.5%
In 5-6 person carpool
0.3%
0.1%
How many people usually rode to work in the car, truck or van.
Real Estate
The real estate market in Fort Worth has been growing steadily over the years, with a higher median home price than Chattanooga. Meanwhile, in Chattanooga, lower real estate costs make it an attractive option for those seeking to buy a home or invest in property.
Neighborhoods
Both cities offer a blend of urban and suburban neighborhoods. Fort Worth shines with its diverse neighborhoods such as the historic Stockyards and bustling Downtown. Chattanooga offers charming and scenic neighborhoods like North Shore and St. Elmo, known for their uniqueness and local business scenes.
Houses and residents
Type
Fort Worth
Chattanooga
Houses
361,341
86,385
Average household size (people)
2.8
2.3
Median year apartment built
1991
1979
Median year house/condo built
1995
1970
Length of stay in the house since moving in
11.2 years
13.4 years
Houses occupied
334,286 (92.5%)
77,299 (89.5%)
Houses occupied by owners
185,197 (55.4%)
41,455 (53.6%)
Houses occupied by renters
149,089 (44.6%)
35,844 (46.4%)
Median rent asked for vacant for-rent units
$1,068
$1,964
Median monthly housing costs
$1,328
$1,003
Median price asked for vacant for-sale houses and condos
$288,576
$160,185
Estimated median house or condo value
$249,000
$235,900
Median numbers of rooms
5.3
5.3
Median number of rooms in apartments
4.2
4.1
Median number of rooms in houses and condos
6.3
6.4
Median house price - detached houses
$279,885
$286,715
Median house price - in 2-unit structures
Over $1,000,000
$238,441
Median house price - in 3-to-4-unit structures
$337,081
$232,475
Median house price - in 5 or more unit structures
$298,062
$350,957
Median house price - mobile homes
$58,470
$45,777
Median house price - occupied boats, rvs, vans etc.
$16,069
$513,967
Median house price - Townhouses or other attached units
$279,957
$525,041
Median house price - All housing units
$279,281
$289,858
Median house age
29
47
Renting percentage
40.8%
47.4%
Housing density (houses/condos per square mile)
1,235.2
638.9
House value disparities
31.8%
34%
Household income disparities
43.6%
47%
Median household income for houses/condes with a mortgage
$106,170
$93,442
Median household income for apartments without a mortgage
$72,147
$45,013
Housing units without a mortgage
2,986 (2.4%)
739 (2.9%)
Housing units with both a second mortgage and home equity loan
3,696 (3%)
1,674 (6.6%)
Housing units with a mortgage
121,099 (97.6%)
24,594 (97.1%)
Housing units with a home equity loan
66 (0.1%)
89 (0.4%)
Housing units with a second mortgage
5,171 (4.2%)
2,103 (8.3%)
House/condo owner moved in on average (years ago)
8
11
House/condo renter moved in on average (years ago)
1
1
Housing units lacking complete kitchen facilities
1.8%
3.1%
Housing units lacking complete plumbing facilities
0.7%
2.3%
Housing units in structures
Housing units in structures
Fort Worth
Chattanooga
One, detached
65.4%
60.6%
One, attached
2.9%
3.7%
Two
1.6%
7.1%
3 or 4
4.1%
3.9%
5 to 9
5.8%
4.1%
10 to 19
6.5%
4.8%
20 to 49
4.6%
7.8%
50 or more
7.0%
7.1%
Mobile homes
2.1%
0.8%
Median real estate property taxes paid for housing units
Self-employed workers in own not incorporated business
27,257
3,502
State government workers
8,587
4,173
Unpaid family workers
392
224
Industries and Occupations
Fort Worth's most dominant industries include aviation, education, and healthcare. Jobs in food services and retail are also plentiful. In Chattanooga, manufacturing, healthcare, and tourism hold a significant share of the job market, with a growing tech industry due to its high-speed internet availability.
Fort Worth offers comprehensive healthcare services, with numerous highly-rated hospitals. Chattanooga also provides quality healthcare system with Erlanger Health System, CHI Memorial, and Parkridge Health System as top healthcare providers.
Health (county statistics)
Type
Fort Worth
Chattanooga
General health status score of residents in this county from 1 (poor) to 5 (excellent)
Fort Worth's larger size necessitates a robust infrastructure, complete with a comprehensive road network and public transit systems. Chattanooga has been noted for its "Gig City" status, boasting city-wide high-speed internet, strategic freeway systems, and its unique incline railway as a tourist attraction.
Infrastructure
Type
Fort Worth
Chattanooga
Hospitals
76
23
TV stations
25
14
Arenas or stadiums
7
1
Bank branches located here
175
73
Bank institutions located here
42
14
Main business address for public companies
24
12
Nuclear power plants nearby
0
2
Drinking water stations with no reported violations in the past
3
3
Drinking water stations with reported violations in the past
HMDA - Conventional home purchase loans - Applications denied
Year
Fort Worth
Chattanooga
1999
3,575
893
2000
2,473
823
2001
2,109
614
2002
1,701
548
2003
2,183
603
2004
3,202
741
2005
4,261
874
2006
4,161
964
2007
2,871
638
2008
1,256
230
2009
585
167
Culture and Food
Both cities boast a rich cultural and food scene. Fort Worth is famous for its Western heritage, rodeos, arts scene, and diverse food options ranging from Tex-Mex to barbecue. Chattanooga offers a vibrant art scene, plentiful outdoor activities, and a diverse food scene boasting Southern cuisine and innovative eateries.
Sports Teams
Fort Worth enjoys a vibrant sports environment, being in proximity to Dallas, the city has teams such as the Dallas Cowboys (NFL), Texas Rangers (MLB), and Dallas Mavericks (NBA) which enjoy high local support. Chattanooga has numerous minor league and college sports teams, and while it doesn't have an NFL team, the Tennessee Titans from Nashville get significant support.


 Fort Worth, TX
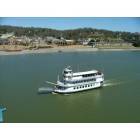
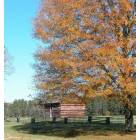
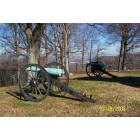
 Chattanooga, TN