Moving or just visiting Fort Worth, Texas, compared to East Seattle, Washington, offers a host of differing experiences, primarily-driven by a unique mixture of location, culture, and economy. Factors such as crime rates and safety, weather, cost of living, education system, work and economy, infrastructure, industries and occupations, real estate market, neighborhoods, public transportation, tax rates, culture and food scenes, sports teams, geographical conditions and health care play significant roles in defining the unique character of these two places. This comparison review offers a detailed understanding of both cities to help you make an informed decision whether to relocate or visit.
Fort Worth generally has higher crime rates than East Seattle. While both cities see their shares of crime, Ft Worth's rates are above the national average, and East Seattle has crime rates below the national average. Therefore, East Seattle is generally considered safer for both residents and tourists.
Cost of Living
The cost of living is lower in Fort Worth compared to East Seattle, making it a more affordable option for those wishing to relocate or visit. Housing is particularly more affordable in Fort Worth, as is the overall day-to-day cost of living.
Income Tax
A huge consideration in the financial aspect is the absence of state income tax in Texas. Washington, however, has no state income tax either. So, this is a tie between the two cities.
Property Tax
Property taxes are higher in Texas and thus in Fort Worth, compared to Washington state. This could somewhat counterbalance the lower housing costs in Fort Worth.
Sales Tax
Texas, including Fort Worth, has a state sales tax, but Washington State has a higher sales tax rate. So, goods and services tend to be cheaper in Fort Worth.
Income
Type
Fort Worth
East Seattle
Estimated median household income
$68,235
$135,835
Estimated per capita income
$34,106
$77,151
Cost of living index (U.S. average is 100)
95.4
128.6
If you make $50,000 in Fort Worth, you will have to make $67,400 in East Seattle to maintain the same standard of living.
Geographical Conditions
Geographically, Fort Worth lies in the flat Texas plains with a warmer climate, while East Seattle, surrounded by water bodies and mountains, has a temperate marine climate, offering more outdoor activities.
Geographical information
Type
Fort Worth
East Seattle
Land area
292.5 sq. miles
217.1 sq. miles
Population density
3,197.9 people per sq. mile
2,361.6 people per sq. mile
Relative area comparison
Fort Worth, TX East Seattle, WA
Education
Regarding education, both Fort Worth and East Seattle have a variety of quality educational institutions. East Seattle, however, being near University of Washington, provides access to a globally-renowned research institution.
Both cities have thriving economies, but their strengths lie in different sectors. Fort Worth’s economy is largely driven by aerospace, technology, healthcare, and logistics, whereas East Seattle's economy relies more on tech, retail, and health.
Biggest Employers
In Fort Worth, the biggest employers are American Airlines, Lockheed Martin, and the NAS Fort Worth Joint Reserve Base. East Seattle, part of the larger Seattle region, boasts Microsoft, Amazon, and Starbucks as major employers.
In Fort Worth (Tarrant County), 41.4% voted for Democrats and 57.1% for Republicans in 2012 Presidential Election. In East Seattle (King County), 69.0% voted for Democrats and 28.5% for Republicans.
Elections
Type
Democrats
Republicans
Other
Year
Fort Worth
East Seattle
Fort Worth
East Seattle
Fort Worth
East Seattle
2020
49.3%
75.1%
49.1%
22.3%
1.6%
2.6%
2016
43.2%
70.0%
51.8%
21.1%
5.0%
8.9%
2012
41.4%
69.0%
57.1%
28.5%
1.4%
2.5%
2008
43.8%
70.2%
55.5%
28.1%
0.7%
1.7%
2004
37.0%
65.1%
62.5%
33.8%
0.5%
1.1%
2000
36.9%
60.3%
60.9%
34.5%
2.3%
5.2%
1996
41.6%
56.4%
50.9%
31.4%
7.5%
12.2%
Breakdown of population affiliated with a religious congregation
Type
Adherents
Congregations
Religion
Fort Worth
East Seattle
Fort Worth
East Seattle
SOUTHERN BAPTIST CONVENTION
17.3%
0.3%
33.3%
3.8%
CATHOLIC CHURCH
11.1%
14.4%
1.9%
4.9%
MUSLIM ESTIMATE
2.2%
0.6%
0.9%
1.4%
LUTHERAN CHURCH
0.5%
0.5%
0.9%
2.0%
SEVENTH DAY ADVENTIST CHURCH
0.4%
0.6%
1.6%
2.3%
EPISCOPAL CHURCH
0.3%
0.8%
0.8%
2.4%
EVANGELICAL LUTHERAN CHURCH IN AMERICA
0.3%
1.3%
0.9%
4.7%
AMERICAN BAPTIST CHURCHES IN THE USA
0.0%
0.6%
0.1%
2.9%
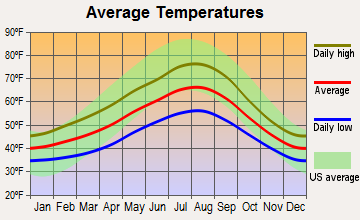
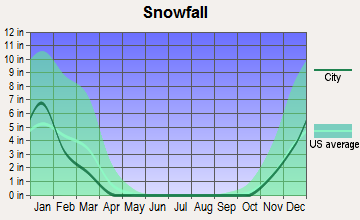
Weather
A significant contrast exists in the weather between these two regions. Fort Worth features hot, humid summers, mild winters, and less rainfall whereas East Seattle tends to be cooler even in summer and gets more rain throughout the year. As such, the weather preference could significantly influence a person's decision to move to or visit these cities.
Weather and climate
Type
Fort Worth
East Seattle
Temperature - Average
65°F
52.5°F
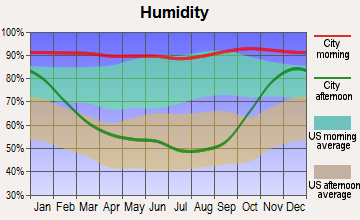
Humidity - Average morning or afternoon humidity
71.4%
78.5%
Humidity - Differences between morning and afternoon humidity
34.1%
38%
Humidity - Maximum monthly morning or afternoon humidity
82.1%
86%
Humidity - Minimum monthly morning or afternoon humidity
48%
48%
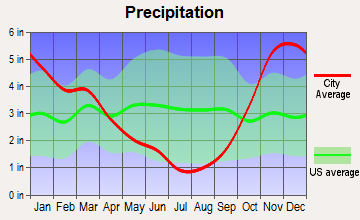
Precipitation - Yearly average
35 in
36.8 in
Snowfall - Yearly average
4.2 in
21.4 in
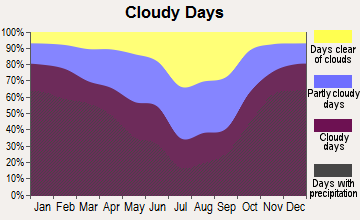
Clouds - Number of days clear of clouds
22.8%
11.7%
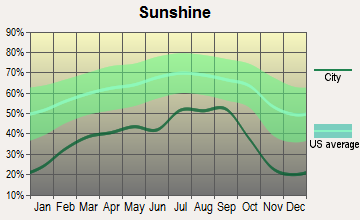
Sunshine amount - Average
66.6%
49.4%
Sunshine amount - Differences during a year
20%
44%
Sunshine amount - Maximum monthly
74%
64%
Sunshine amount - Minimum monthly
54%
20%
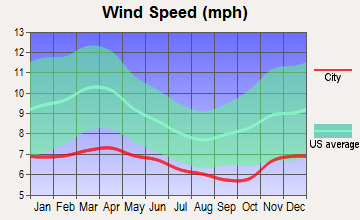
Wind speed - Average
10.3 mph
8.6 mph
Average climate in Fort Worth, Texas
Average climate in East Seattle, Washington
Air pollution
Type
AQI
CO
NO2
OZONE
PB
PM10
PM25
SO2
Year
Fort Worth
East Seattle
Fort Worth
East Seattle
Fort Worth
East Seattle
Fort Worth
East Seattle
East Seattle
East Seattle
Fort Worth
East Seattle
Fort Worth
East Seattle
2018
67
85
N/A
0.21
5.8
10.6
27.1
21.0
N/A
N/A
N/A
N/A
N/A
5.1
N/A
0.7
2017
67
100
N/A
0.23
6.2
11.1
27.2
21.2
N/A
N/A
N/A
N/A
N/A
4.6
N/A
0.3
2016
56
67
N/A
0.22
6.3
11.9
25.5
20.2
N/A
N/A
N/A
N/A
N/A
3.8
N/A
0.6
2015
61
88
N/A
0.23
6.5
10.8
24.8
19.4
N/A
N/A
N/A
N/A
N/A
5.6
N/A
0.8
2014
56
75
0.22
0.24
6.8
11.5
26.6
19.5
N/A
N/A
N/A
N/A
N/A
5.7
N/A
N/A
2013
64
81
0.25
0.24
6.4
N/A
26.5
17.2
N/A
N/A
N/A
N/A
N/A
5.9
N/A
0.8
2012
87
83
0.26
0.23
7.8
N/A
30.3
19.3
N/A
N/A
N/A
N/A
N/A
5.2
N/A
1.0
2011
79
73
0.23
0.24
7.9
N/A
30.7
18.6
N/A
N/A
N/A
N/A
N/A
5.2
N/A
1.1
2010
70
73
0.23
0.24
8.5
N/A
27.7
18.0
N/A
N/A
N/A
N/A
N/A
4.4
N/A
1.1
2009
81
94
0.25
0.27
8.7
N/A
29.5
18.3
N/A
N/A
N/A
N/A
N/A
6.0
N/A
1.4
2008
69
80
0.25
0.30
9.6
N/A
25.8
17.8
N/A
N/A
N/A
N/A
N/A
5.4
N/A
1.3
2007
75
85
0.30
0.30
10.6
N/A
24.6
17.7
N/A
N/A
19.0
N/A
N/A
6.4
N/A
1.5
2006
90
102
0.34
N/A
10.2
N/A
29.7
18.4
N/A
N/A
21.1
N/A
N/A
7.2
N/A
N/A
2005
102
104
0.34
0.80
10.9
18.3
28.4
N/A
N/A
N/A
22.9
N/A
11.3
7.6
0.9
3.5
2004
78
110
0.39
0.81
10.6
17.9
25.4
N/A
N/A
N/A
N/A
N/A
N/A
8.3
N/A
3.0
2003
82
100
0.40
0.85
11.1
18.5
27.2
N/A
N/A
N/A
N/A
N/A
N/A
8.3
N/A
2.4
2002
94
90
0.37
1.07
11.8
19.3
25.8
N/A
N/A
N/A
N/A
N/A
N/A
10.7
N/A
2.7
2001
16
91
0.48
1.08
N/A
20.5
N/A
N/A
0.004
N/A
N/A
N/A
N/A
11.1
N/A
3.7
2000
17
99
0.55
1.21
N/A
20.9
N/A
N/A
N/A
N/A
N/A
N/A
N/A
12.1
N/A
3.2
Natural disasters
Type
Fort Worth
East Seattle
Tornado activity compared to U.S. average
249.6%
5.5%
Earthquake activity compared to U.S. average
562.8%
1,403%
Natural disasters compared to U.S. average
23%
30%
Transportation
East Seattle offers a more robust public transportation network, making commutes easier for residents and tourists alike. Fort Worth, on the other hand, tends to be more car-dependent with a less developed public transit system.
Transport
Type
Fort Worth
East Seattle
Amtrak stations
1
0
Amtrak stations nearby
1
3
FAA registered aircraft
2
0
FAA registered aircraft manufacturers and dealers
19
0
Means of transportation to work
Type
Fort Worth
East Seattle
Bicycle
0.1%
0.3%
Bus
0.4%
5%
Carpooled
11%
11%
Car alone
85.8%
76.3%
Motorcycle
0.1%
0.1%
Walked
1.3%
1.7%
Average travel time to work
Type
Fort Worth
East Seattle
Average
28.5 min
25 min
Real Estate
The real estate market in East Seattle is hotter and pricier than in Fort Worth. It can be more challenging to find affordable housing in East Seattle, whereas there are more options in Fort Worth.
Neighborhoods
Both cities offer a range of neighborhood vibes from vibrant bustling communities to quieter suburban areas. East Seattle has an urban feel with a higher population density, while Fort Worth provides a more spread-out, less crowded living experience.
Houses and residents
Type
Fort Worth
East Seattle
Houses
361,341
199,933
Average household size (people)
2.8
2.5
Houses occupied
334,286 (92.5%)
191,630 (95.8%)
Houses occupied by owners
185,197 (55.4%)
128,209 (66.9%)
Houses occupied by renters
149,089 (44.6%)
63,421 (33.1%)
Median rent asked for vacant for-rent units
$1,068
$2,281
Median price asked for vacant for-sale houses and condos
$288,576
$820,468
Estimated median house or condo value
$249,000
$877,325
Median number of rooms in apartments
4.2
3.5
Median number of rooms in houses and condos
6.3
7.8
Housing density (houses/condos per square mile)
1,235.2
920.9
Household income disparities
43.6%
34.9%
Housing units without a mortgage
2,986 (2.4%)
22,582 (20.8%)
Housing units with both a second mortgage and home equity loan
3,696 (3%)
352 (0.3%)
Housing units with a mortgage
121,099 (97.6%)
85,751 (79.2%)
Housing units with a home equity loan
66 (0.1%)
11,674 (10.8%)
Housing units with a second mortgage
5,171 (4.2%)
9,796 (9%)
Housing units lacking complete kitchen facilities
1.8%
0.8%
Housing units lacking complete plumbing facilities
Self-employed workers in own not incorporated business
27,257
16,907
State government workers
8,587
10,270
Unpaid family workers
392
584
Industries and Occupations
While there's diversity in job opportunities between the two regions, Fort Worth leans more towards manufacturing, aerospace, and logistics occupations, while East Seattle strongly leans towards tech jobs due to the presence of tech giants like Amazon and Microsoft.
Both Fort Worth and East Seattle host many top-class medical facilities. However, Seattle is nationally known for its health research institutes, giving it a slight edge in this category.
Health (county statistics)
Type
Fort Worth
East Seattle
General health status score of residents in this county from 1 (poor) to 5 (excellent)
Fort Worth’s infrastructure combines elements of classic western architecture with modern developments, while East Seattle enjoys advanced urban infrastructure with better sidewalks and bike lanes.
Infrastructure
Type
Fort Worth
East Seattle
TV stations
25
16
Schools
School facilities
Type
Fort Worth
East Seattle
Private elementary/middle schools
22
1
Private high schools
14
1
Public elementary/middle schools
170
2
Public high schools
52
2
Colleges/Universities
13
0
Culture and Food
Both cities have rich cultural scenes but offer different experiences. East Seattle boasts a mix of international cuisine while Fort Worth offers a traditional Texas feel with barbecues and Mexican food dominating the scene.
Sports Teams
For sports fans, both are exciting locations. Fort Worth is close to Dallas, home to several major teams like the Cowboys (NFL) and Mavericks (NBA). East Seattle, part of the larger Seattle metropolitan area, boasts the Seahawks (NFL) and the Mariners (MLB).
 Fort Worth, TX
 East Seattle, WA