Fort Worth, Texas, and Huntsville, Alabama, both offer residents and tourists unique benefits and amenities, depending on one's personal preferences, career pathways, and lifestyle choices. As we compare these two locales, we focus on areas such as crime and safety, weather patterns, the cost of living, education, work and economy, and more. Both cities offer a rich cultural experience, dynamic job markets, and a warm southern hospitality, but they have distinctive features and varying living costs, indicating that the choice between the two may depend largely on personal needs and preferences.
Distance between
Fort Worth, TX and
Huntsville, AL : 631.5 miles
Fort Worth's population is larger by 331%. Its population has grown by 400,814 people (75.0%) since 2000. The population of Huntsville has grown by 58,747 people (37.1%) during that time.
Although neither city is the safest in its respective state, both Fort Worth and Huntsville emphasize community safety and have proactive police departments. Fort Worth's crime rate is somewhat higher than Huntsville's. It's important to note, however, that safety can vary greatly depending on the specific neighborhood in either city.
City-data.com crime index counts serious crimes and violent crime more heavily. It adjusts for the number of visitors and daily workers commuting into cities. (higher means more crime, U.S. average = 301.1)
City-data.com crime index counts serious crimes and violent crime more heavily. It adjusts for the number of visitors and daily workers commuting into cities. (higher means more crime, U.S. average = 301.1)
Sex Offenders
According to our data, there are 3,166 registered sex offenders living in Fort Worth and 157 registered sex offenders living in . The ratio of residents to sex offenders in Fort Worth is 270 to 1; the ratio in Huntsville is 1,250 to 1. The number of registered sex offenders compared to the number of residents is much larger in Fort Worth than that in Huntsville.
Cost of Living
The cost of living in Huntsville is generally lower than in Fort Worth, including aspects such as housing and healthcare. However, Fort Worth offers more diversity in services and amenities, which could result in higher costs in some areas.
Income Tax
Texas, and thereby Fort Worth, has no state income tax. Alabama does have a state income tax, which is a factor Huntsville residents must consider.
Property Tax
In terms of property taxes, Fort Worth has a higher rate than Huntsville. The rates can vary depending on the specific neighborhood and the value of the property.
Sales Tax
Texas has no state income tax, but its sales tax rate is higher than Alabama's. Huntsville, Alabama has a combined state and local sales tax rate that is lower than Fort Worth's.
Income
Type
Fort Worth
Huntsville
Estimated median household income
$68,235
$70,757
Estimated per capita income
$34,106
$42,232
Cost of living index (U.S. average is 100)
95.4
83.8
If you make $50,000 in Huntsville, you will have to make $56,921 in Fort Worth to maintain the same standard of living.
Geographical Conditions
Fort Worth features flat, prairie-like geography, while Huntsville is located in the Tennessee Valley and surrounded by rolling hills.
Both cities are home to reputable schools and institutions. While Fort Worth has more schools overall, Huntsville is internationally recognized for its strong emphasis on STEM education, partly due to the presence of NASA's Marshall Space Flight Center.
Fort Worth's economy is diversified, with sectors ranging from aviation, healthcare, and technology. Huntsville, frequently referred to as "Rocket City," boasts a strong economy with a focus on space technology and defense sectors.
Biggest Employers
In Fort Worth, some of the biggest employers include American Airlines, Lockheed Martin, and the local school district. On the other hand, Redstone Arsenal, NASA's Marshall Space Flight Center, and Huntsville Hospital are some of the largest employers in Huntsville.
There were 7,236 building permits issued in Fort Worth in 2012 (4810 more than in 2011) compared to 1,483 building permits issued in Huntsville in 2012 (465 more than in 2011).
In Fort Worth (Tarrant County), 41.4% voted for Democrats and 57.1% for Republicans in 2012 Presidential Election. In Huntsville (Madison County), 40.2% voted for Democrats and 58.9% for Republicans.
Elections
Type
Democrats
Republicans
Other
Year
Fort Worth
Huntsville
Fort Worth
Huntsville
Fort Worth
Huntsville
2020
49.3%
44.8%
49.1%
52.8%
1.6%
2.4%
2016
43.2%
38.4%
51.8%
54.8%
5.0%
6.8%
2012
41.4%
40.2%
57.1%
58.9%
1.4%
1.0%
2008
43.8%
41.9%
55.5%
56.9%
0.7%
1.2%
2004
37.0%
40.2%
62.5%
59.0%
0.5%
0.8%
2000
36.9%
42.6%
60.9%
54.9%
2.3%
2.5%
1996
41.6%
41.9%
50.9%
50.0%
7.5%
8.1%
Breakdown of population affiliated with a religious congregation
Type
Adherents
Congregations
Religion
Fort Worth
Huntsville
Fort Worth
Huntsville
SOUTHERN BAPTIST CONVENTION
17.3%
19.9%
33.3%
21.8%
CATHOLIC CHURCH
11.1%
4.2%
1.9%
1.4%
MUSLIM ESTIMATE
2.2%
0.3%
0.9%
0.7%
LUTHERAN CHURCH
0.5%
0.3%
0.9%
1.2%
SEVENTH DAY ADVENTIST CHURCH
0.4%
1.9%
1.6%
2.5%
EPISCOPAL CHURCH
0.3%
1.0%
0.8%
1.4%
EVANGELICAL LUTHERAN CHURCH IN AMERICA
0.3%
0.5%
0.9%
0.9%
PRESBYTERIAN CHURCH IN AMERICA
0.1%
0.7%
0.4%
1.4%
AMERICAN BAPTIST CHURCHES IN THE USA
0.0%
0.6%
0.1%
0.2%
Weather
Fort Worth experiences a subtropical climate, with hot summers and mild winters ranging from 37 to 96 degrees throughout the year. On the other hand, Huntsville experiences a humid subtropical climate, with hot, humid summers and mild to cool winters, ranging from 31 to 90 degrees. Both cities experience little snowfall and a good amount of rainfall per year.
Weather and climate
Type
Fort Worth
Huntsville
Temperature - Average
65°F
60.2°F
Humidity - Average morning or afternoon humidity
71.4%
76.7%
Humidity - Differences between morning and afternoon humidity
34.1%
39%
Humidity - Maximum monthly morning or afternoon humidity
82.1%
90%
Humidity - Minimum monthly morning or afternoon humidity
48%
51%
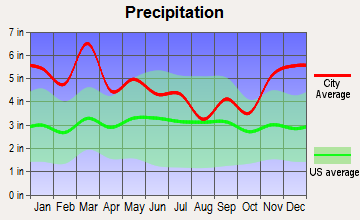
Precipitation - Yearly average
35 in
56.7 in
Snowfall - Yearly average
4.2 in
7.2 in
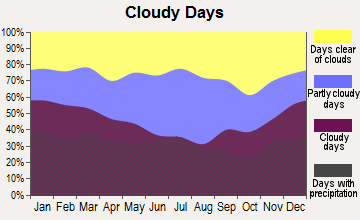
Clouds - Number of days clear of clouds
22.8%
16.7%
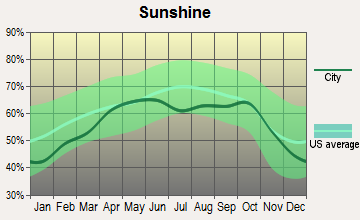
Sunshine amount - Average
66.6%
60.9%
Sunshine amount - Differences during a year
20%
20.2%
Sunshine amount - Maximum monthly
74%
64.5%
Sunshine amount - Minimum monthly
54%
44.3%
Wind speed - Average
10.3 mph
7.8 mph
Average climate in Fort Worth, Texas
Average climate in Huntsville, Alabama
Air pollution
Type
AQI
CO
NO2
OZONE
PM25
SO2
Year
Fort Worth
Huntsville
Fort Worth
Fort Worth
Huntsville
Fort Worth
Huntsville
Fort Worth
Huntsville
Fort Worth
Huntsville
2018
67
66
N/A
N/A
5.8
N/A
27.1
31.9
N/A
9.3
N/A
N/A
2017
67
60
N/A
N/A
6.2
N/A
27.2
30.4
N/A
6.7
N/A
N/A
2016
56
74
N/A
N/A
6.3
N/A
25.5
33.4
N/A
7.8
N/A
N/A
2015
61
67
N/A
N/A
6.5
N/A
24.8
30.2
N/A
7.7
N/A
N/A
2014
56
60
0.22
N/A
6.8
N/A
26.6
31.5
N/A
N/A
N/A
N/A
2013
64
60
0.25
N/A
6.4
N/A
26.5
32.5
N/A
N/A
N/A
N/A
2012
87
81
0.26
N/A
7.8
N/A
30.3
34.0
N/A
N/A
N/A
N/A
2011
79
82
0.23
N/A
7.9
N/A
30.7
33.9
N/A
N/A
N/A
N/A
2010
70
82
0.23
N/A
8.5
N/A
27.7
32.4
N/A
11.1
N/A
N/A
2009
81
73
0.25
N/A
8.7
N/A
29.5
31.3
N/A
12.2
N/A
N/A
2008
69
70
0.25
N/A
9.6
N/A
25.8
30.4
N/A
N/A
N/A
N/A
2007
75
85
0.30
N/A
10.6
N/A
24.6
32.1
N/A
N/A
N/A
N/A
2006
90
84
0.34
N/A
10.2
N/A
29.7
31.1
N/A
N/A
N/A
N/A
2005
102
81
0.34
N/A
10.9
N/A
28.4
28.6
11.3
N/A
0.9
N/A
2004
78
80
0.39
N/A
10.6
N/A
25.4
28.1
N/A
N/A
N/A
N/A
2003
82
82
0.40
N/A
11.1
5.3
27.2
27.5
N/A
N/A
N/A
1.6
2002
94
83
0.37
N/A
11.8
N/A
25.8
26.6
N/A
N/A
N/A
N/A
2001
16
80
0.48
N/A
N/A
N/A
N/A
27.3
N/A
N/A
N/A
N/A
2000
17
95
0.55
N/A
N/A
N/A
N/A
29.5
N/A
N/A
N/A
N/A
Natural disasters
Type
Fort Worth
Huntsville
Tornado activity compared to U.S. average
249.6%
246.2%
Earthquake activity compared to U.S. average
562.8%
262.1%
Natural disasters compared to U.S. average
23%
17%
Transportation
Fort Worth's transportation system is more developed and extensive, including a robust bus system and a commuter rail system. Though smaller, Huntsville’s public transportation includes buses and shuttle services.
Transport
Type
Fort Worth
Huntsville
Amtrak stations
1
0
Amtrak stations nearby
1
0
FAA registered aircraft
2
280
FAA registered aircraft manufacturers and dealers
19
5
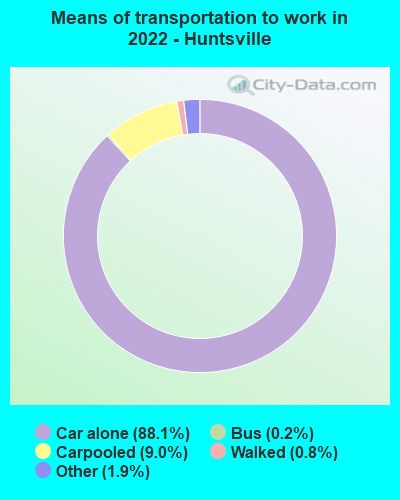
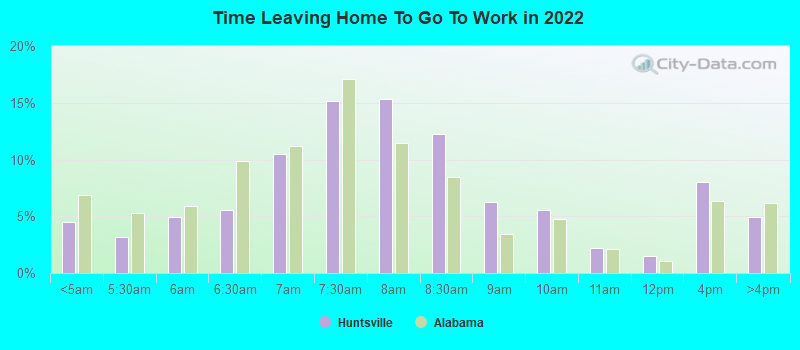
Means of transportation to work
Type
Fort Worth
Huntsville
Bicycle
0.1%
0.1%
Bus
0.4%
0.2%
Carpooled
11%
6.5%
Car alone
85.8%
91.5%
Motorcycle
0.1%
0%
Taxicab
0.1%
0.2%
Walked
1.3%
0.9%
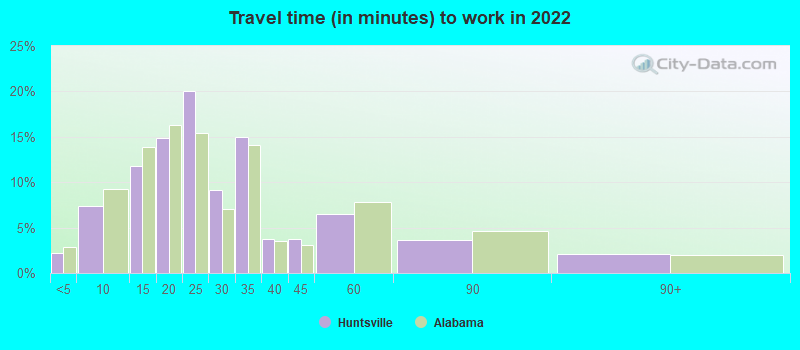
Average travel time to work
Type
Fort Worth
Huntsville
Average
28.5 min
28.5 min
Other means
25.3 min
19.3 min
Public transportation
41.8 min
31.7 min
Private vehicle occupancy
Type
Fort Worth
Huntsville
Average
1.2
1.1
Drove alone
87.6%
93.2%
In 2 person carpool
8.5%
4.7%
In 3 person carpool
2.5%
1.3%
In 4 person carpool
1.1%
0.6%
In 5-6 person carpool
0.3%
0.2%
How many people usually rode to work in the car, truck or van.
Real Estate
While both cities provide affordable housing options relative to national averages, real estate in Huntsville is less expensive than in Fort Worth. However, both cities have seen an increase in housing prices due to a recent influx of new residents.
Neighborhoods
Fort Worth boasts culturally diverse and historic neighborhoods, while Huntsville is notable for its unique mix of traditional Southern charm and high-tech living reflected in its neighborhoods.
Houses and residents
Type
Fort Worth
Huntsville
Houses
361,341
104,141
Average household size (people)
2.8
2.3
Median year apartment built
1991
1985
Median year house/condo built
1995
1983
Length of stay in the house since moving in
11.2 years
12.6 years
Houses occupied
334,286 (92.5%)
96,551 (92.7%)
Houses occupied by owners
185,197 (55.4%)
59,015 (61.1%)
Houses occupied by renters
149,089 (44.6%)
37,536 (38.9%)
Median rent asked for vacant for-rent units
$1,068
$1,286
Median monthly housing costs
$1,328
$935
Median price asked for vacant for-sale houses and condos
$288,576
$246,721
Estimated median house or condo value
$249,000
$250,400
Median numbers of rooms
5.3
6
Median number of rooms in apartments
4.2
4.3
Median number of rooms in houses and condos
6.3
7.3
Median house price - detached houses
$279,885
$257,633
Median house price - in 2-unit structures
Over $1,000,000
$66,368
Median house price - in 3-to-4-unit structures
$337,081
$111,845
Median house price - in 5 or more unit structures
$298,062
$246,169
Median house price - mobile homes
$58,470
$113,555
Median house price - occupied boats, rvs, vans etc.
$16,069
$12,217
Median house price - Townhouses or other attached units
$279,957
$196,303
Median house price - All housing units
$279,281
$253,177
Median house age
29
39
Renting percentage
40.8%
42%
Housing density (houses/condos per square mile)
1,235.2
598.4
House value disparities
31.8%
36.8%
Household income disparities
43.6%
45%
Median household income for houses/condes with a mortgage
$106,170
$100,571
Median household income for apartments without a mortgage
$72,147
$69,689
Housing units without a mortgage
2,986 (2.4%)
806 (2.3%)
Housing units with both a second mortgage and home equity loan
3,696 (3%)
2,456 (6.9%)
Housing units with a mortgage
121,099 (97.6%)
35,004 (97.7%)
Housing units with a home equity loan
66 (0.1%)
0 (0%)
Housing units with a second mortgage
5,171 (4.2%)
2,651 (7.4%)
House/condo owner moved in on average (years ago)
8
10
House/condo renter moved in on average (years ago)
1
1
Housing units lacking complete kitchen facilities
1.8%
2%
Housing units lacking complete plumbing facilities
0.7%
1.1%
Housing units in structures
Housing units in structures
Fort Worth
Huntsville
One, detached
65.4%
67.1%
One, attached
2.9%
3.5%
Two
1.6%
2.0%
3 or 4
4.1%
5.2%
5 to 9
5.8%
6.3%
10 to 19
6.5%
6.6%
20 to 49
4.6%
3.2%
50 or more
7.0%
5.3%
Mobile homes
2.1%
0.9%
Median real estate property taxes paid for housing units
Self-employed workers in own not incorporated business
27,257
5,111
State government workers
8,587
4,814
Unpaid family workers
392
668
Industries and Occupations
While Fort Worth boasts a diverse range of industries, including manufacturing, financial services, and logistics, Huntsville is known for its concentration in the aerospace and defense industries.
Both cities are served by multiple hospitals and healthcare facilities. Fort Worth has a larger number of healthcare providers due to its size, while Huntsville has a notable presence of high-tech medical research facilities.
Health (county statistics)
Type
Fort Worth
Huntsville
General health status score of residents in this county from 1 (poor) to 5 (excellent)
Both cities have invested heavily in infrastructure over the years. Fort Worth's infrastructure is more developed due to its population and size. However, Huntsville has seen recent growth and development, including new parks, recreational facilities, and improvement in public services.
Infrastructure
Type
Fort Worth
Huntsville
Hospitals
76
10
TV stations
25
9
Arenas or stadiums
7
1
Bank branches located here
175
62
Bank institutions located here
42
20
Main business address for public companies
24
3
Drinking water stations with no reported violations in the past
3
3
Drinking water stations with reported violations in the past
HMDA - Conventional home purchase loans - Applications denied
Year
Fort Worth
Huntsville
1999
3,575
536
2000
2,473
393
2001
2,109
234
2002
1,701
259
2003
2,183
261
2004
3,202
393
2005
4,261
556
2006
4,161
607
2007
2,871
425
2008
1,256
178
2009
585
104
Culture and Food
Fort Worth offers a taste of Texas culture with cowboy heritage, while Huntsville mixes Southern hospitality with a strong tech-savvy, space-oriented influence. Both cities offer a blend of cuisines reflective of their cultural diversity.
Sports Teams
Fort Worth, being part of the Dallas-Fort Worth metroplex, offers more professional sports opportunities. Huntsville, although not home to any major league teams, has minor league baseball and hockey franchises, and residents enthusiastically support local college football.


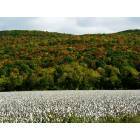

 Fort Worth, TX
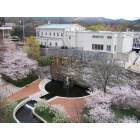
 Huntsville, AL