Fort Worth, TX vs Knoxville, TN - Advanced U.S. city comparison tool

Fort Worth, TX vs Knoxville, TN

Choosing between Fort Worth, Texas, and Knoxville, Tennessee, can be a tough decision as both cities have unique advantages. Each city offers a different living experience, a variety of job opportunities, distinctive cultural activities, and varied tax structures. While Fort Worth tends to be more diverse and dynamic with a stronger local economy, Knoxville is renowned for its stunning landscapes and lower cost of living. Let’s delve deeper into these comparisons to make an informed decision.
 
 
Distance between Fort Worth, TX and Knoxville, TN : 795.1 miles

Fort Worth's population is larger by 386%. Its population has grown by 400,814 people (75.0%) since 2000. The population of Knoxville has grown by 18,758 people (10.8%) during that time.

Population
Type Fort Worth Knoxville
Population 935,508 192,648
Female / male percentage 52.2% / 47.8%
52.2%
47.8%
50.8% / 49.2%
50.8%
49.2%
Racial makeup - percentage
Ethnicity Fort WorthKnoxville
White Non-Hispanic 37.2% 71.7%
Hispanic 34.0% 6.7%
Black 20.7% 12.8%
Asian 4.5% 1.7%
Two or more 3.1% 6.5%
American Indian 0.1% 0.1%
Racial makeup - absolute values
Ethnicity Fort WorthKnoxville
White Non-Hispanic 349,535 138,128
Hispanic 319,731 12,977
Black 194,203 24,571
Asian 42,468 3,264
Two or more 29,125 12,601
American Indian 899 162
Pacific Islander 502 0

Crime and Safety

While both Fort Worth and Knoxville are relatively safe cities, they have different crime rates. Fort Worth, TX, has a slightly higher-than-average crime rate compared to the rest of the country, but the majority of these are property crimes rather than violent crimes. Knoxville, on the other hand, has a below-average crime rate which contributes to its reputation as a safe, family-friendly city.

Crime by year per 100,000 residents
Type City-data.com crime indexRobberies per 100,000Murders per 100,000Rapes per 100,000Assaults per 100,000Burglaries per 100,000Theft per 100,000Auto theft per 100,000Arson per 100,000
Year Fort WorthKnoxvilleFort WorthKnoxvilleFort WorthKnoxvilleFort WorthKnoxvilleFort WorthKnoxvilleFort WorthKnoxvilleFort WorthKnoxvilleFort WorthKnoxvilleFort WorthKnoxville
2020 303.1 460.5 93.3 127.7 11.8 20.1 48.0 65.7 387.9 596.3 366.9 572.4 1,988.9 3,060.9 377.4 594.7 15.2 7.4
2019 282.7 422.5 106.4 122.4 7.5 11.7 55.2 72.6 280.0 453.2 429.4 614.8 1,904.0 3,222.6 366.6 521.6 9.8 5.3
2018 304.4 467.5 125.3 132.5 6.2 10.6 60.1 70.0 316.0 589.4 505.3 730.4 2,028.7 3,391.4 333.9 573.5 15.7 4.8
2017 344.6 544.7 147.9 197.8 8.1 17.6 71.1 78.9 339.6 600.9 587.0 888.3 2,328.0 4,010.4 311.5 553.0 17.3 6.4
2016 333.4 539.4 136.8 216.5 7.6 9.6 62.3 85.2 323.3 585.8 624.6 986.7 2,408.9 4,090.9 281.5 463.6 16.7 10.2
2015 345.2 571.3 118.2 204.7 6.7 11.9 65.0 94.3 338.2 614.6 725.1 1,029.4 2,599.4 4,577.2 273.9 408.3 17.2 8.6
2014 378.4 565.0 141.6 224.0 6.6 6.5 70.8 73.8 339.0 571.2 885.8 1,072.3 2,822.3 5,005.9 292.5 453.5 19.0 6.5
2013 398.1 559.7 159.3 226.5 6.2 9.8 67.4 78.6 329.8 528.2 1,052.9 1,242.0 2,997.6 4,606.8 304.9 404.9 19.6 12.0
2012 389.8 615.5 166.2 290.3 6.0 9.9 50.8 65.3 364.8 606.3 1,096.6 1,584.1 2,812.6 4,604.0 314.8 501.5 15.3 12.6
2011 416.7 619.0 167.4 310.8 6.7 10.0 46.8 56.5 384.1 567.4 1,329.7 1,410.6 2,994.2 5,281.8 323.6 464.3 18.9 16.1
2010 416.4 632.1 179.4 349.4 8.5 8.4 43.8 72.1 348.5 558.5 1,262.1 1,525.1 3,145.5 4,953.2 332.7 453.4 18.6 28.5
2009 432.4 627.8 200.3 355.7 6.1 11.8 52.4 78.6 328.0 613.4 1,408.7 1,395.7 3,261.6 4,626.3 295.0 364.3 29.0 38.7
2008 456.5 659.9 243.2 361.9 7.0 15.7 53.2 76.4 356.3 626.9 1,285.8 1,445.6 3,359.5 4,563.9 391.7 620.4 30.8 57.4
2007 478.9 678.9 242.0 372.0 8.6 14.7 50.1 62.7 366.8 677.5 1,343.8 1,367.6 3,726.9 4,918.2 405.3 745.7 33.8 55.6
2006 480.7 590.8 221.1 294.9 7.8 9.9 39.1 49.9 389.4 686.9 1,401.8 1,257.5 3,753.5 4,227.0 516.6 601.9 36.3 62.5
2005 448.5 435.7 224.9 306.1 9.8 13.3 50.7 54.4 353.8 593.9 1,416.0 1,379.5 4,045.7 4,155.8 605.8 680.6 46.1 76.1
2004 462.4 439.8 237.8 298.2 8.7 12.6 48.4 45.7 341.0 589.0 1,440.3 1,439.1 4,452.8 4,288.3 610.3 781.6 41.3 97.7
2003 468.2 430.0 253.7 254.9 9.9 10.3 42.2 46.9 345.1 660.6 1,524.8 1,337.2 4,353.7 4,141.3 633.1 805.2 42.2 78.3

City-data.com crime index counts serious crimes and violent crime more heavily. It adjusts for the number of visitors and daily workers commuting into cities. (higher means more crime, U.S. average = 301.1)


Crime per year
Type City-data.com crime indexRobberiesMurdersRapesAssaultsBurglariesTheftAuto theftArson
Year Fort WorthKnoxvilleFort WorthKnoxvilleFort WorthKnoxvilleFort WorthKnoxvilleFort WorthKnoxvilleFort WorthKnoxvilleFort WorthKnoxvilleFort WorthKnoxvilleFort WorthKnoxville
2019 282.7 422.5 974 231 69 22 505 137 2,563 855 3,930 1,160 17,426 6,080 3,355 984 90 10
2018 304.4 467.5 1,120 250 55 20 537 132 2,824 1,112 4,516 1,378 18,132 6,398 2,984 1,082 140 9
2017 344.6 544.7 1,291 371 71 33 621 148 2,965 1,127 5,125 1,666 20,325 7,521 2,720 1,037 151 12
2016 333.4 539.4 1,165 404 65 18 531 159 2,754 1,093 5,321 1,841 20,520 7,633 2,398 865 142 19
2015 345.2 571.3 981 380 56 22 539 175 2,806 1,141 6,016 1,911 21,568 8,497 2,273 758 143 16
2014 378.4 565.0 1,140 413 53 12 570 136 2,729 1,053 7,130 1,977 22,717 9,229 2,354 836 153 12
2013 398.1 559.7 1,257 415 49 18 532 144 2,602 968 8,308 2,276 23,652 8,442 2,406 742 155 22
2012 389.8 615.5 1,280 529 46 18 391 119 2,809 1,105 8,445 2,887 21,660 8,391 2,424 914 118 23
2011 416.7 619.0 1,267 561 51 18 354 102 2,907 1,024 10,063 2,546 22,660 9,533 2,449 838 143 29
2010 416.4 632.1 1,330 625 63 15 325 129 2,583 999 9,355 2,728 23,315 8,860 2,466 811 138 51
2009 432.4 627.8 1,449 661 44 22 379 146 2,373 1,140 10,191 2,594 23,596 8,598 2,134 677 210 72
2008 456.5 659.9 1,706 668 49 29 373 141 2,499 1,157 9,018 2,668 23,562 8,423 2,747 1,145 216 106
2007 478.9 678.9 1,623 682 58 27 336 115 2,460 1,242 9,013 2,507 24,996 9,016 2,718 1,367 227 102
2006 480.7 590.8 1,419 538 50 18 251 91 2,499 1,253 8,996 2,294 24,088 7,711 3,315 1,098 233 114
2005 448.5 435.7 1,379 551 60 24 311 98 2,170 1,069 8,684 2,483 24,811 7,480 3,715 1,225 283 137
2004 462.4 439.8 1,415 522 52 22 288 80 2,029 1,031 8,569 2,519 26,492 7,506 3,631 1,368 246 171
2003 468.2 430.0 1,462 446 57 18 243 82 1,989 1,156 8,788 2,340 25,092 7,247 3,649 1,409 243 137

City-data.com crime index counts serious crimes and violent crime more heavily. It adjusts for the number of visitors and daily workers commuting into cities. (higher means more crime, U.S. average = 301.1)

Sex Offenders

According to our data, there are 3,166 registered sex offenders living in Fort Worth and 612 registered sex offenders living in .
The ratio of residents to sex offenders in Fort Worth is 270 to 1; the ratio in Knoxville is 304 to 1.
The number of registered sex offenders compared to the number of residents in Fort Worth is near to than in Knoxville.

Cost of Living

While both cities offer an affordable cost of living compared to many U.S cities, Knoxville's lower living expenses stand out. The cost of living in Knoxville is significantly lower primarily due to the affordability of housing. However, Fort Worth also offers a reasonably affordable lifestyle, particularly for families and retirees.

Income Tax

In terms of state income tax, Texas, including Fort Worth, does not have a state income tax. Conversely, Tennessee implemented an income tax only on certain interest and dividend income but abolished it entirely as of 2021.

Property Tax

Property taxes in Fort Worth tend to be higher compared to Knoxville. Texas has some of the highest property tax rates in the country, although they vary by county. Tennessee, including Knoxville, has lower property tax rates on average.

Sales Tax

The sales tax in Fort Worth is notably higher than Knoxville's. Texas has a state sales tax of 6.25%, with an overall rate of 8.25% in Fort Worth. Tennessee has a sales tax rate of 7%, with Knoxville levying an additional 2.25%.
Income
Type Fort Worth Knoxville
Estimated median household income $68,235 $45,700
Estimated per capita income $34,106 $31,855
Cost of living index (U.S. average is 100) 95.4 86.5

If you make $50,000 in Knoxville, you will have to make $55,145 in Fort Worth to maintain the same standard of living.

Geographical Conditions

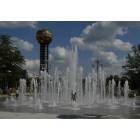
Geographically, Fort Worth is part of the Texas Plains, known for its flat landscape. The city of Knoxville is surrounded by the Great Smoky Mountains and the Tennessee River, offering plenty of opportunities for outdoor adventures.
Geographical information
Type Fort Worth Knoxville
Land area 292.5 sq. miles 92.7 sq. miles
Population density 3,197.9 people per sq. mile 2,079.1 people per sq. mile
Elevation 612 feet 889 feet
Relative area comparison
Fort Worth, TX Knoxville, TN
First ancestry reported - percentage
Ancestry Fort WorthKnoxville
English 3.9% 7.7%
German 3.2% 5.4%
Irish 2.5% 6.4%
Italian 0.8% 1.7%
Scottish 0.8% 1.3%
French 0.5% 0.5%
Polish 0.5% 1.0%
Scotch-Irish 0.5% 2.9%
Czech 0.3% 0.1%
Dutch 0.3% 0.5%
Norwegian 0.3% 0.4%
Greek 0.2% 0.4%
French Canadian 0.1% 0.2%
Welsh 0.1% 0.5%
Russian 0.0% 0.4%
Ukrainian 0.0% 0.5%
Population origin - absolute values
Ancestry Fort WorthKnoxville
English 21,913 7,434
German 18,081 5,207
Irish 14,157 6,111
Italian 4,742 1,588
Scottish 4,345 1,238
Scotch-Irish 2,913 2,761
French 2,836 514
Polish 2,749 987
Norwegian 1,781 415
Dutch 1,609 437
Czech 1,503 81
Greek 900 418
Swedish 821 84
Arab 804 25
French Canadian 709 198
Welsh 562 499
Portuguese 559 37
Hungarian 419 126
Danish 365 41
Swiss 317 126
Foreign born residents - absolute values
Type Count
Region Fort WorthKnoxville
All 157,365 12,275
Africa 12,444 1,534
Asia 34,485 3,949
Europe 5,131 1,758
Latin America 100,122 4,874
North America 1,491 229
Oceania 383 35
Foreign born residents - percentage
Type Percentage
Region Fort WorthKnoxville
All 17.0% 6.3%
Africa 1.3% 0.8%
Asia 3.7% 2.0%
Europe 0.6% 0.9%
Latin America 10.8% 2.5%
North America 0.2% 0.1%

Education

Both cities have robust educational systems. Fort Worth is home to Texas Christian University, while Knoxville boasts the University of Tennessee. Primary and secondary education in both cities are highly rated with multiple school districts and various public and private school options.
School enrollment
Type Fort Worth Knoxville
Nursery, preschool 8,940 (3.4%) 1,837 (3.6%)
Kindergarten 15,153 (5.8%) 2,219 (4.3%)
Grade 1 to 4 57,106 (22%) 5,771 (11.3%)
Grade 5 to 8 58,039 (22.4%) 7,159 (14%)
Grade 9 to 12 57,755 (22.3%) 7,707 (15%)
College undergrad 46,930 (18.1%) 22,524 (44%)
Graduate or professional 15,617 (6%) 4,011 (7.8%)
Students in private schools - absolute values
Type Count
Grade Fort WorthKnoxville
Grades 1 to 8 (elementary and middle school) 9,470 1,897
Grades 9 to 12 (high school) 5,628 528
Undergraduate colleges 14,227 2,024
Students in private schools - percentage
Type Percentage
Grade Fort WorthKnoxville
Grades 1 to 8 (elementary and middle school) 8.2% 14.7%
Grades 9 to 12 (high school) 9.7% 6.9%
Undergraduate colleges 30.3% 9.0%
Educational attainment
Type Fort Worth Knoxville
Less than high school 16.6% 10.1%
High school or equiv. 23.8% 25%
Less than 1 year of college 5.7% 5.6%
1 or more years of college 15.1% 15.1%
Associate degree 7.1% 9%
Bachelor's degree 20.2% 21.7%
Master's degree 8.8% 8.2%
Profess. school degree 1.5% 3%
Doctorate degree 1.1% 2.3%
Education level (25-year-olds and older)
Type Fort Worth Knoxville
Bachelor's degree or higher 31.6% 35.2%
Graduate or professional degree 11.5% 13.5%
High school or higher 83.4% 89.9%

Work and Economy

Fort Worth’s economy is highly diversified, with strengths in sectors like aviation, healthcare, and oil and gas while Knoxville has significant sectors like manufacturing, education, and retail. Both cities also possess robust employment markets with plenty of opportunities for job seekers.

Biggest Employers

The biggest employers in Fort Worth are American Airlines, Lockheed Martin, and BNSF Railway. In Knoxville, major employers include Covenant Health, the University of Tennessee, and the Tennessee Valley Authority.
Employment and residency - absolute values
Kind Fort WorthKnoxville
Work and live in this city 144,032 61,057
Work and live in this county 376,153 82,631
Workers who work outside the city they live in 390,662 112,833
Workers who work outside the county they live in 72,143 12,160
Working at home 68,596 10,446
Not working at home 379,700 84,345
Daytime population change due to commuting 74,826 80,035
Employment and residency - percentage
Kind Fort WorthKnoxville
Work and live in this city 61.1% 77.2%
Work and live in this county 83.9% 87.2%
Workers who work outside the city they live in 38.9% 22.8%
Workers who work outside the county they live in 16.1% 12.8%
Working at home 15.3% 11.0%
Not working at home 84.7% 89.0%
Daytime population change due to commuting 14.0% 46.0%
Geographical mobility: all
Type all
Mobility Fort WorthKnoxville
Same house 1 year ago 86.1% 80.9%
Moved from abroad 0.6% 0.3%
Moved within same county 8.4% 10.0%
Moved from different state 2.1% 3.8%
Moved within same state 2.8% 5.0%
Geographical mobility: Asian
Type Asian
Mobility Fort WorthKnoxville
Same house 1 year ago 85.1% 67.3%
Moved from abroad 1.1% 7.1%
Moved within same county 7.8% 18.0%
Moved from different state 3.0% 7.6%
Moved within same state 3.0% 0%
Geographical mobility: Black
Type Black
Mobility Fort WorthKnoxville
Same house 1 year ago 86.4% 93.6%
Moved from abroad 0.8% 0.1%
Moved within same county 10.3% 2.1%
Moved from different state 0.7% 2.5%
Moved within same state 1.7% 1.7%
Geographical mobility: White
Type White
Mobility Fort WorthKnoxville
Same house 1 year ago 87.3% 80.9%
Moved from abroad 0.2% 0.1%
Moved within same county 6.8% 9.4%
Moved from different state 2.6% 3.9%
Moved within same state 3.2% 5.6%
Building permits
Type Average valueCount
City Fort WorthKnoxvilleFort WorthKnoxville
1997 $123,200 $48,300 1,902 633
1998 $118,400 $58,800 2,712 523
1999 $97,000 $67,000 3,178 422
2000 $99,000 $67,200 3,854 423
2001 $106,200 $87,100 5,026 336
2002 $118,600 $76,400 6,649 327
2003 $112,300 $69,600 7,289 438
2004 $122,700 $87,400 8,693 728
2005 $129,000 $88,200 10,046 808
2006 $140,800 $106,800 8,963 702
2007 $148,200 $97,000 5,669 627
2008 $145,600 $105,300 3,790 241
2009 $139,600 $77,000 3,070 194
2010 $146,800 $100,500 2,759 192
2011 $156,200 $114,600 2,426 167
2012 $161,100 $128,800 2,716 143
2013 $173,000 $125,400 3,321 212
2014 $172,600 $122,500 3,121 181
2015 $223,800 $154,000 3,416 240
2016 $176,300 $187,600 3,459 321
2017 $185,200 $168,300 5,042 235
2018 $173,500 $155,400 5,477 335
2019 $194,800 $164,000 5,063 430
2020 $174,700 $197,200 7,286 310
2021 $196,300 $199,100 7,236 261

There were 7,236 building permits issued in Fort Worth in 2012 (4810 more than in 2011) compared to 261 building permits issued in Knoxville in 2012 (94 more than in 2011).

In Fort Worth (Tarrant County), 41.4% voted for Democrats and 57.1% for Republicans in 2012 Presidential Election. In Knoxville (Knox County), 34.5% voted for Democrats and 63.7% for Republicans.

Elections
Type DemocratsRepublicansOther
Year Fort WorthKnoxvilleFort WorthKnoxvilleFort WorthKnoxville
2020 49.3% 41.8% 49.1% 56.9% 1.6% 1.3%
2016 43.2% 34.9% 51.8% 58.8% 5.0% 6.3%
2012 41.4% 34.5% 57.1% 63.7% 1.4% 1.8%
2008 43.8% 37.8% 55.5% 60.9% 0.7% 1.3%
2004 37.0% 37.0% 62.5% 62.1% 0.5% 0.9%
2000 36.9% 40.6% 60.9% 57.9% 2.3% 1.5%
1996 41.6% 22.6% 50.9% 74.4% 7.5% 3.0%
Breakdown of population affiliated with a religious congregation
Type AdherentsCongregations
Religion Fort WorthKnoxvilleFort WorthKnoxville
SOUTHERN BAPTIST CONVENTION 17.3% 29.7% 33.3% 32.9%
CATHOLIC CHURCH 11.1% 5.1% 1.9% 1.3%
MUSLIM ESTIMATE 2.2% 0.2% 0.9% 0.5%
LUTHERAN CHURCH 0.5% 0.4% 0.9% 0.5%
SEVENTH DAY ADVENTIST CHURCH 0.4% 0.3% 1.6% 1.3%
EPISCOPAL CHURCH 0.3% 1.0% 0.8% 1.4%
EVANGELICAL LUTHERAN CHURCH IN AMERICA 0.3% 0.5% 0.9% 0.9%
PRESBYTERIAN CHURCH IN AMERICA 0.1% 0.4% 0.4% 0.7%
CUMBERLAND PRESBYTERIAN CHURCH 0.0% 0.5% 0.3% 1.3%

Weather

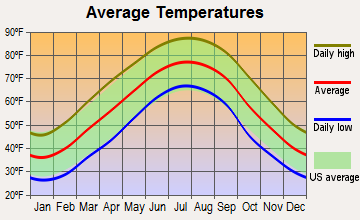
Weather in Fort Worth is generally warmer with less humidity compared to Knoxville. Fort Worth experiences a more extensive heat period in the summer compared to Knoxville. Knoxville, however, has a typical 4-season climate, which includes mild winters and hot, humid summers.
Weather and climate
Type Fort Worth Knoxville
Temperature - Average 65°F 57.4°F
Humidity - Average morning or afternoon humidity 71.4% 76.7%
Humidity - Differences between morning and afternoon humidity 34.1% 39%
Humidity - Maximum monthly morning or afternoon humidity 82.1% 90%
Humidity - Minimum monthly morning or afternoon humidity 48% 51%
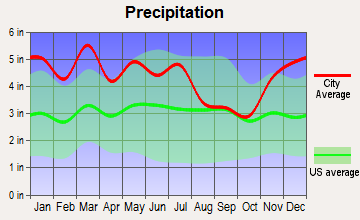
Precipitation - Yearly average 35 in 52.1 in
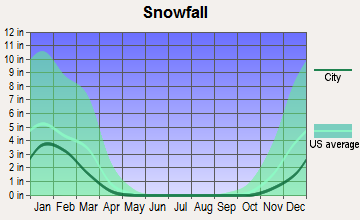
Snowfall - Yearly average 4.2 in 18 in
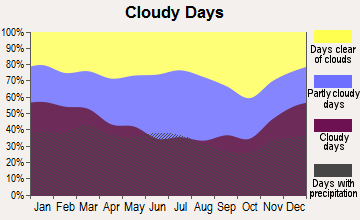
Clouds - Number of days clear of clouds 22.8% 16.8%
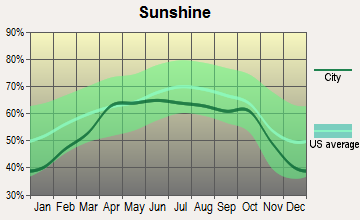
Sunshine amount - Average 66.6% 62.4%
Sunshine amount - Differences during a year 20% 26%
Sunshine amount - Maximum monthly 74% 67%
Sunshine amount - Minimum monthly 54% 41%
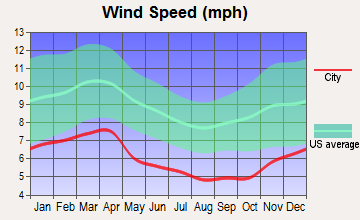
Wind speed - Average 10.3 mph 6.5 mph

Average climate in Fort Worth, Texas

Chicago, Illinois average temperatures Chicago, Illinois average precipitation Chicago, Illinois humidity Chicago, Illinois wind speed Chicago, Illinois snowfall Chicago, Illinois sunshine Chicago, Illinois clear and cloudy days
 

Average climate in Knoxville, Tennessee

Chicago, Illinois average temperatures Chicago, Illinois average precipitation Chicago, Illinois humidity Chicago, Illinois wind speed Chicago, Illinois snowfall Chicago, Illinois sunshine Chicago, Illinois clear and cloudy days
 

Air pollution
Type AQICONO2OZONEPBPM10PM25SO2
Year Fort WorthKnoxvilleFort WorthKnoxvilleFort WorthKnoxvilleFort WorthKnoxvilleKnoxville Knoxville Fort WorthKnoxvilleFort WorthKnoxville
2018 67 71 N/A 0.17 5.8 0.6 27.1 28.8 N/A N/A 17.0 N/A N/A 9.4 N/A 0.6
2017 67 68 N/A 0.16 6.2 0.6 27.2 30.6 N/A N/A 16.5 N/A N/A 8.5 N/A 0.2
2016 56 71 N/A 0.18 6.3 0.8 25.5 32.7 N/A N/A 19.1 N/A N/A N/A N/A 0.5
2015 61 68 N/A 0.17 6.5 0.8 24.8 28.8 0.009 N/A 26.0 N/A N/A N/A N/A 1.8
2014 56 62 0.22 0.14 6.8 N/A 26.6 29.2 0.011 N/A 23.7 N/A N/A N/A N/A 1.6
2013 64 60 0.25 0.14 6.4 N/A 26.5 28.9 N/A N/A 22.3 N/A N/A N/A N/A 0.6
2012 87 92 0.26 0.16 7.8 N/A 30.3 32.1 N/A N/A 24.9 N/A N/A N/A N/A 0.4
2011 79 91 0.23 0.20 7.9 N/A 30.7 34.0 N/A N/A 28.1 N/A N/A N/A N/A 0.6
2010 70 94 0.23 0.18 8.5 0.9 27.7 32.3 N/A N/A 29.2 N/A N/A N/A N/A 0.9
2009 81 66 0.25 0.17 8.7 0.7 29.5 28.7 0.018 N/A 23.6 N/A N/A N/A N/A 0.7
2008 69 96 0.25 0.18 9.6 N/A 25.8 33.2 0.023 N/A 32.5 N/A N/A N/A N/A 1.5
2007 75 105 0.30 0.16 10.6 N/A 24.6 35.5 0.017 N/A 36.0 N/A N/A N/A N/A 1.6
2006 90 98 0.34 N/A 10.2 N/A 29.7 30.2 0.024 N/A 36.3 N/A N/A N/A N/A 2.3
2005 102 108 0.34 N/A 10.9 N/A 28.4 27.7 N/A N/A 34.6 N/A 11.3 N/A 0.9 N/A
2004 78 103 0.39 N/A 10.6 N/A 25.4 24.9 0.015 N/A 41.2 N/A N/A N/A N/A N/A
2003 82 112 0.40 N/A 11.1 N/A 27.2 23.4 0.010 N/A 40.7 N/A N/A N/A N/A 2.8
2002 94 112 0.37 N/A 11.8 N/A 25.8 28.3 N/A N/A 35.1 N/A N/A N/A N/A 3.4
2001 16 109 0.48 N/A N/A N/A N/A 28.9 N/A N/A 35.6 N/A N/A N/A N/A 3.3
2000 17 122 0.55 N/A N/A 11.8 N/A 25.2 N/A N/A 34.2 N/A N/A N/A N/A 2.5
Natural disasters
Type Fort Worth Knoxville
Tornado activity compared to U.S. average 249.6% 64.8%
Earthquake activity compared to U.S. average 562.8% 177.6%
Natural disasters compared to U.S. average 23% 13%

Transportation

Public transportation options are available in both cities. Fort Worth has the Trinity Metro transportation system, while Knoxville offers the Knoxville Area Transit (KAT). Both cities have accessible highways and interstates for commuting.
Transport
Type Fort Worth Knoxville
Amtrak stations 1 0
Amtrak stations nearby 1 0
FAA registered aircraft 2 366
FAA registered aircraft manufacturers and dealers 19 19
Means of transportation to work
Type Fort Worth Knoxville
Bicycle 0.1% 0%
Bus 0.4% 0.6%
Carpooled 11% 5.5%
Car alone 85.8% 91.4%
Motorcycle 0.1% 0.1%
Walked 1.3% 1.5%
Means of transportation to work
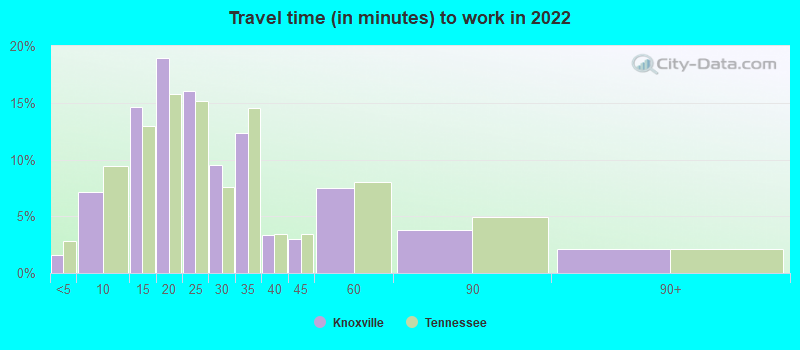
Average travel time to work
Type Fort Worth Knoxville
Average 28.5 min 26.5 min
Other means 25.3 min 20.9 min
Public transportation 41.8 min 33.4 min
Travel time to work
Time leaving to work
Travel time to work
Time leaving to work
Private vehicle occupancy
Type Fort Worth Knoxville
Average 1.2 1.1
Drove alone 87.6% 91.4%
In 2 person carpool 8.5% 6.8%
In 3 person carpool 2.5% 0.7%
In 4 person carpool 1.1% 0.5%
In 5-6 person carpool 0.3% 0.2%

How many people usually rode to work in the car, truck or van.

Real Estate

Real estate in both Fort Worth and Knoxville are reasonably priced. Knoxville, however, is a bit more affordable with a lower median home cost.

Neighborhoods

Both cities offer a range of neighborhoods from urban to suburban, each with its own charm and appeal. Fort Worth has an exciting downtown area while the suburbs offer quiet, family-friendly communities. Knoxville offers distinctive neighborhoods such as Old City and Bearden with unique boutiques and eclectic eateries.
Houses and residents
Type Fort Worth Knoxville
Houses 361,341 94,457
Average household size (people) 2.8 2.2
Median year apartment built 1991 1978
Median year house/condo built 1995 1964
Length of stay in the house since moving in 11.2 years 13.2 years
Houses occupied 334,286 (92.5%) 85,151 (90.1%)
Houses occupied by owners 185,197 (55.4%) 40,535 (47.6%)
Houses occupied by renters 149,089 (44.6%) 44,616 (52.4%)
Median rent asked for vacant for-rent units $1,068 $882.25
Median monthly housing costs $1,328 $945
Median price asked for vacant for-sale houses and condos $288,576 $134,979
Estimated median house or condo value $249,000 $193,600
Median numbers of rooms 5.3 5
Median number of rooms in apartments 4.2 4.1
Median number of rooms in houses and condos 6.3 6.2
Median house price - detached houses $279,885 $261,152
Median house price - in 2-unit structures Over $1,000,000 $185,738
Median house price - in 3-to-4-unit structures $337,081 $206,216
Median house price - in 5 or more unit structures $298,062 $237,681
Median house price - mobile homes $58,470 $92,571
Median house price - Townhouses or other attached units $279,957 $225,200
Median house price - All housing units $279,281 $256,619
Median house age 29 49
Renting percentage 40.8% 50.8%
Housing density (houses/condos per square mile) 1,235.2 1,019.4
House value disparities 31.8% 34.8%
Household income disparities 43.6% 47.9%
Median household income for houses/condes with a mortgage $106,170 $76,198
Median household income for apartments without a mortgage $72,147 $58,442
Housing units without a mortgage 2,986 (2.4%) 497 (1.9%)
Housing units with both a second mortgage and home equity loan 3,696 (3%) 1,206 (4.7%)
Housing units with a mortgage 121,099 (97.6%) 25,330 (98.1%)
Housing units with a home equity loan 66 (0.1%) 167 (0.6%)
Housing units with a second mortgage 5,171 (4.2%) 1,649 (6.4%)
House/condo owner moved in on average (years ago) 8 10
House/condo renter moved in on average (years ago) 1 1
Housing units lacking complete kitchen facilities 1.8% 2.6%
Housing units lacking complete plumbing facilities 0.7% 1.8%
Housing units in structures
Housing units in structures Fort WorthKnoxville
One, detached 65.4% 54.1%
One, attached 2.9% 5.2%
Two 1.6% 3.2%
3 or 4 4.1% 4.2%
5 to 9 5.8% 8.3%
10 to 19 6.5% 9.2%
20 to 49 4.6% 6.5%
50 or more 7.0% 8.7%
Mobile homes 2.1% 0.7%
Median real estate property taxes paid for housing units
Type Fort Worth Knoxville
With mortgages $5,254 (2%) $1,375 (0.7%)
With no mortgages $3,121 (1.5%) $1,501 (0.8%)
Marital status
Type Fort Worth Knoxville
Divorced 11.1% 13.6%
Never married 34.9% 45.7%
Now married 47.9% 33.5%
Separated 1.9% 1.3%
Widowed 4.2% 5.9%
Class of workers - percentage
Class of Workers Fort WorthKnoxville
Employee of private company 73.0% 69.2%
Private not-for-profit wage and salary workers 7.8% 8.6%
Local government workers 6.3% 4.2%
Self-employed workers in own not incorporated business 5.9% 6.6%
Self-employed in own incorporated business 2.8% 1.9%
Federal government workers 2.2% 1.8%
State government workers 1.9% 7.5%
Unpaid family workers 0.1% 0.2%
Class of workers - absolute values
Class of Workers Fort WorthKnoxville
Employee of private company 335,705 66,776
Federal government workers 10,104 1,744
Local government workers 28,814 4,038
Private not-for-profit wage and salary workers 35,858 8,262
Self-employed in own incorporated business 12,845 1,875
Self-employed workers in own not incorporated business 27,257 6,351
State government workers 8,587 7,257
Unpaid family workers 392 197

Industries and Occupations

Fort Worth's major industries include aerospace, defense, healthcare, and information technology. Knoxville, on the other hand, has a substantial presence in manufacturing, retail, and the burgeoning tech start-up scene. Both cities offer a variety of occupations and career paths.
Most common male industries
Industry Fort WorthKnoxville
Construction 15.3% 13.9%
Manufacturing 12.4% 9.9%
Transportation and warehousing 11.8% 5.5%
Retail trade 10.0% 11.5%
Accommodation and food services 6.9% 8.2%
Professional, scientific, and technical services 5.9% 7.5%
Administrative and support and waste management services 5.3% 4.9%
Finance and insurance 5.0% 3.7%
Other services, except public administration 4.9% 4.9%
Health care and social assistance 4.6% 7.9%
Educational services 4.0% 9.1%
Wholesale trade 3.4% 2.9%
Public administration 3.1% 2.7%
Real estate and rental and leasing 2.3% 1.8%
Information 2.0% 1.1%
Arts, entertainment, and recreation 1.3% 2.3%
Utilities 1.0% 1.1%
Mining, quarrying, and oil and gas extraction 0.5% 0.3%
Management of companies and enterprises 0.2% 0.3%
Agriculture, forestry, fishing and hunting 0.2% 0.6%
Most common female industries
Industry Fort WorthKnoxville
Health care and social assistance 21.5% 20.0%
Educational services 11.7% 12.3%
Retail trade 11.1% 15.1%
Accommodation and food services 9.1% 11.7%
Finance and insurance 7.1% 6.3%
Other services, except public administration 6.3% 4.4%
Manufacturing 6.1% 5.4%
Transportation and warehousing 5.9% 3.0%
Professional, scientific, and technical services 5.7% 7.6%
Administrative and support and waste management services 4.5% 5.2%
Real estate and rental and leasing 2.5% 0.9%
Public administration 2.4% 2.1%
Construction 1.7% 1.4%
Wholesale trade 1.3% 1.2%
Arts, entertainment, and recreation 1.2% 0.6%
Information 1.0% 2.2%
Mining, quarrying, and oil and gas extraction 0.4% 0.0%
Agriculture, forestry, fishing and hunting 0.3% 0.1%
Management of companies and enterprises 0.2% 0.1%
Utilities 0.2% 0.4%
Most common male occupations
Occupation Fort WorthKnoxville
Construction and extraction occupations 12.8% 9.3%
Management occupations 11.3% 10.9%
Sales and related occupations 8.9% 7.2%
Transportation occupations 7.6% 6.3%
Production occupations 6.4% 6.9%
Business and financial operations occupations 6.3% 4.2%
Material moving occupations 6.0% 5.2%
Office and administrative support occupations 5.8% 7.1%
Installation, maintenance, and repair occupations 5.5% 4.0%
Architecture and engineering occupations 4.5% 2.6%
Computer and mathematical occupations 4.4% 3.6%
Food preparation and serving related occupations 4.2% 6.6%
Building and grounds cleaning and maintenance occupations 3.6% 3.8%
Educational instruction, and library occupations 2.5% 3.8%
Health diagnosing and treating practitioners and other technical occupations 2.2% 3.3%
Personal care and service occupations 1.3% 1.6%
Firefighting and prevention, and other protective service workers including supervisors 1.2% 1.6%
Law enforcement workers including supervisors 1.1% 0.4%
Arts, design, entertainment, sports, and media occupations 1.0% 3.7%
Community and social service occupations 0.9% 2.2%
Most common female occupations
Occupation Fort WorthKnoxville
Office and administrative support occupations 19.1% 15.0%
Management occupations 9.4% 10.5%
Sales and related occupations 9.0% 9.7%
Educational instruction, and library occupations 8.1% 7.3%
Food preparation and serving related occupations 6.5% 7.6%
Business and financial operations occupations 6.3% 6.4%
Healthcare support occupations 5.6% 5.8%
Health diagnosing and treating practitioners and other technical occupations 5.6% 7.9%
Production occupations 4.4% 4.3%
Personal care and service occupations 3.7% 3.5%
Building and grounds cleaning and maintenance occupations 3.5% 2.8%
Material moving occupations 3.4% 2.2%
Arts, design, entertainment, sports, and media occupations 2.7% 3.4%
Health technologists and technicians 2.6% 2.9%
Community and social service occupations 2.3% 1.5%
Transportation occupations 2.0% 2.7%
Computer and mathematical occupations 1.7% 1.7%
Legal occupations 0.9% 1.7%
Life, physical, and social science occupations 0.3% 1.4%
Food environment data per 10,000 residents
Food environment statistics Fort WorthKnoxville
Number of convenience stores (no gas) 3.6 3.8
Number of convenience stores (with gas) 1.1 1.4
Number of full-service restaurants 5.7 7.4
Number of grocery stores 1.2 1.8
Number of supercenters and club stores 0.2 0.1
Food environment - absolute values
Food environment statistics Fort WorthKnoxville
Number of convenience stores (no gas) 609 162
Number of convenience stores (with gas) 194 58
Number of full-service restaurants 970 313
Number of grocery stores 212 74
Number of supercenters and club stores 25 5
Obesity and diabetes
Food environment statistics rate Fort WorthKnoxville
Adult diabetes rate 8.1% 12.0%
Adult obesity rate 26.1% 27.5%
Low-income preschool obesity rate 14.5% 13.7%

Health Care

Both Fort Worth and Knoxville have excellent healthcare systems. Fort Worth has top-rated hospitals such as Texas Health Harris Methodist Hospital. Likewise, Knoxville is served by well-established health systems like the University of Tennessee Medical Center.
Health (county statistics)
Type Fort Worth Knoxville
General health status score of residents in this county from 1 (poor) to 5 (excellent) 3.4 3.3
Average weight of females (lbs) 159 lbs 165.4 lbs
Average weight of males (lbs) 197.2 lbs 203.3 lbs
Residents visited a dentist within the past year 66% 62.9%
Residents exercised in the past month 72.8% 69.1%
Adult residents drank alcohol in the past 30 days 74.1% 43.4%
Residents smoked 100+ cigarettes in their lives 42.6% 48%

Fatal vehicle accidents per 100,000 residents
Type Total count per 100,000Drunk per 100,000Fatal count per 100,000Pedestrian count per 100,000Person count per 100,000Vehicle count per 100,000
Year Fort WorthKnoxvilleFort WorthKnoxvilleFort WorthKnoxvilleFort WorthKnoxvilleFort WorthKnoxvilleFort WorthKnoxville
2021 12.7 26.0 0.0 0.0 13.9 27.5 4.6 6.7 41.2 65.4 34.3 50.9
2020 11.5 16.3 2.4 4.7 11.9 16.3 4.4 3.1 24.8 33.1 18.2 25.7
2019 9.0 22.4 1.2 5.9 10.6 24.0 2.4 4.8 23.0 56.5 14.2 40.5
2018 11.1 21.9 2.0 5.3 11.7 22.4 5.3 3.7 25.5 60.2 19.6 38.9
2017 11.9 15.0 1.7 3.2 12.7 17.6 3.9 6.9 29.9 33.7 19.3 24.1
2016 9.9 14.0 2.7 3.2 10.2 16.7 3.5 2.2 19.3 29.7 15.0 23.2
2015 9.2 13.6 2.4 3.8 10.3 13.6 4.0 3.8 22.7 39.1 16.2 21.2
2014 8.9 15.7 2.6 1.1 9.5 17.9 2.5 3.8 20.7 54.3 14.2 28.2
2013 8.1 20.7 2.1 6.5 9.2 21.8 3.3 2.2 18.7 41.5 12.1 31.1
2012 7.2 18.1 2.2 6.6 7.6 20.3 2.7 2.2 16.7 36.8 10.7 27.4
2011 8.3 18.3 2.9 7.7 8.8 19.4 2.6 3.3 22.7 38.7 14.1 27.7
2010 8.5 17.9 4.7 5.6 9.6 18.4 1.8 2.2 19.2 30.7 13.0 25.2
2009 6.9 13.5 2.1 0.5 7.3 14.0 1.4 1.6 17.0 29.7 11.4 19.4
2008 8.5 12.5 3.0 0.5 8.9 12.5 2.8 1.6 19.0 25.4 12.2 20.0
2007 11.9 16.4 4.3 8.2 12.8 16.9 4.4 3.3 29.5 37.1 18.1 25.1
2006 11.8 19.8 5.8 4.9 12.4 22.0 2.5 3.3 27.6 51.1 18.9 34.6
2005 10.4 21.1 4.0 4.4 11.2 22.8 4.0 0.0 24.9 51.1 15.3 33.3
2004 10.8 21.3 4.5 4.5 11.1 23.0 3.0 1.7 26.7 55.0 16.4 32.6
2003 9.0 18.0 3.6 1.7 10.8 20.8 2.4 3.9 25.3 52.4 12.3 27.6
2002 12.8 21.5 5.3 8.5 13.3 25.4 5.3 1.1 32.1 54.8 19.6 35.0
2001 10.4 19.8 2.0 2.8 11.5 20.3 2.7 3.4 28.9 43.5 17.4 27.7
2000 11.2 22.4 1.9 9.2 14.2 23.0 3.7 2.9 31.8 57.5 17.4 35.7
1999 10.9 19.4 2.6 7.4 11.5 20.0 3.0 5.1 31.3 56.0 18.1 32.0
1998 12.0 14.5 2.4 2.9 13.4 16.2 3.0 1.2 34.3 38.7 20.1 24.3
1997 9.5 13.3 3.1 4.6 10.9 15.1 2.9 1.7 24.3 36.5 13.8 20.3
1996 12.0 20.3 4.2 4.7 13.8 22.1 4.2 3.5 29.4 54.6 14.9 33.7
1995 12.3 15.8 4.2 5.3 13.0 16.9 3.8 1.2 35.5 49.1 19.1 29.8
1994 12.6 23.4 5.1 10.5 14.6 25.7 4.7 3.5 32.6 58.4 18.4 33.9
1993 12.3 14.0 8.0 5.3 12.8 15.2 4.1 4.1 44.1 40.3 21.4 20.5
1992 13.9 17.5 5.6 9.9 15.4 17.5 6.1 3.5 38.6 55.3 21.5 33.8
1991 15.1 17.4 6.8 8.7 16.9 20.3 3.7 6.4 40.5 49.3 22.5 27.8
1990 16.0 17.9 7.3 8.1 16.4 19.1 0.0 0.0 35.3 50.3 21.8 33.0
1989 18.4 15.7 6.1 6.0 19.3 16.3 0.0 0.0 49.6 33.7 30.8 21.7
1988 15.6 23.9 6.2 13.8 17.5 25.7 0.0 0.0 37.7 65.2 20.7 40.7
1987 21.0 17.8 7.5 5.9 23.6 18.4 0.0 0.0 52.9 36.9 29.6 29.2
1986 23.7 16.6 7.8 7.7 26.7 18.9 0.0 0.0 63.9 31.3 36.0 22.5
1985 20.9 19.4 4.8 8.2 22.1 22.3 0.0 0.0 52.1 50.6 32.7 29.4
1984 24.4 11.7 5.4 7.6 25.8 13.4 0.0 0.0 61.4 26.3 33.6 18.1
1983 20.1 9.9 3.2 5.8 22.8 10.5 0.0 0.0 43.3 19.8 28.5 12.2
1982 20.6 14.4 3.0 3.5 22.4 15.6 0.0 0.0 45.0 32.4 29.2 20.2
1981 23.2 12.6 4.6 5.7 25.5 15.5 0.0 0.0 57.5 35.6 32.4 19.0
1980 30.6 16.0 4.7 5.7 34.0 16.6 0.0 0.0 73.7 36.0 42.6 22.3
1979 28.2 19.4 4.9 12.6 32.6 21.7 0.0 0.0 66.1 45.1 36.0 29.1
1978 20.2 23.4 4.4 8.0 20.7 26.3 0.0 0.0 42.4 56.0 28.2 33.2
1977 20.4 12.6 2.3 4.0 23.0 14.9 0.0 0.0 46.2 38.3 25.8 23.4
1976 17.5 22.3 0.5 6.9 20.3 26.9 0.0 0.0 45.6 62.3 25.0 32.0
1975 17.5 22.3 0.5 6.9 20.3 26.9 0.0 0.0 45.5 62.4 24.9 32.0

Fatal vehicle accidents
Type Total countDrunkFatal countPedestrian countPerson countVehicle count
Year Fort WorthKnoxvilleFort WorthKnoxvilleFort WorthKnoxvilleFort WorthKnoxvilleFort WorthKnoxvilleFort WorthKnoxville
1975 68 39 2 12 79 47 0 0 177 109 97 56
1976 68 39 2 12 79 47 0 0 177 109 97 56
1977 79 22 9 7 89 26 0 0 179 67 100 41
1978 78 41 17 14 80 46 0 0 164 98 109 58
1979 109 34 19 22 126 38 0 0 255 79 139 51
1980 118 28 18 10 131 29 0 0 284 63 164 39
1981 91 22 18 10 100 27 0 0 225 62 127 33
1982 82 25 12 6 89 27 0 0 179 56 116 35
1983 81 17 13 10 92 18 0 0 175 34 115 21
1984 100 20 22 13 106 23 0 0 252 45 138 31
1985 87 33 20 14 92 38 0 0 217 86 136 50
1986 100 28 33 13 113 32 0 0 270 53 152 38
1987 90 30 32 10 101 31 0 0 227 62 127 49
1988 68 40 27 23 76 43 0 0 164 109 90 68
1989 81 26 27 10 85 27 0 0 219 56 136 36
1990 72 31 33 14 74 33 0 0 159 87 98 57
1991 69 30 31 15 77 35 17 11 185 85 103 48
1992 64 30 26 17 71 30 28 6 178 95 99 58
1993 57 24 37 9 59 26 19 7 204 69 99 35
1994 59 40 24 18 68 44 22 6 152 100 86 58
1995 58 27 20 9 61 29 18 2 167 84 90 51
1996 57 35 20 8 66 38 20 6 140 94 71 58
1997 46 23 15 8 53 26 14 3 118 63 67 35
1998 59 25 12 5 66 28 15 2 169 67 99 42
1999 55 34 13 13 58 35 15 9 157 98 91 56
2000 60 39 10 16 76 40 20 5 170 100 93 62
2001 58 35 11 5 64 36 15 6 161 77 97 49
2002 73 38 30 15 76 45 30 2 183 97 112 62
2003 53 32 21 3 63 37 14 7 148 93 72 49
2004 65 38 27 8 67 41 18 3 161 98 99 58
2005 65 38 25 8 70 41 25 0 155 92 95 60
2006 77 36 38 9 81 40 16 6 180 93 123 63
2007 81 30 29 15 87 31 30 6 201 68 123 46
2008 60 23 21 1 63 23 20 3 134 47 86 37
2009 50 25 15 1 53 26 10 3 124 55 83 36
2010 63 32 35 10 71 33 13 4 142 55 96 45
2011 63 33 22 14 67 35 20 6 172 70 107 50
2012 56 33 17 12 59 37 21 4 130 67 83 50
2013 64 38 17 12 73 40 26 4 148 76 96 57
2014 72 29 21 2 77 33 20 7 168 100 115 52
2015 77 25 20 7 86 25 33 7 190 72 135 39
2016 85 26 23 6 87 31 30 4 165 55 128 43
2017 104 28 15 6 111 33 34 13 261 63 169 45
2018 99 41 18 10 104 42 47 7 228 113 175 73
2019 82 42 11 11 96 45 22 9 209 106 129 76
2020 106 31 22 9 110 31 41 6 229 63 168 49
2021 119 50 0 0 130 53 43 13 385 126 321 98
Police full-time law enforcement employees
Year Fort WorthKnoxville
2021 2,088 492
2020 2,085 495
2019 2,075 490
2018 2,132 502
2017 2,198 486
2016 2,007 465
2015 2,000 491
2014 0 507
2013 0 497
2012 1,940 509
2011 1,933 485
2010 1,918 503
2009 1,915 485
2008 1,899 471
2007 1,792 482
2006 1,733 476
2005 1,727 470
2004 1,651 477
2003 1,600 493
Police full-time law enforcement employees (per 1,000 residents)
Year Fort WorthKnoxville
2021 2.2 2.6
2020 2.2 2.6
2019 2.3 2.6
2018 2.4 2.7
2017 2.5 2.6
2016 2.4 2.5
2015 2.4 2.6
2014 0.0 2.8
2013 0.0 2.7
2012 2.5 2.8
2011 2.6 2.7
2010 2.6 2.8
2009 2.6 2.6
2008 2.7 2.6
2007 2.7 2.6
2006 2.7 2.6
2005 2.8 2.6
2004 2.8 2.7
2003 2.8 2.8
Local government: full-time employees
Job Fort WorthKnoxville
Airports 21 0
Financial administration 221 83
Firefighters 894 319
Fire - other 85 14
Health 162 0
Judicial and legal 185 27
Local libraries 160 0
Natural resources 128 39
Other and unallocable 240 124
Other government administration 257 48
Parks and recreation 481 42
Police - other 417 95
Police protection - officers 1,656 386
Sewerage 338 224
Solid waste management 42 184
Streets and highways 318 121
Totals for government 6,493 2,521
Water supply 633 133
Welfare 119 0
Local government: part-time employees
Job Fort WorthKnoxville
Financial administration 14 1
Fire - other 2 0
Health 3 0
Judicial and legal 10 1
Local libraries 51 0
Other government administration 22 10
Parks and recreation 154 89
Police - other 45 25
Sewerage 2 9
Streets and highways 3 1
Totals for government 377 170
Water supply 9 5
Welfare 31 0
Place of birth - Foreign born
Residents Fort WorthKnoxville
All residents 17.6% 6.2%
American Indian / Alaska Native residents 35.1% 26.2%
Asian residents 66.7% 73.8%
Black or African American residents 9.6% 8.0%
Native Hawaiian / Pacific Islander residents 11.5% 0.0%
Other race residents 38.7% 38.1%
Two or more races residents 20.6% 16.1%
White residents 5.2% 1.8%
White alone, not Hispanic / Latino residents 3.1% 2.5%
Place of birth - Native, outside of US
Residents Fort WorthKnoxville
All residents 1.5% 0.8%
American Indian / Alaska Native residents 6.0% 0.0%
Asian residents 0.5% 5.6%
Black or African American residents 1.0% 0.3%
Native Hawaiian / Pacific Islander residents 15.8% 0.0%
Other race residents 1.9% 6.1%
Two or more races residents 1.9% 1.9%
White residents 1.5% 0.4%
White alone, not Hispanic / Latino residents 1.1% 0.6%
Place of birth - Born in state of residence
Residents Fort WorthKnoxville
All residents 55.1% 58.8%
American Indian / Alaska Native residents 38.6% 25.6%
Asian residents 26.3% 12.6%
Black or African American residents 61.5% 76.2%
Native Hawaiian / Pacific Islander residents 40.9% 0.0%
Other race residents 50.5% 39.1%
Two or more races residents 60.0% 53.9%
White residents 56.4% 58.0%
White alone, not Hispanic / Latino residents 56.6% 58.3%
Place of birth - Born in other state
Residents Fort WorthKnoxville
All residents 25.8% 34.2%
American Indian / Alaska Native residents 20.3% 48.2%
Asian residents 6.6% 8.0%
Black or African American residents 27.9% 15.5%
Native Hawaiian / Pacific Islander residents 31.8% 100.0%
Other race residents 8.9% 16.8%
Two or more races residents 17.4% 28.1%
White residents 37.0% 39.8%
White alone, not Hispanic / Latino residents 39.1% 38.7%
English speakers (speaking English at home)
Type Fort Worth Knoxville
Born in the United States residents 89.1% 97.3%
Foreign born residents 10.1% 27.3%
Native, born elsewhere residents 47.6% 78.4%
Total residents 67.9% 92.4%
Mechanisms of homicide
Mechanism Fort WorthKnoxville
Homicides from 2000 to 2006 624 181
Cut / Pierce 68 28
Firearm 385 116
Suffocation 32 0
Mechanisms of homicide per 1,000,000 residents
Mechanism Fort WorthKnoxville
Homicides from 2000 to 2006 57.4 64.8
Cut / Pierce 6.3 10.0
Firearm 35.4 41.5
Suffocation 2.9 0
Mechanisms of suicide per 1,000,000 residents
Mechanism Fort WorthKnoxville
Suicides from 2000 to 2006 98.7 130.4
Firearm 54.9 76.6
Poisoning 14.4 21.8
Suffocation 23.6 22.2

Infrastructure

Fort Worth boasts modern infrastructure with a growing focus on renewable energy, while Knoxville maintains a blend of historic and contemporary infrastructure. Both cities have strong networks of public libraries, parks, and other community resources.
Infrastructure
Type Fort Worth Knoxville
Hospitals 76 20
TV stations 25 15
Arenas or stadiums 7 2
Bank branches located here 175 152
Bank institutions located here 42 38
Main business address for public companies 24 6
Drinking water stations with no reported violations in the past 3 6
Drinking water stations with reported violations in the past 19 14

Schools

School facilities
Type Fort Worth Knoxville
Private elementary/middle schools 22 21
Private high schools 14 14
Public elementary/middle schools 170 56
Public high schools 52 20
Colleges/Universities 13 13
HMDA - Conventional home purchase loans - Applications denied
Year Fort WorthKnoxville
1999 3,575 1,372
2000 2,473 1,152
2001 2,109 886
2002 1,701 1,367
2003 2,183 1,014
2004 3,202 1,080
2005 4,261 1,218
2006 4,161 1,159
2007 2,871 701
2008 1,256 329
2009 585 222

Culture and Food

The culture in both cities is rich and diverse. Fort Worth is known for Western heritage and Tex-Mex cuisine, while Knoxville offers a blend of Appalachian culture and southern hospitality featuring local favorites like biscuits and gravy and fried chicken.

Sports Teams

Sports enthusiasts have plenty to enjoy in both cities. Fort Worth residents can enjoy professional sports like the Dallas Cowboys (NFL) and the Texas Rangers (MLB). Knoxville, home to the University of Tennessee, offers the vibrant college sports scene.
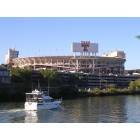