Fort Worth and New Orleans, two vibrant cities located in the South, offer varied experiences for both residents and visitors. Fort Worth's appeal lies in its combination of Texan charm and economic strength, while New Orleans is known for its rich cultural heritage and vibrant food scene. The following comparison evaluates several factors such as crime and safety, cost of living, education, work and economy, and more to provide a detailed look at the merits of living or visiting these two cities.
Distance between
Fort Worth, TX and
New Orleans, LA : 469.7 miles
Fort Worth's population is larger by 148%. Its population has grown by 400,814 people (75.0%) since 2000. The population of New Orleans has decreased by 107,703 people (22.2%) during that time.
Regarding safety, Fort Worth exhibits lower crime rates as compared to New Orleans. Although some areas in Fort Worth may face occasional incidents of crime, the overall safety is satisfactory. On the other hand, New Orleans has higher crime rates, particularly in certain neighborhoods, affecting both residents and tourists. It's important, therefore, to remain vigilant when exploring the city.
City-data.com crime index counts serious crimes and violent crime more heavily. It adjusts for the number of visitors and daily workers commuting into cities. (higher means more crime, U.S. average = 301.1)
City-data.com crime index counts serious crimes and violent crime more heavily. It adjusts for the number of visitors and daily workers commuting into cities. (higher means more crime, U.S. average = 301.1)
Sex Offenders
According to our data, there are 3,166 registered sex offenders living in Fort Worth and 701 registered sex offenders living in . The ratio of residents to sex offenders in Fort Worth is 270 to 1; the ratio in New Orleans is 558 to 1. The number of registered sex offenders compared to the number of residents is larger in Fort Worth than in New Orleans.
Cost of Living
The overall cost of living in Fort Worth is lower than the national average, making it an attractive option for families and individuals looking to relocate. Housing and utility costs are appreciably lower compared to other major cities. On the contrary, the cost of living in New Orleans is slightly above the national average, owing mainly to higher housing costs.
Income Tax
As previously mentioned, Texas doesn't have a state income tax, providing financial relief to the residents of Fort Worth. On the other hand, Louisiana imposes a state income tax, which affects New Orleans residents.
Property Tax
While Fort Worth has relatively high property taxes compared to the national average, homeowners in New Orleans tend to pay higher rates due to appreciating property values.
Sales Tax
Texas, including Fort Worth, doesn't impose a state income tax, but the sales tax rate is around 8.25%. In contrast, New Orleans levies a combined state and local sales tax rate of roughly 9.45%.
Income
Type
Fort Worth
New Orleans
Estimated median household income
$68,235
$46,942
Estimated per capita income
$34,106
$35,587
Cost of living index (U.S. average is 100)
95.4
97.9
If you make $50,000 in Fort Worth, you will have to make $51,310 in New Orleans to maintain the same standard of living.
Geographical Conditions
Fort Worth is relatively flat featuring prairie, oak woodland, and juniper. It's part of the Cross Timbers region and lies within Tornado Alley. New Orleans is situated below sea level and near the Gulf of Mexico, making it susceptible to hurricanes.
Both cities house numerous esteemed educational institutions. Fort Worth is home to Texas Christian University and Tarrant County College, among others. New Orleans houses the well-known Tulane University and Loyola University New Orleans, offering attractive opportunities for higher education.
Fort Worth's economy is robust, with significant contributions from sectors like technology, logistics, and manufacturing. Its unemployment rate is lower than the national average, suggesting positive opportunities for job seekers. In contrast, New Orleans relies heavily on tourism, hospitality, and maritime industries. Its economy was hit hard by the COVID-19 pandemic due to a decrease in tourism.
Biggest Employers
Major employers in Fort Worth include Lockheed Martin, American Airlines, and the Fort Worth Independent School District. In New Orleans, leading employers include Ochsner Health System, Tulane University, and Marriott International.
There were 7,236 building permits issued in Fort Worth in 2012 (4810 more than in 2011) compared to 716 building permits issued in New Orleans in 2012 (1 less than in 2011).
In Fort Worth (Tarrant County), 41.4% voted for Democrats and 57.1% for Republicans in 2012 Presidential Election. In New Orleans (Orleans Parish), 80.5% voted for Democrats and 17.8% for Republicans.
Elections
Type
Democrats
Republicans
Other
Year
Fort Worth
New Orleans
Fort Worth
New Orleans
Fort Worth
New Orleans
2020
49.3%
83.6%
49.1%
15.1%
1.6%
1.3%
2016
43.2%
81.1%
51.8%
14.7%
5.0%
4.2%
2012
41.4%
80.5%
57.1%
17.8%
1.4%
1.7%
2008
43.8%
79.6%
55.5%
19.1%
0.7%
1.3%
2004
37.0%
77.8%
62.5%
21.8%
0.5%
0.4%
2000
36.9%
76.2%
60.9%
21.8%
2.3%
2.0%
1996
41.6%
90.7%
50.9%
8.2%
7.5%
1.2%
Breakdown of population affiliated with a religious congregation
Type
Adherents
Congregations
Religion
Fort Worth
New Orleans
Fort Worth
New Orleans
SOUTHERN BAPTIST CONVENTION
17.3%
4.3%
33.3%
13.0%
CATHOLIC CHURCH
11.1%
30.9%
1.9%
16.0%
MUSLIM ESTIMATE
2.2%
0.5%
0.9%
1.8%
LUTHERAN CHURCH
0.5%
0.5%
0.9%
3.9%
SEVENTH DAY ADVENTIST CHURCH
0.4%
1.1%
1.6%
1.8%
EPISCOPAL CHURCH
0.3%
1.5%
0.8%
4.2%
AMERICAN BAPTIST CHURCHES IN THE USA
0.0%
0.6%
0.1%
0.6%
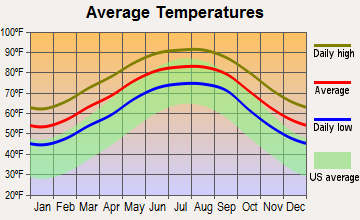
Weather
Both cities are located in southern US states characterized by humid subtropical climates. However, Fort Worth experiences somewhat hotter summers with temperatures reaching well past 100°F. In contrast, New Orleans has mild winters and hot, humid summers. It also faces more frequent tropical storm activity, which can affect both residents and tourists.
Weather and climate
Type
Fort Worth
New Orleans
Temperature - Average
65°F
69.6°F
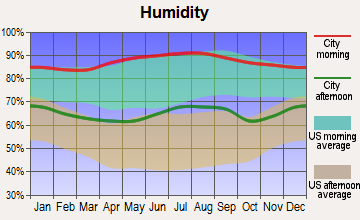
Humidity - Average morning or afternoon humidity
71.4%
80.8%
Humidity - Differences between morning and afternoon humidity
34.1%
32%
Humidity - Maximum monthly morning or afternoon humidity
82.1%
91%
Humidity - Minimum monthly morning or afternoon humidity
48%
59%
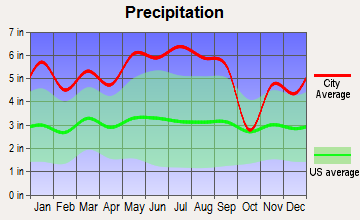
Precipitation - Yearly average
35 in
62.2 in
Snowfall - Yearly average
4.2 in
0.2 in
Clouds - Number of days clear of clouds
22.8%
16.9%
Sunshine amount - Average
66.6%
63.7%
Sunshine amount - Differences during a year
20%
22%
Sunshine amount - Maximum monthly
74%
70%
Sunshine amount - Minimum monthly
54%
48%
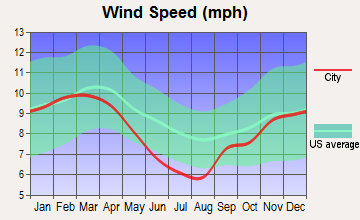
Wind speed - Average
10.3 mph
8.7 mph
Average climate in Fort Worth, Texas
Average climate in New Orleans, Louisiana
Air pollution
Type
AQI
CO
NO2
OZONE
PM10
PM25
SO2
Year
Fort Worth
New Orleans
Fort Worth
New Orleans
Fort Worth
New Orleans
Fort Worth
New Orleans
New Orleans
Fort Worth
New Orleans
Fort Worth
New Orleans
2018
67
75
N/A
N/A
5.8
5.5
27.1
27.9
19.6
N/A
N/A
9.5
N/A
1.1
2017
67
73
N/A
N/A
6.2
6.0
27.2
27.6
18.8
N/A
N/A
9.5
N/A
1.6
2016
56
71
N/A
N/A
6.3
6.7
25.5
29.1
16.5
N/A
N/A
9.4
N/A
1.7
2015
61
76
N/A
N/A
6.5
6.3
24.8
26.5
17.5
N/A
N/A
8.8
N/A
1.3
2014
56
79
0.22
N/A
6.8
6.7
26.6
25.6
17.7
N/A
N/A
7.7
N/A
2.0
2013
64
73
0.25
N/A
6.4
6.5
26.5
25.8
17.8
N/A
N/A
7.4
N/A
2.6
2012
87
84
0.26
N/A
7.8
7.8
30.3
26.8
24.0
N/A
N/A
10.0
N/A
2.5
2011
79
93
0.23
N/A
7.9
7.8
30.7
27.0
24.9
N/A
N/A
8.8
N/A
2.1
2010
70
89
0.23
N/A
8.5
7.8
27.7
27.5
26.7
N/A
N/A
9.5
N/A
2.9
2009
81
81
0.25
N/A
8.7
7.6
29.5
26.5
N/A
N/A
N/A
9.1
N/A
2.8
2008
69
81
0.25
N/A
9.6
9.3
25.8
27.3
N/A
N/A
N/A
10.0
N/A
3.0
2007
75
97
0.30
N/A
10.6
9.1
24.6
28.4
N/A
N/A
N/A
10.2
N/A
3.6
2006
90
93
0.34
N/A
10.2
9.7
29.7
28.7
N/A
N/A
N/A
11.2
N/A
N/A
2005
102
93
0.34
0.58
10.9
9.0
28.4
24.7
N/A
N/A
11.3
10.6
0.9
N/A
2004
78
96
0.39
0.68
10.6
9.5
25.4
21.3
N/A
N/A
N/A
10.3
N/A
N/A
2003
82
91
0.40
0.84
11.1
9.9
27.2
19.5
N/A
N/A
N/A
11.5
N/A
N/A
2002
94
68
0.37
0.61
11.8
9.3
25.8
20.2
N/A
N/A
N/A
N/A
N/A
N/A
2001
16
88
0.48
0.81
N/A
10.2
N/A
20.6
N/A
N/A
N/A
N/A
N/A
N/A
2000
17
105
0.55
0.55
N/A
11.3
N/A
24.5
N/A
N/A
N/A
N/A
N/A
N/A
Natural disasters
Type
Fort Worth
New Orleans
Tornado activity compared to U.S. average
249.6%
125.4%
Earthquake activity compared to U.S. average
562.8%
44.4%
Natural disasters compared to U.S. average
23%
21%
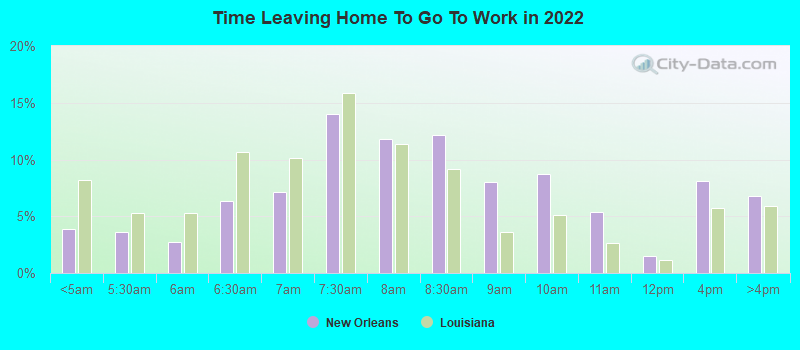
Transportation
Fort Worth provides a range of public transit options, including buses and the recently introduced TEXRail. The average commute in Fort Worth is shorter than in New Orleans, which though having a decent public transit system with buses and the iconic streetcars, experiences greater traffic congestion.
Transport
Type
Fort Worth
New Orleans
Amtrak stations
1
1
Amtrak stations nearby
1
1
FAA registered aircraft
2
201
FAA registered aircraft manufacturers and dealers
19
2
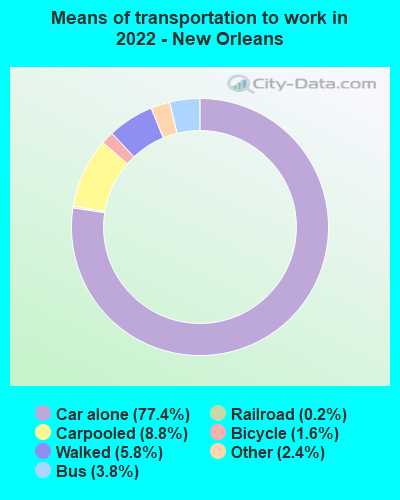
Means of transportation to work
Type
Fort Worth
New Orleans
Bicycle
0.1%
1.4%
Bus
0.4%
3.3%
Carpooled
11%
9%
Car alone
85.8%
79.9%
Ferryboat
0%
0.1%
Motorcycle
0.1%
0.1%
Railroad
0%
0.2%
Taxicab
0.1%
0.5%
Walked
1.3%
3.6%
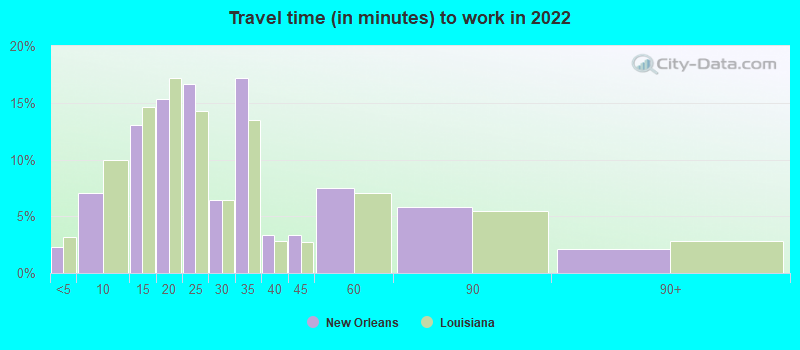
Average travel time to work
Type
Fort Worth
New Orleans
Average
28.5 min
27.7 min
Other means
25.3 min
23.4 min
Public transportation
41.8 min
42.3 min
Private vehicle occupancy
Type
Fort Worth
New Orleans
Average
1.2
1.2
Drove alone
87.6%
89.9%
In 2 person carpool
8.5%
8.2%
In 3 person carpool
2.5%
0.8%
In 4 person carpool
1.1%
0.4%
In 5-6 person carpool
0.3%
0.1%
In 7+ person carpool
0.1%
0.6%
How many people usually rode to work in the car, truck or van.
Real Estate
The real estate market in Fort Worth has remained relatively stable, with home values often appreciating. Housing prices are typically more affordable here compared to New Orleans, where property values are on the rise.
Neighborhoods
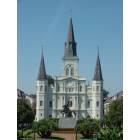
Fort Worth offers a mix of urban and suburban neighborhoods, each with their distinct personalities. The Sundance Square area is vibrant and great for young professionals, while the Tanglewood neighborhood is perfect for families. New Orleans has iconic neighborhoods like the historic French Quarter and the lively Bywater.
Houses and residents
Type
Fort Worth
New Orleans
Houses
361,341
194,701
Average household size (people)
2.8
2.3
Median year apartment built
1991
1966
Median year house/condo built
1995
1960
Length of stay in the house since moving in
11.2 years
15.5 years
Houses occupied
334,286 (92.5%)
158,827 (81.6%)
Houses occupied by owners
185,197 (55.4%)
83,516 (52.6%)
Houses occupied by renters
149,089 (44.6%)
75,311 (47.4%)
Median rent asked for vacant for-rent units
$1,068
$1,126
Median monthly housing costs
$1,328
$1,106
Median price asked for vacant for-sale houses and condos
$288,576
$470,732
Estimated median house or condo value
$249,000
$279,100
Median numbers of rooms
5.3
5.2
Median number of rooms in apartments
4.2
4.4
Median number of rooms in houses and condos
6.3
6.3
Median house price - detached houses
$279,885
$360,278
Median house price - in 2-unit structures
Over $1,000,000
$499,015
Median house price - in 3-to-4-unit structures
$337,081
$347,348
Median house price - in 5 or more unit structures
$298,062
$400,453
Median house price - mobile homes
$58,470
$25,502
Median house price - Townhouses or other attached units
$279,957
$365,362
Median house price - All housing units
$279,281
$369,282
Median house age
29
61
Renting percentage
40.8%
52.2%
Housing density (houses/condos per square mile)
1,235.2
1,078.3
House value disparities
31.8%
38.2%
Household income disparities
43.6%
53.1%
Median household income for houses/condes with a mortgage
$106,170
$89,566
Median household income for apartments without a mortgage
$72,147
$53,790
Housing units without a mortgage
2,986 (2.4%)
629 (1.3%)
Housing units with both a second mortgage and home equity loan
3,696 (3%)
3,326 (6.9%)
Housing units with a mortgage
121,099 (97.6%)
47,733 (98.7%)
Housing units with a home equity loan
66 (0.1%)
296 (0.6%)
Housing units with a second mortgage
5,171 (4.2%)
4,588 (9.5%)
House/condo owner moved in on average (years ago)
8
14
House/condo renter moved in on average (years ago)
1
3
Housing units lacking complete kitchen facilities
1.8%
5.6%
Housing units lacking complete plumbing facilities
0.7%
4.6%
Housing units in structures
Housing units in structures
Fort Worth
New Orleans
One, detached
65.4%
48.0%
One, attached
2.9%
9.7%
Two
1.6%
15.1%
3 or 4
4.1%
6.9%
5 to 9
5.8%
4.1%
10 to 19
6.5%
3.8%
20 to 49
4.6%
3.9%
50 or more
7.0%
8.1%
Mobile homes
2.1%
0.4%
Median real estate property taxes paid for housing units
Self-employed workers in own not incorporated business
27,257
9,492
State government workers
8,587
9,130
Unpaid family workers
392
527
Industries and Occupations
In Fort Worth, key sectors providing employment include healthcare, education, and manufacturing. In New Orleans, tourism and hospitality, healthcare, and education are the leading industries.
Fort Worth gets good marks for healthcare, with Texas Health Resources and Cook Children's among the primary providers. On the other hand, New Orleans has healthcare institutions like the Ochsner Medical Center and the Tulane Medical Center.
Health (county statistics)
Type
Fort Worth
New Orleans
General health status score of residents in this county from 1 (poor) to 5 (excellent)
Fort Worth boasts modern infrastructure with significant investments in roadways, public buildings, and services. Conversely, New Orleans' infrastructure still faces challenges largely due to the enduring effects of Hurricane Katrina in 2005.
HMDA - Conventional home purchase loans - Applications denied
Year
Fort Worth
New Orleans
1999
3,575
1,021
2000
2,473
942
2001
2,109
820
2002
1,701
820
2003
2,183
991
2004
3,202
1,379
2005
4,261
1,899
2006
4,161
1,426
2007
2,871
1,245
2008
1,256
683
2009
585
378
Culture and Food
Both cities have vibrant cultures. Fort Worth combines Western heritage with modern attractions such as the Fort Worth Stockyards, while New Orleans boasts a unique blend of cultures, visible in its festivals like Mardi Gras. Their food scenes differ greatly too; Fort Worth is known for its BBQ and Tex-Mex cuisine, and New Orleans is famous for Creole and Cajun dishes.
Sports Teams
While Fort Worth doesn't have any major league teams, residents often support Dallas's teams located nearby. New Orleans's major sports teams include the NFL's Saints and NBA's Pelicans.


 Fort Worth, TX
 New Orleans, LA