Fort Worth, Texas, with its cowboy heritage, vibrant arts and music scene, and booming economy, offers residents and visitors alike a unique slice of Americana. On the other hand, St. Petersburg, Florida, offers a subtropical paradise, breathtaking waterfront views, and a vibrant arts and culture scene. Living or visiting either of these cities offers distinct experiences, rich histories, and different economic opportunities. The following is a comprehensive comparison of living and visiting Fort Worth, TX, and St. Petersburg, FL.
Distance between
Fort Worth, TX and
St. Petersburg, FL : 938.7 miles
Fort Worth's population is larger by 262%. Its population has grown by 400,814 people (75.0%) since 2000. The population of St. Petersburg has grown by 9,969 people (4.0%) during that time.
Like all major cities, both Fort Worth, Texas, and St. Petersburg, Florida have their challenges with crime. The crime rate in Fort Worth is slightly higher than the national average, specifically in areas of property crime. However, many neighborhoods are extremely safe and tight-knit. On the other hand, St. Petersburg has a higher than average crime rate when compared to other cities in Florida, though efforts to lower crime rates have been effective over the past few years.
City-data.com crime index counts serious crimes and violent crime more heavily. It adjusts for the number of visitors and daily workers commuting into cities. (higher means more crime, U.S. average = 301.1)
City-data.com crime index counts serious crimes and violent crime more heavily. It adjusts for the number of visitors and daily workers commuting into cities. (higher means more crime, U.S. average = 301.1)
Sex Offenders
According to our data, there are 3,166 registered sex offenders living in Fort Worth and 794 registered sex offenders living in . The ratio of residents to sex offenders in Fort Worth is 270 to 1; the ratio in St. Petersburg is 329 to 1. The number of registered sex offenders compared to the number of residents in Fort Worth is near to than in St. Petersburg.
Cost of Living
The cost of living in Fort Worth is generally lower than in St. Petersburg. This is especially seen in housing and utilities. In Fort Worth, a resident can enjoy a larger house for less than they would pay for a smaller condominium in St. Petersburg. However, groceries and healthcare tend to be more affordable in St. Petersburg.
Income Tax
Texas, including Fort Worth, does not impose a state income tax. In contrast, Florida also does not impose state income tax, making both cities attractive for those seeking tax-efficient places to live.
Property Tax
Property taxes in Fort Worth can be high, as Texas has no state income tax to offset the costs of services. In St. Petersburg, property taxes tend to be lower, but the higher property values can result in similar overall tax bills.
Sales Tax
Texas has a state sales tax of 6.25%, and Fort Worth adds an additional 2%, making the total sales tax 8.25%. In contrast, Florida’s state sales tax is 6%, and St. Petersburg adds an additional 1%, creating a total sales tax of 7%.
Income
Type
Fort Worth
St. Petersburg
Estimated median household income
$68,235
$64,141
Estimated per capita income
$34,106
$40,537
Cost of living index (U.S. average is 100)
95.4
100.2
If you make $50,000 in Fort Worth, you will have to make $52,516 in St. Petersburg to maintain the same standard of living.
Geographical Conditions
Fort Worth is a landlocked city located on the prairies of Northeast Texas, while St. Petersburg is a peninsula located between Tampa Bay and the Gulf of Mexico. St. Petersburg offers more opportunities for marine activities like fishing, sailing, and beach recreation.
Both cities take pride in their education systems. Fort Worth offers a decent spread of public, private, and charter schools. It also hosts the acclaimed Texas Christian University among other institutions of higher learning. St. Petersburg, in contrast, provides a more diverse collection of educational institutions, including Eckerd College and the University of South Florida St. Petersburg.
The economy in Fort Worth is heavily influenced by the defense, technology, and healthcare sectors, while St. Petersburg is largely driven by tourism, healthcare, and financial services. Both cities offer a wealth of job opportunities but in varying sectors, meaning employment potential could depend heavily on one's career field.
Biggest Employers
Some of Fort Worth's biggest employers include Lockheed Martin Aeronautics, American Airlines, and the Texas Health Resources. For St. Petersburg, some of the biggest employers are Raymond James, Johns Hopkins All Children's Hospital, and Home Shopping Network.
There were 7,236 building permits issued in Fort Worth in 2012 (4810 more than in 2011) compared to 455 building permits issued in St. Petersburg in 2012 (355 more than in 2011).
In Fort Worth (Tarrant County), 41.4% voted for Democrats and 57.1% for Republicans in 2012 Presidential Election. In St. Petersburg (Pinellas County), 52.3% voted for Democrats and 46.7% for Republicans.
Elections
Type
Democrats
Republicans
Other
Year
Fort Worth
St. Petersburg
Fort Worth
St. Petersburg
Fort Worth
St. Petersburg
2020
49.3%
49.6%
49.1%
49.4%
1.6%
1.0%
2016
43.2%
47.1%
51.8%
48.2%
5.0%
4.7%
2012
41.4%
52.3%
57.1%
46.7%
1.4%
1.0%
2008
43.8%
53.5%
55.5%
45.3%
0.7%
1.2%
2004
37.0%
49.7%
62.5%
49.8%
0.5%
0.5%
2000
36.9%
50.4%
60.9%
46.5%
2.3%
3.1%
1996
41.6%
49.1%
50.9%
40.4%
7.5%
10.5%
Breakdown of population affiliated with a religious congregation
Type
Adherents
Congregations
Religion
Fort Worth
St. Petersburg
Fort Worth
St. Petersburg
SOUTHERN BAPTIST CONVENTION
17.3%
3.1%
33.3%
11.5%
CATHOLIC CHURCH
11.1%
12.3%
1.9%
5.2%
MUSLIM ESTIMATE
2.2%
1.5%
0.9%
1.6%
LUTHERAN CHURCH
0.5%
0.6%
0.9%
1.1%
SEVENTH DAY ADVENTIST CHURCH
0.4%
0.2%
1.6%
1.8%
EPISCOPAL CHURCH
0.3%
0.9%
0.8%
3.2%
EVANGELICAL LUTHERAN CHURCH IN AMERICA
0.3%
0.7%
0.9%
2.4%
Weather
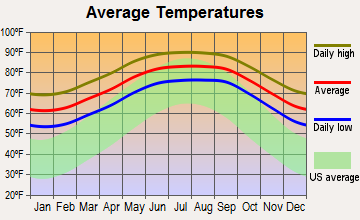
The weather in Fort Worth tends to be more extreme, with hot, humid summers and mild to cool winters, whereas the weather in St. Petersburg is subtropical, meaning it has warm, wet summers and dry, mild winters. Those who enjoy sunny weather with an occasional cool breeze may prefer St. Petersburg, but if you can handle higher heat during the summer and enjoy a switch to the cooler temperatures in winter, Fort Worth may be the place for you.
Weather and climate
Type
Fort Worth
St. Petersburg
Temperature - Average
65°F
73.6°F
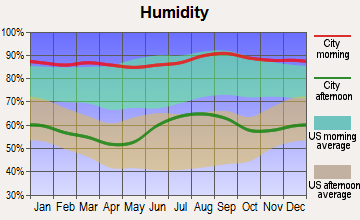
Humidity - Average morning or afternoon humidity
71.4%
77.6%
Humidity - Differences between morning and afternoon humidity
34.1%
38%
Humidity - Maximum monthly morning or afternoon humidity
82.1%
89%
Humidity - Minimum monthly morning or afternoon humidity
48%
51%
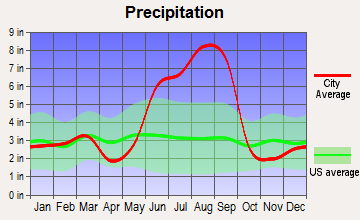
Precipitation - Yearly average
35 in
49.3 in
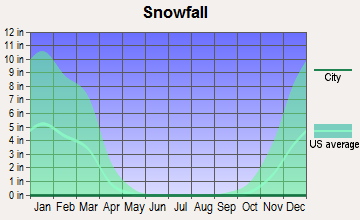
Snowfall - Yearly average
4.2 in
0 in
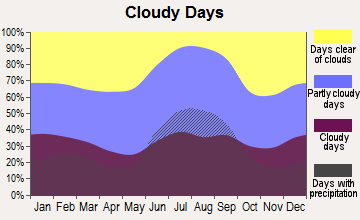
Clouds - Number of days clear of clouds
22.8%
16.9%
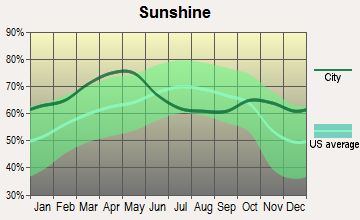
Sunshine amount - Average
66.6%
74.8%
Sunshine amount - Differences during a year
20%
18%
Sunshine amount - Maximum monthly
74%
80%
Sunshine amount - Minimum monthly
54%
62%
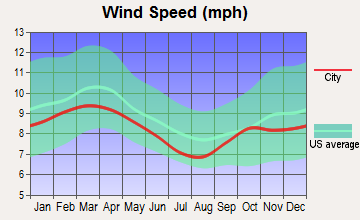
Wind speed - Average
10.3 mph
7.4 mph
Average climate in Fort Worth, Texas
Average climate in St. Petersburg, Florida
Air pollution
Type
AQI
CO
NO2
OZONE
PB
PM10
PM25
SO2
Year
Fort Worth
St. Petersburg
Fort Worth
St. Petersburg
Fort Worth
St. Petersburg
Fort Worth
St. Petersburg
St. Petersburg
St. Petersburg
Fort Worth
St. Petersburg
Fort Worth
St. Petersburg
2018
67
70
N/A
N/A
5.8
N/A
27.1
28.3
N/A
N/A
16.7
N/A
N/A
7.5
N/A
1.5
2017
67
78
N/A
N/A
6.2
N/A
27.2
28.0
N/A
N/A
20.5
N/A
N/A
8.3
N/A
0.5
2016
56
71
N/A
N/A
6.3
N/A
25.5
29.7
N/A
N/A
20.2
N/A
N/A
7.7
N/A
0.9
2015
61
76
N/A
N/A
6.5
N/A
24.8
28.1
N/A
N/A
19.0
N/A
N/A
8.2
N/A
0.4
2014
56
72
0.22
N/A
6.8
N/A
26.6
28.1
N/A
N/A
20.0
N/A
N/A
8.8
N/A
0.5
2013
64
67
0.25
N/A
6.4
N/A
26.5
28.8
N/A
N/A
20.3
N/A
N/A
8.4
N/A
0.5
2012
87
78
0.26
N/A
7.8
N/A
30.3
29.3
N/A
N/A
21.0
N/A
N/A
8.9
N/A
0.5
2011
79
80
0.23
N/A
7.9
N/A
30.7
29.0
N/A
N/A
20.8
N/A
N/A
9.1
N/A
0.8
2010
70
80
0.23
N/A
8.5
N/A
27.7
29.9
N/A
N/A
21.8
N/A
N/A
9.8
N/A
0.8
2009
81
73
0.25
N/A
8.7
N/A
29.5
27.8
N/A
N/A
21.2
N/A
N/A
9.2
N/A
1.0
2008
69
87
0.25
N/A
9.6
N/A
25.8
28.3
N/A
N/A
23.3
N/A
N/A
10.0
N/A
1.9
2007
75
102
0.30
0.30
10.6
4.2
24.6
28.8
N/A
N/A
26.0
N/A
N/A
10.9
N/A
2.5
2006
90
96
0.34
0.31
10.2
4.5
29.7
28.6
N/A
N/A
25.8
N/A
N/A
11.3
N/A
2.0
2005
102
98
0.34
0.33
10.9
5.0
28.4
27.9
N/A
N/A
25.0
N/A
11.3
12.2
0.9
2.4
2004
78
95
0.39
0.25
10.6
3.0
25.4
27.1
0.004
N/A
25.0
N/A
N/A
11.8
N/A
3.2
2003
82
93
0.40
0.25
11.1
4.6
27.2
24.3
0.004
N/A
23.9
N/A
N/A
11.5
N/A
3.9
2002
94
84
0.37
0.27
11.8
5.6
25.8
24.8
0.004
N/A
24.2
N/A
N/A
11.5
N/A
4.6
2001
16
102
0.48
0.28
N/A
5.0
N/A
26.8
0.006
N/A
24.9
N/A
N/A
12.1
N/A
4.4
2000
17
100
0.55
0.34
N/A
8.9
N/A
29.9
0.020
N/A
26.3
N/A
N/A
N/A
N/A
4.2
Natural disasters
Type
Fort Worth
St. Petersburg
Tornado activity compared to U.S. average
249.6%
135%
Earthquake activity compared to U.S. average
562.8%
10.8%
Natural disasters compared to U.S. average
23%
24%
Transportation
While both cities have public transit systems, commute times in St. Petersburg can be longer due to its geographical layout. Fort Worth's public transit system, Trinity Metro, operates bus routes, vanpool services, and the Trinity Railway Express, offering residents various options for commuting.
Transport
Type
Fort Worth
St. Petersburg
Amtrak stations
1
0
Amtrak stations nearby
1
3
FAA registered aircraft
2
0
FAA registered aircraft manufacturers and dealers
19
0
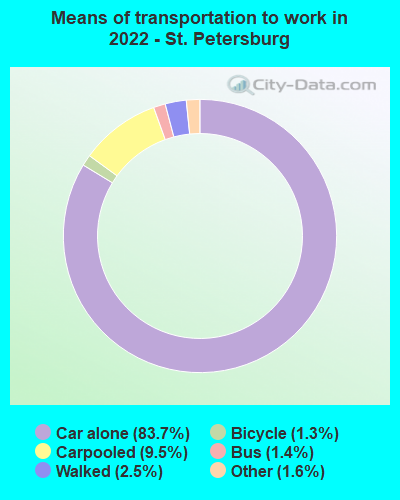
Means of transportation to work
Type
Fort Worth
St. Petersburg
Bicycle
0.1%
1.8%
Bus
0.4%
1.3%
Carpooled
11%
7.6%
Car alone
85.8%
86%
Motorcycle
0.1%
0.2%
Taxicab
0.1%
0.3%
Walked
1.3%
2.1%
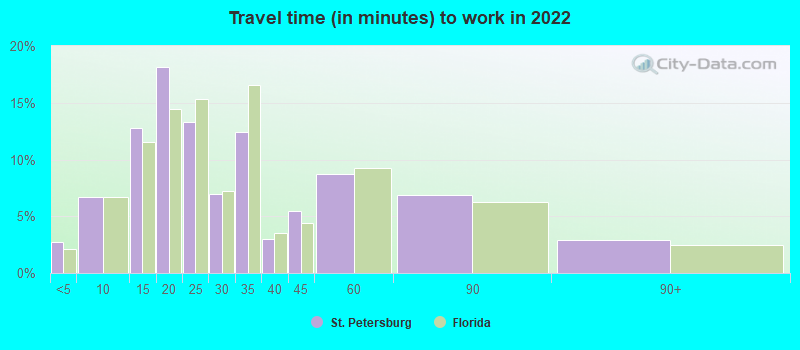
Average travel time to work
Type
Fort Worth
St. Petersburg
Average
28.5 min
26.9 min
Other means
25.3 min
23.1 min
Public transportation
41.8 min
42.8 min
Private vehicle occupancy
Type
Fort Worth
St. Petersburg
Average
1.2
1.1
Drove alone
87.6%
90.2%
In 2 person carpool
8.5%
7.3%
In 3 person carpool
2.5%
2.1%
In 4 person carpool
1.1%
0.3%
In 5-6 person carpool
0.3%
0.1%
How many people usually rode to work in the car, truck or van.
Real Estate
Fort Worth's real estate market has been experiencing a boom, with home prices rising yet remaining affordable compared to the national average. On the other hand, real estate in St. Petersburg is more expensive, with high demand for waterfront properties.
Neighborhoods
Both cities boast numerous neighborhoods each with its unique character. In Fort Worth, the Sundance Square and TCU-West Cliff are popular, offering a mix of suburban and urban lifestyles. On the other hand, St. Petersburg has Old Northeast and Snell Isle offering high-end historic homes and waterfront views.
Houses and residents
Type
Fort Worth
St. Petersburg
Houses
361,341
137,046
Average household size (people)
2.8
2.2
Median year apartment built
1991
1977
Median year house/condo built
1995
1963
Length of stay in the house since moving in
11.2 years
13.3 years
Houses occupied
334,286 (92.5%)
111,349 (81.2%)
Houses occupied by owners
185,197 (55.4%)
70,149 (63%)
Houses occupied by renters
149,089 (44.6%)
41,200 (37%)
Median rent asked for vacant for-rent units
$1,068
$1,453
Median monthly housing costs
$1,328
$1,263
Median price asked for vacant for-sale houses and condos
$288,576
$519,239
Estimated median house or condo value
$249,000
$315,200
Median numbers of rooms
5.3
4.7
Median number of rooms in apartments
4.2
3.7
Median number of rooms in houses and condos
6.3
5.7
Median house price - detached houses
$279,885
$404,297
Median house price - in 2-unit structures
Over $1,000,000
$197,835
Median house price - in 3-to-4-unit structures
$337,081
$209,607
Median house price - in 5 or more unit structures
$298,062
$359,259
Median house price - mobile homes
$58,470
$132,976
Median house price - occupied boats, rvs, vans etc.
$16,069
$145,980
Median house price - Townhouses or other attached units
$279,957
$354,232
Median house price - All housing units
$279,281
$382,002
Median house age
29
53
Renting percentage
40.8%
39.3%
Housing density (houses/condos per square mile)
1,235.2
2,298.4
House value disparities
31.8%
35.5%
Household income disparities
43.6%
45.6%
Median household income for houses/condes with a mortgage
$106,170
$87,073
Median household income for apartments without a mortgage
$72,147
$62,864
Housing units without a mortgage
2,986 (2.4%)
1,104 (2.6%)
Housing units with both a second mortgage and home equity loan
3,696 (3%)
3,287 (7.9%)
Housing units with a mortgage
121,099 (97.6%)
40,624 (97.4%)
Housing units with a home equity loan
66 (0.1%)
44 (0.1%)
Housing units with a second mortgage
5,171 (4.2%)
4,321 (10.4%)
House/condo owner moved in on average (years ago)
8
10
House/condo renter moved in on average (years ago)
1
1
Housing units lacking complete kitchen facilities
1.8%
4.1%
Housing units lacking complete plumbing facilities
0.7%
1.3%
Housing units in structures
Housing units in structures
Fort Worth
St. Petersburg
One, detached
65.4%
55.7%
One, attached
2.9%
2.9%
Two
1.6%
2.8%
3 or 4
4.1%
4.0%
5 to 9
5.8%
6.4%
10 to 19
6.5%
7.6%
20 to 49
4.6%
7.0%
50 or more
7.0%
11.2%
Mobile homes
2.1%
2.2%
Boats, RVs, vans, etc.
0.0%
0.2%
Median real estate property taxes paid for housing units
Self-employed workers in own not incorporated business
27,257
6,512
State government workers
8,587
3,342
Unpaid family workers
392
242
Industries and Occupations
In Fort Worth, aerospace and defense, healthcare, logistics and distribution, and manufacturing sectors dominate the job market. In contrast, St. Petersburg’s economy is largely reliant on the healthcare sector, tourism, retail trade, and financial services.
Both cities excel in healthcare. Fort Worth has the Texas Health Resources system, while St. Petersburg is home to the Johns Hopkins All Children's Hospital. However, St. Petersburg has a higher number of hospitals per capita.
Health (county statistics)
Type
Fort Worth
St. Petersburg
General health status score of residents in this county from 1 (poor) to 5 (excellent)
Fort Worth's infrastructure is modern and designed to accommodate its sprawling urban and suburban areas. Alternatively, St. Petersburg's infrastructure emphasizes its history and unique geographical location with an abundance of bridges and waterfront property. The infrastructure of both cities caters to their respective industries.
Infrastructure
Type
Fort Worth
St. Petersburg
TV stations
25
27
Bank branches located here
175
18
Bank institutions located here
42
6
Main business address for public companies
24
2
Drinking water stations with no reported violations in the past
3
1
Drinking water stations with reported violations in the past
HMDA - Conventional home purchase loans - Applications denied
Year
Fort Worth
St. Petersburg
1999
3,575
1,081
2000
2,473
969
2001
2,109
771
2002
1,701
683
2003
2,183
963
2004
3,202
1,403
2005
4,261
2,041
2006
4,161
2,491
2007
2,871
1,316
2008
1,256
466
2009
585
244
Culture and Food
Both cities offer rich cultural experiences. Fort Worth offers a unique blend of cowboy culture with an impressive arts scene. St. Petersburg, known as the Sunshine City, boasts a vibrant arts and music scene. Both cities offer unique food scenes. Tex-Mex and barbecue dominate Fort Worth, while St. Petersburg is famous for its fresh seafood and Cuban cuisine.
Sports Teams
Fort Worth shares its sports teams with the larger Dallas area, including teams like the Dallas Cowboys (NFL), Dallas Mavericks (NBA), and Texas Rangers (MLB). St. Petersburg is home to the Tampa Bay Rays (MLB), and nearby Tampa hosts the Tampa Bay Buccaneers (NFL) and Tampa Bay Lightning (NHL).


 Fort Worth, TX
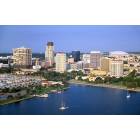
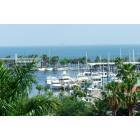
 St. Petersburg, FL