This piece provides a comprehensive comparison between living in Fort Worth, Texas and Upper San Gabriel Valley, California. The comparison encompasses crime and safety rates, weather patterns, cost of living, education levels, work and economy, infrastructure development, major industries and occupations, largest employment providers, real estate market trends, neighborhood dynamics, transportation options, tax regulations, food and cultural scenes, sports affiliations, geographical features, and health care facilities.
Fort Worth, Texas, generally has a higher crime rate compared to the Upper San Gabriel Valley. While both areas face crime issues, Upper San Gabriel Valley residents usually report feeling safer than those in Fort Worth. Both locales have dedicated law enforcement agencies working to lower crime rates, but prospective movers or visitors should keep these differences in mind.
Cost of Living
The cost of living in Upper San Gabriel Valley, like most of California, is significantly higher than in Fort Worth, Texas. This is due to various factors, such as housing costs, utilities, and grocery expenses. While wages in California can be higher than in Texas, the increased cost of living commonly offsets these gains.
Income Tax
One of the significant financial differences is the state income tax. Texas, including Fort Worth, does not have a state income tax. However, California has a progressive income tax, which can be a considerable expense depending upon income level.
Property Tax
Both locales have property taxes, but they are applied differently. Fort Worth, like the rest of Texas, has relatively high property taxes, while California generally has lower rates, but higher property values typically lead to similar tax bills.
Sales Tax
Texas and California have different tax structures. Fort Worth has a total sales tax rate of 8.25%, whereas Upper San Gabriel Valley in California has a total sales tax rate of 9.5% or even higher in some cities. Consumers should consider these tax rates when budgeting for purchases.
Income
Type
Fort Worth
Upper San Gabriel Valley
Estimated median household income
$68,235
$80,436
Estimated per capita income
$34,106
$33,562
Cost of living index (U.S. average is 100)
95.4
159.5
If you make $50,000 in Fort Worth, you will have to make $83,595 in Upper San Gabriel Valley to maintain the same standard of living.
Geographical Conditions
Fort Worth is located in the Prairie and Lakes Region of Texas, with relatively flat terrain and some rolling hills. In contrast, the Upper San Gabriel Valley lies at the foothills of the San Gabriel Mountains, providing beautiful views and numerous hiking opportunities.
Geographical information
Type
Fort Worth
Upper San Gabriel Valley
Land area
292.5 sq. miles
49.4 sq. miles
Population density
3,197.9 people per sq. mile
6,624.2 people per sq. mile
Relative area comparison
Fort Worth, TX Upper San Gabriel Valley, CA
Education
Both locales boast a wide range of educational opportunities. Fort Worth is home to numerous public and private schools, as well as several colleges and universities, including Texas Christian University and the University of North Texas Health Science Center. Upper San Gabriel Valley also offers an extensive selection of schools, plus convenient access to higher education institutions in and around Los Angeles.
The Fort Worth economy is diverse, with industries such as aviation, healthcare, and technology playing significant roles. Upper San Gabriel Valley is part of the Los Angeles metro area, so residents can take advantage of the varied opportunities in LA's vast economy. Both locales offer economic diversity, but job seekers should consider the specific industries prevalent in each area.
Biggest Employers
In Fort Worth, some of the largest employers include American Airlines, Texas Health Resources, and Lockheed Martin Aeronautics. In contrast, within the Upper San Gabriel Valley, employers span across industries with larger employers in the Los Angeles County including UCLA, Northrop Grumman, and Kaiser Permanente.
In Fort Worth (Tarrant County), 41.4% voted for Democrats and 57.1% for Republicans in 2012 Presidential Election. In Upper San Gabriel Valley (Los Angeles County), 69.7% voted for Democrats and 27.8% for Republicans.
Elections
Type
Democrats
Republicans
Other
Year
Fort Worth
Upper San Gabriel Valley
Fort Worth
Upper San Gabriel Valley
Fort Worth
Upper San Gabriel Valley
2020
49.3%
71.0%
49.1%
26.9%
1.6%
2.1%
2016
43.2%
72.0%
51.8%
22.5%
5.0%
5.5%
2012
41.4%
69.7%
57.1%
27.8%
1.4%
2.4%
2008
43.8%
69.2%
55.5%
28.8%
0.7%
1.9%
2004
37.0%
63.3%
62.5%
35.7%
0.5%
1.0%
2000
36.9%
63.6%
60.9%
32.4%
2.3%
4.0%
1996
41.6%
59.3%
50.9%
31.0%
7.5%
9.7%
Breakdown of population affiliated with a religious congregation
Type
Adherents
Congregations
Religion
Fort Worth
Upper San Gabriel Valley
Fort Worth
Upper San Gabriel Valley
SOUTHERN BAPTIST CONVENTION
17.3%
1.0%
33.3%
9.0%
CATHOLIC CHURCH
11.1%
36.1%
1.9%
4.7%
MUSLIM ESTIMATE
2.2%
0.7%
0.9%
1.0%
LUTHERAN CHURCH
0.5%
0.2%
0.9%
1.6%
SEVENTH DAY ADVENTIST CHURCH
0.4%
0.5%
1.6%
2.4%
EPISCOPAL CHURCH
0.3%
0.4%
0.8%
1.4%
AMERICAN BAPTIST CHURCHES IN THE USA
0.0%
0.5%
0.1%
3.1%
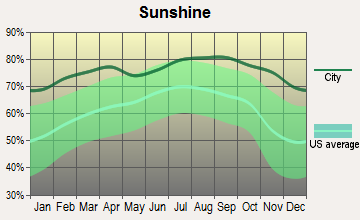
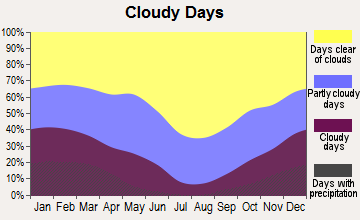
Weather
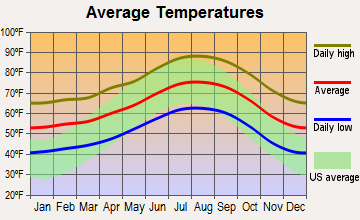
Upper San Gabriel Valley typically enjoys a milder, Mediterranean-style climate, with pleasant year-round temperatures, characterized by mild, somewhat wet winters and hot, dry summers. On the other hand, Fort Worth experiences a hotter and more humid subtropical climate, with hot summers and generally mild winters. Both climates have their charms, but potential residents should consider their weather preferences.
Weather and climate
Type
Fort Worth
Upper San Gabriel Valley
Temperature - Average
65°F
63.5°F
Humidity - Average morning or afternoon humidity
71.4%
62.2%
Humidity - Differences between morning and afternoon humidity
34.1%
17.3%
Humidity - Maximum monthly morning or afternoon humidity
82.1%
67%
Humidity - Minimum monthly morning or afternoon humidity
48%
49.7%
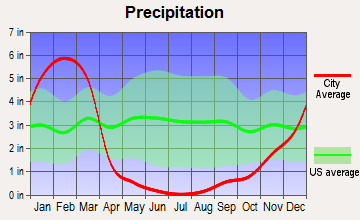
Precipitation - Yearly average
35 in
24.3 in
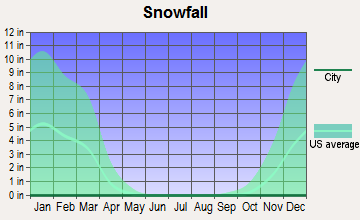
Snowfall - Yearly average
4.2 in
0 in
Clouds - Number of days clear of clouds
22.8%
29.4%
Sunshine amount - Average
66.6%
78.4%
Sunshine amount - Differences during a year
20%
22%
Sunshine amount - Maximum monthly
74%
85%
Sunshine amount - Minimum monthly
54%
63%
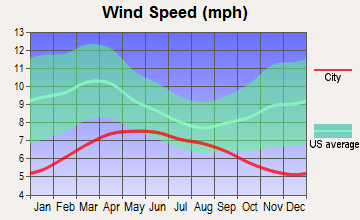
Wind speed - Average
10.3 mph
2.6 mph
Average climate in Fort Worth, Texas
Average climate in Upper San Gabriel Valley, California
Air pollution
Type
AQI
CO
NO2
OZONE
PB
PM10
PM25
SO2
Year
Fort Worth
Upper San Gabriel Valley
Fort Worth
Upper San Gabriel Valley
Fort Worth
Upper San Gabriel Valley
Fort Worth
Upper San Gabriel Valley
Upper San Gabriel Valley
Upper San Gabriel Valley
Fort Worth
Upper San Gabriel Valley
Fort Worth
Upper San Gabriel Valley
2018
67
142
N/A
0.37
5.8
14.2
27.1
28.5
0.007
N/A
28.5
N/A
N/A
14.1
N/A
0.4
2017
67
146
N/A
0.36
6.2
15.1
27.2
29.8
0.007
N/A
31.2
N/A
N/A
14.0
N/A
0.5
2016
56
136
N/A
0.33
6.3
15.5
25.5
28.1
0.007
N/A
28.6
N/A
N/A
13.0
N/A
0.4
2015
61
143
N/A
0.33
6.5
15.2
24.8
28.4
0.007
N/A
28.4
N/A
N/A
15.2
N/A
0.3
2014
56
141
0.22
0.35
6.8
16.7
26.6
28.0
0.007
N/A
31.3
N/A
N/A
14.9
N/A
0.5
2013
64
144
0.25
0.39
6.4
17.3
26.5
26.6
0.007
N/A
29.3
N/A
N/A
14.4
N/A
0.4
2012
87
148
0.26
0.43
7.8
18.2
30.3
25.9
0.006
N/A
28.7
N/A
N/A
16.5
N/A
0.5
2011
79
146
0.23
0.47
7.9
19.1
30.7
24.8
0.008
N/A
28.9
N/A
N/A
17.6
N/A
0.5
2010
70
133
0.23
0.48
8.5
19.2
27.7
24.6
0.011
N/A
27.0
N/A
N/A
15.5
N/A
0.5
2009
81
153
0.25
0.39
8.7
21.0
29.5
25.4
0.011
N/A
32.0
N/A
N/A
17.2
N/A
0.4
2008
69
155
0.25
0.54
9.6
23.1
25.8
24.9
0.013
N/A
32.1
N/A
N/A
16.9
N/A
0.6
2007
75
135
0.30
0.55
10.6
24.6
24.6
23.1
0.016
N/A
N/A
N/A
N/A
N/A
N/A
1.0
2006
90
128
0.34
0.58
10.2
24.9
29.7
22.8
0.009
N/A
N/A
N/A
N/A
N/A
N/A
1.5
2005
102
128
0.34
0.61
10.9
25.4
28.4
21.3
0.015
N/A
N/A
N/A
11.3
N/A
0.9
1.7
2004
78
134
0.39
0.71
10.6
26.0
25.4
23.8
0.018
N/A
N/A
N/A
N/A
N/A
N/A
2.4
2003
82
143
0.40
0.89
11.1
30.7
27.2
23.3
0.025
N/A
N/A
N/A
N/A
N/A
N/A
1.6
2002
94
137
0.37
0.91
11.8
32.5
25.8
21.9
0.022
N/A
N/A
N/A
N/A
N/A
N/A
2.2
2001
16
143
0.48
1.04
N/A
33.1
N/A
20.1
0.031
N/A
N/A
N/A
N/A
N/A
N/A
2.3
2000
17
151
0.55
1.07
N/A
33.5
N/A
20.1
0.028
N/A
N/A
N/A
N/A
N/A
N/A
1.3
Natural disasters
Type
Fort Worth
Upper San Gabriel Valley
Tornado activity compared to U.S. average
249.6%
18%
Earthquake activity compared to U.S. average
562.8%
7,264.5%
Natural disasters compared to U.S. average
23%
57%
Transportation
Fort Worth provides public transportation via buses, with rail service to other Texas cities. Upper San Gabriel Valley is serviced by the LA Metro and Foothill Transit, providing access to the greater LA area. Residents of both locales often rely on cars for commuting, but public transit is an option.
Transport
Type
Fort Worth
Upper San Gabriel Valley
Amtrak stations
1
0
Amtrak stations nearby
1
3
FAA registered aircraft
2
0
FAA registered aircraft manufacturers and dealers
19
0
Means of transportation to work
Type
Fort Worth
Upper San Gabriel Valley
Bicycle
0.1%
1.1%
Bus
0.4%
3.9%
Carpooled
11%
16.6%
Car alone
85.8%
71.1%
Motorcycle
0.1%
0.1%
Taxicab
0.1%
0.1%
Walked
1.3%
3.2%
Average travel time to work
Type
Fort Worth
Upper San Gabriel Valley
Average
28.5 min
29.1 min
Real Estate
Fort Worth real estate is significantly more affordable than in the Upper San Gabriel Valley. Prices in California tend to be higher due to demand and the cost of living. Potential homeowners should assess their budget and financial goals before deciding which locale is best for them.
Neighborhoods
Both locales feature diverse neighborhoods, each with its own unique charm. Fort Worth boasts family-friendly suburbs, vibrant downtown living, and fast-growing communities like North Fort Worth. The neighborhoods in Upper San Gabriel Valley vary significantly, from suburban Arcadia to the denser communities of El Monte and Baldwin Park.
Houses and residents
Type
Fort Worth
Upper San Gabriel Valley
Houses
361,341
99,295
Average household size (people)
2.8
3.3
Houses occupied
334,286 (92.5%)
96,186 (96.9%)
Houses occupied by owners
185,197 (55.4%)
52,398 (54.5%)
Houses occupied by renters
149,089 (44.6%)
43,788 (45.5%)
Median rent asked for vacant for-rent units
$1,068
$1,771
Median price asked for vacant for-sale houses and condos
$288,576
$1,138,428
Estimated median house or condo value
$249,000
$740,686
Median number of rooms in apartments
4.2
3.7
Median number of rooms in houses and condos
6.3
5.9
Renting percentage
40.8%
44.9%
Housing density (houses/condos per square mile)
1,235.2
2,008.8
Household income disparities
43.6%
44%
Housing units without a mortgage
2,986 (2.4%)
11,525 (24.8%)
Housing units with both a second mortgage and home equity loan
3,696 (3%)
137 (0.3%)
Housing units with a mortgage
121,099 (97.6%)
34,867 (75.2%)
Housing units with a home equity loan
66 (0.1%)
3,133 (6.8%)
Housing units with a second mortgage
5,171 (4.2%)
4,036 (8.7%)
Housing units lacking complete kitchen facilities
1.8%
1.5%
Housing units lacking complete plumbing facilities
Self-employed workers in own not incorporated business
27,257
10,209
State government workers
8,587
3,180
Unpaid family workers
392
401
Industries and Occupations
Fort Worth's economy is characterized by several robust industries such as aeronautics, healthcare, and education. Upper San Gabriel Valley, being part of the larger LA metropolitan area, has a diverse economy with entertainment, aerospace, technology, and healthcare as significant sectors. Job seekers would do well to consider the industries they're interested in.
Both locales offer high-quality healthcare options. Fort Worth has numerous respected healthcare facilities, such as the Baylor Scott & White All Saints Medical Center. Upper San Gabriel Valley residents can access top-tier healthcare options throughout Los Angeles County.
Health (county statistics)
Type
Fort Worth
Upper San Gabriel Valley
General health status score of residents in this county from 1 (poor) to 5 (excellent)
Fort Worth has a well-developed infrastructure, with an international airport, well-maintained roads, and robust public services. Upper San Gabriel Valley also has sound infrastructure, with easy access to Los Angeles' public amenities and services. However, both areas face infrastructure pressures due to growth and traffic concerns.
Infrastructure
Type
Fort Worth
Upper San Gabriel Valley
TV stations
25
27
Culture and Food
Fort Worth offers a blend of Texan and Western culture, with a rich culinary scene focused on BBQ and Tex-Mex. Upper San Gabriel Valley presents a more diverse cultural experience, heavily influenced by various ethnic communities, particularly Chinese and Hispanic, leading to a rich and varied food scene.
Sports Teams
Residents of both locales have plenty of professional sports to follow. Fort Worth residents can support the Dallas Cowboys (NFL), Texas Rangers (MLB), and Dallas Mavericks (NBA). Upper San Gabriel Valley residents can cheer on the Los Angeles Lakers (NBA), LA Dodgers (MLB), and the LA Rams (NFL).
 Fort Worth, TX
 Upper San Gabriel Valley, CA