Fresno, CA vs Long Beach, CA - Advanced U.S. city comparison tool

Fresno, CA vs Long Beach, CA

Fresno and Long Beach are two renowned cities in California, each with its unique characteristics. Fresno, located in the heart of the San Joaquin Valley, is surrounded by agricultural lands, while Long Beach nestles in the southernmost part of LA County. Comparing these cities offers useful insights into factors such as crime and safety, cost of living, education, work and economy, and other vital aspects shaping their identities and lifestyles.
 
 
Distance between Fresno, CA and Long Beach, CA : 225.4 miles

Fresno's population is larger by 19%. Its population has grown by 116,858 people (27.3%) since 2000. The population of Long Beach has decreased by 5,460 people (1.2%) during that time.

Population
Type Fresno Long Beach
Population 544,510 456,062
Female / male percentage 50.3% / 49.7%
50.3%
49.7%
51.3% / 48.7%
51.3%
48.7%
Racial makeup - percentage
Ethnicity FresnoLong Beach
Hispanic 49.7% 42.3%
White Non-Hispanic 24.9% 26.7%
Asian 14.3% 14.7%
Black 6.0% 11.0%
Two or more 3.8% 4.2%
American Indian 0.5% 0.2%
Pacific Islander 0.2% 0.2%
Racial makeup - absolute values
Ethnicity FresnoLong Beach
Hispanic 270,662 193,000
White Non-Hispanic 135,441 121,546
Asian 77,924 67,238
Black 32,833 50,199
Two or more 20,849 19,258
American Indian 2,543 1,107
Pacific Islander 1,277 1,026

Crime and Safety

Safety is a notable concern for both residents and tourists. Being larger and more densely populated, Long Beach naturally has a higher frequency of crime compared to Fresno. However, both cities are generally safe to live and visit. Policing efforts in both areas consistently focus on curtailing crime rates and ensuring public safety.

Crime by year per 100,000 residents
Type City-data.com crime indexRobberies per 100,000Murders per 100,000Rapes per 100,000Assaults per 100,000Burglaries per 100,000Theft per 100,000Auto theft per 100,000Arson per 100,000
Year FresnoLong BeachFresnoLong BeachFresnoLong BeachFresnoLong BeachFresnoLong BeachFresnoLong BeachFresnoLong BeachFresnoLong BeachFresnoLong Beach
2020 351.9 312.7 166.0 155.8 14.4 7.8 27.6 52.3 456.8 290.5 567.0 552.0 2,014.9 1,593.6 494.9 600.9 29.7 42.8
2019 268.8 297.4 128.6 204.7 6.6 7.3 24.1 53.2 300.6 241.0 434.4 466.9 1,914.9 1,443.2 383.9 503.9 18.9 32.7
2018 326.4 335.4 170.9 208.1 6.0 6.4 32.0 46.6 346.4 437.0 554.5 494.9 2,345.4 1,554.9 444.7 484.4 49.6 27.0
2017 365.8 339.7 182.0 262.4 10.6 4.7 33.1 43.1 339.3 347.7 693.2 586.6 2,618.3 1,507.0 529.9 578.9 41.2 26.9
2016 377.6 342.8 213.8 238.8 7.4 6.9 30.1 41.3 359.6 310.2 704.5 627.1 2,580.4 1,758.1 625.8 600.0 49.5 24.6
2015 376.8 337.8 194.3 221.3 7.5 7.6 32.1 37.2 317.4 314.7 850.4 649.6 2,723.3 1,766.3 574.7 594.1 49.0 14.5
2014 347.0 284.9 152.2 188.7 9.2 4.9 10.3 23.3 292.5 272.1 919.9 739.1 2,587.2 1,459.3 604.7 441.7 50.5 16.6
2013 378.6 304.8 177.5 238.0 7.9 7.2 10.4 21.9 305.8 232.3 1,026.4 804.0 2,614.4 1,462.3 797.2 501.4 36.2 20.7
2012 425.7 335.4 200.6 263.7 10.1 6.8 10.7 24.5 321.7 280.7 1,166.4 808.5 3,069.9 1,639.1 850.0 559.7 26.5 22.1
2011 431.2 323.9 203.8 282.2 7.0 5.3 10.2 23.9 361.5 299.3 1,141.5 700.2 2,982.7 1,567.1 955.1 473.0 27.2 22.0
2010 434.7 312.2 206.4 260.0 9.1 6.9 14.2 29.0 383.7 292.5 1,063.8 633.6 2,960.6 1,411.3 920.4 473.5 29.7 17.1
2009 400.1 348.0 225.4 297.6 8.7 8.6 17.9 28.2 357.3 346.8 918.8 671.6 2,775.2 1,544.5 674.7 508.9 32.2 23.1
2008 406.4 353.5 206.8 318.4 8.4 8.6 16.8 25.7 352.7 323.5 877.2 659.5 2,965.2 1,507.1 793.9 614.9 47.1 27.8
2007 421.2 361.8 233.8 317.7 11.0 8.9 21.0 29.1 378.7 367.1 825.3 612.9 2,763.6 1,522.1 852.0 603.4 47.0 26.0
2006 488.2 357.9 275.5 301.1 11.2 8.6 28.6 28.0 442.1 377.4 938.4 605.5 3,029.9 1,379.5 1,062.6 686.6 55.9 21.5
2005 455.5 316.5 276.7 292.5 10.6 8.8 32.3 21.7 526.1 385.6 905.0 616.0 3,491.6 1,419.1 1,147.7 780.2 53.8 25.6
2004 453.5 346.1 269.8 318.7 11.6 10.0 39.6 28.5 444.5 423.5 874.6 674.7 3,748.7 1,546.3 1,149.0 795.5 91.1 39.5
2003 462.0 340.6 270.1 295.6 8.2 10.3 36.5 28.5 464.3 415.4 872.9 629.1 3,913.8 1,690.9 1,258.3 785.1 133.8 45.5

City-data.com crime index counts serious crimes and violent crime more heavily. It adjusts for the number of visitors and daily workers commuting into cities. (higher means more crime, U.S. average = 301.1)


Crime per year
Type City-data.com crime indexRobberiesMurdersRapesAssaultsBurglariesTheftAuto theftArson
Year FresnoLong BeachFresnoLong BeachFresnoLong BeachFresnoLong BeachFresnoLong BeachFresnoLong BeachFresnoLong BeachFresnoLong BeachFresnoLong Beach
2019 268.8 297.4 687 958 35 34 129 249 1,606 1,128 2,321 2,185 10,231 6,754 2,051 2,358 101 153
2018 326.4 335.4 909 979 32 30 170 219 1,842 2,056 2,949 2,328 12,473 7,315 2,365 2,279 264 127
2017 365.8 339.7 958 1,237 56 22 174 203 1,786 1,639 3,649 2,765 13,782 7,104 2,789 2,729 217 127
2016 377.6 342.8 1,122 1,138 39 33 158 197 1,887 1,478 3,697 2,988 13,542 8,377 3,284 2,859 260 117
2015 376.8 337.8 1,012 1,054 39 36 167 177 1,653 1,499 4,429 3,094 14,184 8,413 2,993 2,830 255 69
2014 347.0 284.9 781 889 47 23 53 110 1,501 1,282 4,721 3,482 13,277 6,875 3,103 2,081 259 78
2013 378.6 304.8 903 1,118 40 34 53 103 1,556 1,091 5,223 3,776 13,304 6,868 4,057 2,355 184 97
2012 425.7 335.4 1,015 1,239 51 32 54 115 1,628 1,319 5,902 3,799 15,534 7,702 4,301 2,630 134 104
2011 431.2 323.9 1,020 1,320 35 25 51 112 1,809 1,400 5,713 3,275 14,928 7,329 4,780 2,212 136 103
2010 434.7 312.2 1,021 1,202 45 32 70 134 1,898 1,352 5,262 2,929 14,645 6,524 4,553 2,189 147 79
2009 400.1 348.0 1,085 1,381 42 40 86 131 1,720 1,609 4,423 3,116 13,359 7,166 3,248 2,361 155 107
2008 406.4 353.5 984 1,487 40 40 80 120 1,678 1,511 4,173 3,080 14,106 7,039 3,777 2,872 224 130
2007 421.2 361.8 1,104 1,506 52 42 99 138 1,788 1,740 3,897 2,905 13,049 7,214 4,023 2,860 222 123
2006 488.2 357.9 1,282 1,440 52 41 133 134 2,057 1,805 4,366 2,896 14,097 6,598 4,944 3,284 260 103
2005 455.5 316.5 1,275 1,403 49 42 149 104 2,424 1,850 4,170 2,955 16,088 6,808 5,288 3,743 248 123
2004 453.5 346.1 1,232 1,533 53 48 181 137 2,030 2,037 3,994 3,245 17,119 7,437 5,247 3,826 416 190
2003 462.0 340.6 1,215 1,411 37 49 164 136 2,089 1,983 3,927 3,003 17,608 8,072 5,661 3,748 602 217

City-data.com crime index counts serious crimes and violent crime more heavily. It adjusts for the number of visitors and daily workers commuting into cities. (higher means more crime, U.S. average = 301.1)

Sex Offenders

According to our data, there are 1,478 registered sex offenders living in Fresno and 807 registered sex offenders living in .
The ratio of residents to sex offenders in Fresno is 353 to 1; the ratio in Long Beach is 583 to 1.
The number of registered sex offenders compared to the number of residents is larger in Fresno than in Long Beach.

Cost of Living

The cost of living in Long Beach is markedly higher than in Fresno, attributable to factors like housing and transportation costs. Long Beach's firm proximity to Los Angeles and the Pacific Ocean explains these higher expenses. Nevertheless, both cities offer a wide range of affordable options in terms of groceries, utilities, and healthcare.

Income Tax

Income tax rates in both Fresno and Long Beach adhere strictly to California state law, with the same progressive income tax system applicable in both cities.

Property Tax

Property tax rates in these cities again follow California's state guidelines. However, the average property tax paid tends to be higher in Long Beach due to more expensive real estate.

Sales Tax

The sales tax for both cities is higher than the national average, predominantly due to California's notable high state sales tax. However, Long Beach has a marginally higher combined city and state tax compared to Fresno.
Income
Type Fresno Long Beach
Estimated median household income $61,250 $73,905
Estimated per capita income $28,499 $37,217
Cost of living index (U.S. average is 100) 96.3 142

If you make $50,000 in Fresno, you will have to make $73,728 in Long Beach to maintain the same standard of living.

Geographical Conditions

Fresno is within the San Joaquin Valley and surrounded by farmland, while Long Beach is a coastal city with a bustling port, providing an attractive ocean-front landscape.
Geographical information
Type Fresno Long Beach
Land area 104.4 sq. miles 50.4 sq. miles
Population density 5,217.4 people per sq. mile 9,041.5 people per sq. mile
Elevation 296 feet 29 feet
Relative area comparison
Fresno, CA Long Beach, CA
First ancestry reported - percentage
Ancestry FresnoLong Beach
German 2.7% 1.9%
Irish 1.6% 2.3%
English 1.5% 1.7%
Italian 1.2% 1.6%
Portuguese 0.5% 0.1%
Arab 0.4% 0.0%
Scottish 0.3% 0.4%
Dutch 0.2% 0.3%
French 0.2% 0.4%
Norwegian 0.2% 0.5%
Scotch-Irish 0.2% 0.1%
Swedish 0.2% 0.3%
Polish 0.1% 0.5%
Russian 0.1% 0.4%
Population origin - absolute values
Ancestry FresnoLong Beach
German 9,151 5,503
Irish 5,490 6,493
English 4,921 4,947
Italian 4,187 4,619
Portuguese 1,687 358
Arab 1,234 74
Scottish 917 1,033
Swedish 799 942
Scotch-Irish 794 344
Norwegian 632 1,408
French 529 1,168
Dutch 508 716
Greek 490 472
Danish 465 215
Ukrainian 439 365
Russian 379 1,164
Czech 376 534
Polish 357 1,476
Welsh 294 285
Hungarian 174 184
Foreign born residents - absolute values
Type Count
Region FresnoLong Beach
All 102,381 114,152
Africa 1,314 2,106
Asia 43,128 35,668
Europe 3,665 5,584
Latin America 54,338 69,194
North America 706 1,339
Oceania 323 987
Foreign born residents - percentage
Type Percentage
Region FresnoLong Beach
All 18.8% 24.9%
Africa 0.2% 0.5%
Asia 7.9% 7.8%
Europe 0.7% 1.2%
Latin America 10.0% 15.1%
North America 0.1% 0.3%
Oceania 0.1% 0.2%

Education

Both cities are home to top-rated universities and public schools. Fresno is recognized for institutions like California State University, Fresno City College, and numerous public schools. Similarly, Long Beach has California State University, Long Beach City College, and a diverse array of public schools.
School enrollment
Type Fresno Long Beach
Nursery, preschool 5,551 (3.6%) 3,330 (3.1%)
Kindergarten 8,615 (5.7%) 5,130 (4.8%)
Grade 1 to 4 30,954 (20.3%) 20,647 (19.3%)
Grade 5 to 8 33,276 (21.9%) 20,797 (19.4%)
Grade 9 to 12 33,683 (22.1%) 19,650 (18.3%)
College undergrad 30,959 (20.3%) 29,958 (27.9%)
Graduate or professional 9,136 (6%) 7,707 (7.2%)
Students in private schools - absolute values
Type Count
Grade FresnoLong Beach
Grades 1 to 8 (elementary and middle school) 3,647 3,638
Grades 9 to 12 (high school) 1,687 1,393
Undergraduate colleges 4,746 3,750
Students in private schools - percentage
Type Percentage
Grade FresnoLong Beach
Grades 1 to 8 (elementary and middle school) 5.7% 8.8%
Grades 9 to 12 (high school) 5.0% 7.1%
Undergraduate colleges 15.3% 12.5%
Educational attainment
Type Fresno Long Beach
Less than high school 19.9% 16.4%
High school or equiv. 23.8% 18.5%
Less than 1 year of college 6.1% 5.2%
1 or more years of college 16.7% 15.5%
Associate degree 7.4% 7.4%
Bachelor's degree 17.8% 23.9%
Master's degree 5.5% 9.5%
Profess. school degree 1.8% 1.9%
Doctorate degree 1% 1.7%
Education level (25-year-olds and older)
Type Fresno Long Beach
Bachelor's degree or higher 26.1% 37%
Graduate or professional degree 8.3% 13.1%
High school or higher 80.1% 83.6%

Work and Economy

Fresno's economy is primarily underpinned by agriculture, healthcare, and education. Long Beach, meanwhile, is a hub for aerospace, health services, and the port industry. Both cities boast diverse workforces and are constantly developing their economies.

Biggest Employers

In Fresno, Community Medical Centers, Fresno County, and the City of Fresno are among the key employers. In Long Beach, the city’s largest employers include Long Beach Unified School District, City of Long Beach, and the Long Beach Memorial Medical Center.
Employment and residency - absolute values
Kind FresnoLong Beach
Work and live in this city 118,757 61,685
Work and live in this county 205,890 190,126
Workers who work outside the city they live in 308,895 399,837
Workers who work outside the county they live in 16,861 34,274
Working at home 27,136 44,800
Not working at home 195,615 179,600
Daytime population change due to commuting 31,387 N/A
Employment and residency - percentage
Kind FresnoLong Beach
Work and live in this city 75.8% 33.4%
Work and live in this county 92.4% 84.7%
Workers who work outside the city they live in 24.2% 66.6%
Workers who work outside the county they live in 7.6% 15.3%
Working at home 12.2% 20.0%
Not working at home 87.8% 80.0%
Daytime population change due to commuting 7.3% N/A
Geographical mobility: all
Type all
Mobility FresnoLong Beach
Same house 1 year ago 87.6% 89.0%
Moved from abroad 0.3% 0.4%
Moved within same county 8.8% 6.8%
Moved from different state 0.8% 1.6%
Moved within same state 2.5% 2.3%
Geographical mobility: Asian
Type Asian
Mobility FresnoLong Beach
Same house 1 year ago 91.9% 90.6%
Moved from abroad 1.3% 0.3%
Moved within same county 2.8% 4.6%
Moved from different state 0.4% 1.7%
Moved within same state 3.6% 2.8%
Geographical mobility: Black
Type Black
Mobility FresnoLong Beach
Same house 1 year ago 86.0% 88.1%
Moved from abroad 0.0% 0.2%
Moved within same county 10.9% 5.9%
Moved from different state 0.5% 3.5%
Moved within same state 2.5% 2.3%
Geographical mobility: White
Type White
Mobility FresnoLong Beach
Same house 1 year ago 86.6% 87.6%
Moved from abroad 0.2% 0.7%
Moved within same county 9.3% 6.8%
Moved from different state 1.2% 2.0%
Moved within same state 2.7% 2.9%
Building permits
Type Average valueCount
City FresnoLong BeachFresnoLong Beach
1997 $119,300 $134,500 1,323 55
1998 $118,900 $163,700 1,576 161
1999 $128,900 $182,500 1,459 81
2000 $138,800 $190,100 1,398 114
2001 $138,900 $225,700 1,588 91
2002 $132,000 $202,400 1,139 107
2003 $156,900 $210,000 1,547 67
2004 $163,900 $208,300 2,109 84
2005 $165,700 $201,900 2,247 85
2006 $165,200 $197,100 1,600 129
2007 $156,200 $264,900 2,016 60
2008 $156,200 $341,100 1,230 31
2009 $142,700 $238,500 1,090 14
2010 $187,700 $203,700 990 44
2011 $186,500 $209,100 706 66
2012 $239,600 $264,500 755 23
2013 $272,500 $248,600 1,160 20
2014 $270,800 $234,600 641 25
2015 $286,000 $230,900 844 20
2016 $292,500 $371,900 1,005 22
2017 $290,700 $215,300 680 104
2018 $312,400 $198,100 821 128
2019 $313,100 $169,400 1,153 100
2020 $300,200 $62,600 1,214 174
2021 $267,900 $72,800 1,911 304

There were 1,911 building permits issued in Fresno in 2012 (1205 more than in 2011) compared to 304 building permits issued in Long Beach in 2012 (238 more than in 2011).

In Fresno (Fresno County), 49.8% voted for Democrats and 48.0% for Republicans in 2012 Presidential Election. In Long Beach (Los Angeles County), 69.7% voted for Democrats and 27.8% for Republicans.

Elections
Type DemocratsRepublicansOther
Year FresnoLong BeachFresnoLong BeachFresnoLong Beach
2020 53.0% 71.0% 45.2% 26.9% 1.8% 2.1%
2016 49.2% 72.0% 43.2% 22.5% 7.5% 5.5%
2012 49.8% 69.7% 48.0% 27.8% 2.2% 2.4%
2008 50.2% 69.2% 48.1% 28.8% 1.8% 1.9%
2004 42.0% 63.3% 57.8% 35.7% 0.3% 1.0%
2000 43.2% 63.6% 53.3% 32.4% 3.5% 4.0%
1996 45.3% 59.3% 47.4% 31.0% 7.3% 9.7%
Breakdown of population affiliated with a religious congregation
Type AdherentsCongregations
Religion FresnoLong BeachFresnoLong Beach
CATHOLIC CHURCH 31.0% 36.1% 6.1% 4.7%
SOUTHERN BAPTIST CONVENTION 1.6% 1.0% 8.1% 9.0%
SEVENTH DAY ADVENTIST CHURCH 0.7% 0.5% 2.6% 2.4%
AMERICAN BAPTIST CHURCHES IN THE USA 0.6% 0.5% 2.4% 3.1%
EVANGELICAL LUTHERAN CHURCH IN AMERICA 0.5% 0.2% 2.0% 1.9%
MUSLIM ESTIMATE 0.3% 0.7% 0.6% 1.0%
EPISCOPAL CHURCH 0.0% 0.4% 0.1% 1.4%

Weather

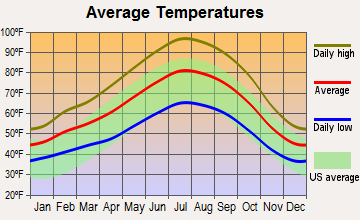
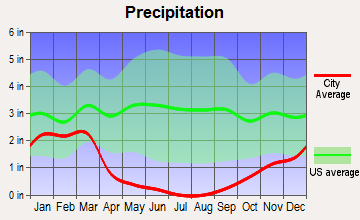
Fresno experiences a Mediterranean climate, categorized by wet winters and hot, dry summers. The city typically has over 300 sunny days per year. Conversely, Long Beach sees a Mediterranean climate with semi-arid qualities. Known for its warm and sunny weather year-round, it’s a terrific spot for tourists desiring sunny beach days.
Weather and climate
Type Fresno Long Beach
Temperature - Average 63°F 65.3°F
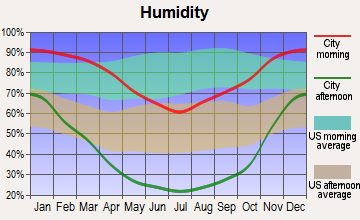
Humidity - Average morning or afternoon humidity 60.9% 70.4%
Humidity - Differences between morning and afternoon humidity 67% 27%
Humidity - Maximum monthly morning or afternoon humidity 88% 79%
Humidity - Minimum monthly morning or afternoon humidity 21% 52%
Precipitation - Yearly average 11.6 in 13.1 in
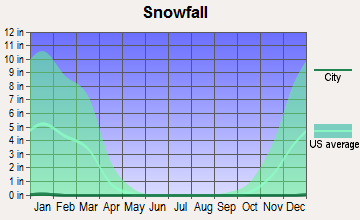
Snowfall - Yearly average 0 in 0 in
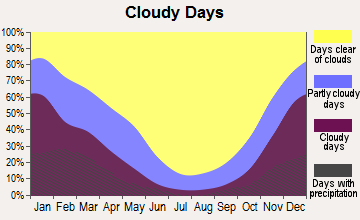
Clouds - Number of days clear of clouds 32.4% 26.4%
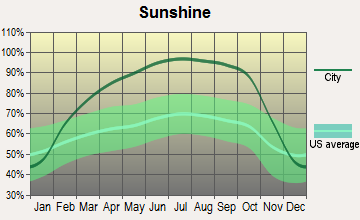
Sunshine amount - Average 82.8% 78.4%
Sunshine amount - Differences during a year 52% 22%
Sunshine amount - Maximum monthly 96% 85%
Sunshine amount - Minimum monthly 44% 63%
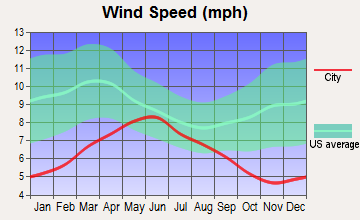
Wind speed - Average 6.5 mph 6.1 mph

Average climate in Fresno, California

Chicago, Illinois average temperatures Chicago, Illinois average precipitation Chicago, Illinois humidity Chicago, Illinois wind speed Chicago, Illinois snowfall Chicago, Illinois sunshine Chicago, Illinois clear and cloudy days
 

Average climate in Long Beach, California

Chicago, Illinois average temperatures Chicago, Illinois average precipitation Chicago, Illinois humidity Chicago, Illinois wind speed Chicago, Illinois snowfall Chicago, Illinois sunshine Chicago, Illinois clear and cloudy days
 

Air pollution
Type AQICONO2OZONEPBPM10PM25SO2
Year FresnoLong BeachFresnoLong BeachFresnoLong BeachFresnoLong BeachFresnoLong BeachFresnoLong BeachFresnoLong BeachFresnoLong Beach
2018 128 124 0.35 0.37 9.7 17.2 31.7 22.1 N/A 0.008 39.7 27.5 14.8 13.5 0.6 0.7
2017 132 122 0.35 0.36 9.2 18.1 33.2 23.2 N/A 0.007 38.3 26.7 14.3 14.5 0.6 0.8
2016 128 115 0.35 0.36 8.4 18.5 31.4 21.9 N/A 0.007 34.7 24.1 13.5 11.6 0.5 0.9
2015 134 111 0.32 0.38 8.7 19.9 31.1 22.5 N/A 0.005 34.2 25.0 13.9 13.9 0.5 0.9
2014 139 127 0.33 0.50 10.1 20.3 32.4 22.0 0.004 0.007 39.3 26.7 16.4 14.3 0.5 1.3
2013 136 126 0.37 0.48 11.1 20.0 31.0 24.7 0.005 0.005 43.3 32.3 19.1 14.6 0.6 1.0
2012 140 132 0.36 0.48 9.7 19.3 31.9 24.4 0.004 0.004 36.1 30.8 14.2 14.1 0.6 0.6
2011 139 119 0.34 0.43 8.7 20.2 33.5 23.4 N/A 0.006 30.2 28.4 21.1 15.6 0.8 1.2
2010 121 115 0.27 0.38 6.9 20.8 31.1 22.7 N/A 0.011 N/A 24.1 N/A 11.9 0.7 0.7
2009 107 132 0.31 0.50 7.3 21.0 29.6 22.0 N/A 0.008 N/A 27.7 N/A 13.1 1.6 1.1
2008 130 124 0.33 0.53 9.3 20.8 31.1 23.2 N/A 0.008 N/A 27.2 22.2 21.6 1.0 1.0
2007 146 109 0.34 0.60 10.0 20.3 28.4 21.1 N/A 0.010 N/A N/A 26.0 N/A 0.7 1.4
2006 104 119 0.36 0.76 11.3 21.4 29.7 19.9 0.006 0.005 N/A N/A N/A N/A N/A 1.7
2005 101 108 0.33 0.74 10.7 24.3 28.1 20.5 N/A 0.011 N/A N/A N/A N/A N/A 2.7
2004 103 125 0.34 0.56 11.5 28.0 30.8 22.9 N/A 0.012 N/A N/A N/A N/A N/A 2.0
2003 115 130 0.44 0.83 15.0 28.1 31.2 22.4 N/A 0.032 N/A N/A N/A N/A 1.2 1.1
2002 139 120 0.43 0.90 15.2 29.6 44.8 22.2 N/A 0.011 N/A N/A N/A N/A N/A 2.8
2001 143 124 0.42 0.81 15.1 30.3 47.3 21.5 N/A 0.011 N/A N/A N/A N/A N/A 3.3
2000 136 142 0.51 0.71 15.4 31.5 41.0 19.6 N/A 0.018 N/A N/A N/A N/A N/A 2.0
Natural disasters
Type Fresno Long Beach
Tornado activity compared to U.S. average 9.9% 18.3%
Earthquake activity compared to U.S. average 8,613% 6,875.1%
Natural disasters compared to U.S. average 12% 57%

Transportation

Both cities have solid public transportation systems. Fresno boasts an extensive bus network, while Long Beach secures transportation through buses, a metro rail and bike-sharing programs. Commuting times in Long Beach are noticeably higher than in Fresno due to heavier traffic patterns.
Transport
Type Fresno Long Beach
Amtrak stations 1 1
Amtrak stations nearby 2 3
FAA registered aircraft 408 312
FAA registered aircraft manufacturers and dealers 36 29
Means of transportation to work
Type Fresno Long Beach
Bicycle 0.8% 0.5%
Bus 1.3% 3.3%
Carpooled 10.7% 9.8%
Car alone 84.4% 81.8%
Motorcycle 0.2% 0.2%
Subway 0.1% 0.5%
Walked 1.4% 2.8%
Means of transportation to work
Average travel time to work
Type Fresno Long Beach
Average 23.7 min 30.7 min
Other means 21.5 min 28.5 min
Public transportation 45.3 min 46.4 min
Travel time to work
Time leaving to work
Travel time to work
Time leaving to work
Private vehicle occupancy
Type Fresno Long Beach
Average 1.2 1.1
Drove alone 88.3% 89.7%
In 2 person carpool 8.5% 8.5%
In 3 person carpool 1.8% 1.4%
In 4 person carpool 0.8% 0.3%
In 5-6 person carpool 0.5% 0%
In 7+ person carpool 0.1% 0%

How many people usually rode to work in the car, truck or van.

Real Estate

Real estate in Long Beach is notably more expensive than Fresno due to its proximity to Los Angeles and desirable beachfront location. In contrast, Fresno offers more affordable housing options, with a thriving market attractive to first-time homebuyers.

Neighborhoods

Fresno touts diverse neighborhoods characterized by different cultural communities and socio-economic levels. Long Beach boasts vibrant neighborhoods entrenched in arts and culture, complete with beach access.
Houses and residents
Type Fresno Long Beach
Houses 188,756 179,856
Average household size (people) 3.1 2.8
Median year apartment built 1977 1964
Median year house/condo built 1983 1954
Length of stay in the house since moving in 12.6 years 15.7 years
Houses occupied 181,841 (96.3%) 172,599 (96%)
Houses occupied by owners 91,233 (50.2%) 69,470 (40.2%)
Houses occupied by renters 90,608 (49.8%) 103,129 (59.8%)
Median rent asked for vacant for-rent units $958.34 $1,057
Median monthly housing costs $1,209 $1,692
Median price asked for vacant for-sale houses and condos $285,919 $520,992
Estimated median house or condo value $321,300 $693,600
Median numbers of rooms 5 4.2
Median number of rooms in apartments 4 3.6
Median number of rooms in houses and condos 5.9 5.5
Median house price - detached houses $375,492 $900,658
Median house price - in 2-unit structures $184,112 $823,515
Median house price - in 3-to-4-unit structures $196,355 $495,928
Median house price - in 5 or more unit structures $287,684 $488,399
Median house price - mobile homes $100,122 $333,777
Median house price - Townhouses or other attached units $260,277 $634,684
Median house price - All housing units $358,028 $805,766
Median house age 42 62
Renting percentage 50.9% 58.4%
Housing density (houses/condos per square mile) 1,808.6 3,565.7
House value disparities 29.4% 21.3%
Household income disparities 46.4% 44.7%
Median household income for houses/condes with a mortgage $97,354 $116,421
Median household income for apartments without a mortgage $73,445 $79,392
Housing units without a mortgage 1,037 (1.7%) 394 (0.8%)
Housing units with both a second mortgage and home equity loan 2,880 (4.8%) 3,069 (6.2%)
Housing units with a mortgage 59,354 (98.3%) 49,321 (99.2%)
Housing units with a home equity loan 68 (0.1%) 48 (0.1%)
Housing units with a second mortgage 4,120 (6.8%) 3,709 (7.5%)
House/condo owner moved in on average (years ago) 10 15
House/condo renter moved in on average (years ago) 3 3
Housing units lacking complete kitchen facilities 1.5% 2.6%
Housing units lacking complete plumbing facilities 0.4% 0.4%
Housing units in structures
Housing units in structures FresnoLong Beach
One, detached 59.0% 40.2%
One, attached 3.2% 4.9%
Two 3.0% 5.3%
3 or 4 7.8% 8.8%
5 to 9 9.6% 10.4%
10 to 19 3.6% 10.8%
20 to 49 3.4% 8.0%
50 or more 7.5% 10.6%
Mobile homes 2.6% 0.8%
Boats, RVs, vans, etc. 0.1% 0.2%
Median real estate property taxes paid for housing units
Type Fresno Long Beach
With mortgages $2,634 (0.8%) $5,222 (0.8%)
With no mortgages $1,869 (0.6%) $3,496 (0.5%)
Marital status
Type Fresno Long Beach
Divorced 9.2% 8%
Never married 41.7% 46.9%
Now married 41.2% 38.5%
Separated 2.6% 1.9%
Widowed 5.2% 4.7%
Class of workers - percentage
Class of Workers FresnoLong Beach
Employee of private company 61.5% 67.5%
Local government workers 11.6% 8.5%
Private not-for-profit wage and salary workers 9.7% 9.1%
Self-employed workers in own not incorporated business 6.3% 8.0%
State government workers 4.3% 2.8%
Federal government workers 3.2% 1.6%
Self-employed in own incorporated business 3.0% 2.4%
Unpaid family workers 0.4% 0.1%
Class of workers - absolute values
Class of Workers FresnoLong Beach
Employee of private company 141,742 156,053
Federal government workers 7,428 3,620
Local government workers 26,826 19,737
Private not-for-profit wage and salary workers 22,470 20,943
Self-employed in own incorporated business 6,920 5,524
Self-employed workers in own not incorporated business 14,428 18,532
State government workers 9,836 6,550
Unpaid family workers 890 178

Industries and Occupations

Fresno's robust sectors plant it firmly in agriculture, healthcare, and education. Long Beach, conversely, thrives with aerospace, maritime, and healthcare industries. These dominant sectors significantly influence the occupations prevalent in these cities.
Most common male industries
Industry FresnoLong Beach
Construction 11.8% 8.9%
Retail trade 11.6% 12.8%
Health care and social assistance 9.1% 7.7%
Transportation and warehousing 8.5% 10.4%
Manufacturing 8.0% 10.7%
Public administration 7.1% 2.7%
Accommodation and food services 6.7% 6.4%
Educational services 6.5% 6.0%
Professional, scientific, and technical services 5.2% 11.7%
Other services, except public administration 4.9% 4.3%
Agriculture, forestry, fishing and hunting 4.9% 0.2%
Administrative and support and waste management services 4.6% 4.6%
Wholesale trade 3.8% 3.3%
Finance and insurance 2.5% 2.3%
Information 1.8% 2.8%
Arts, entertainment, and recreation 1.2% 2.5%
Utilities 1.2% 0.8%
Real estate and rental and leasing 0.6% 1.6%
Management of companies and enterprises 0.1% 0.1%
Mining, quarrying, and oil and gas extraction 0.0% 0.1%
Most common female industries
Industry FresnoLong Beach
Health care and social assistance 27.1% 23.2%
Educational services 11.0% 11.8%
Retail trade 9.1% 12.0%
Public administration 7.2% 3.9%
Accommodation and food services 7.0% 6.9%
Other services, except public administration 6.4% 5.3%
Professional, scientific, and technical services 5.8% 7.6%
Finance and insurance 4.5% 3.6%
Transportation and warehousing 4.1% 5.0%
Manufacturing 3.7% 5.5%
Administrative and support and waste management services 3.4% 4.4%
Agriculture, forestry, fishing and hunting 3.3% 0.4%
Construction 1.8% 1.5%
Real estate and rental and leasing 1.7% 2.4%
Wholesale trade 1.5% 1.8%
Arts, entertainment, and recreation 1.1% 2.1%
Information 0.9% 2.0%
Utilities 0.5% 0.7%
Most common male occupations
Occupation FresnoLong Beach
Construction and extraction occupations 9.6% 5.3%
Sales and related occupations 9.1% 10.2%
Management occupations 9.0% 10.6%
Office and administrative support occupations 8.2% 7.3%
Transportation occupations 6.5% 7.0%
Material moving occupations 6.0% 6.2%
Food preparation and serving related occupations 5.7% 4.6%
Production occupations 5.5% 6.7%
Installation, maintenance, and repair occupations 4.6% 3.9%
Business and financial operations occupations 4.3% 5.5%
Building and grounds cleaning and maintenance occupations 4.0% 4.7%
Educational instruction, and library occupations 3.7% 3.6%
Farming, fishing, and forestry occupations 3.7% 0.1%
Computer and mathematical occupations 2.5% 4.2%
Health diagnosing and treating practitioners and other technical occupations 2.3% 2.4%
Architecture and engineering occupations 2.1% 4.0%
Firefighting and prevention, and other protective service workers including supervisors 1.9% 1.5%
Health technologists and technicians 1.8% 1.2%
Community and social service occupations 1.8% 1.0%
Healthcare support occupations 1.6% 1.9%
Most common female occupations
Occupation FresnoLong Beach
Office and administrative support occupations 17.4% 18.3%
Healthcare support occupations 9.2% 6.5%
Sales and related occupations 9.1% 10.5%
Management occupations 9.1% 9.3%
Educational instruction, and library occupations 8.5% 7.0%
Business and financial operations occupations 5.8% 7.4%
Health diagnosing and treating practitioners and other technical occupations 5.4% 4.9%
Food preparation and serving related occupations 4.6% 5.2%
Personal care and service occupations 3.9% 3.6%
Health technologists and technicians 3.7% 2.8%
Community and social service occupations 3.7% 4.4%
Material moving occupations 3.7% 2.8%
Building and grounds cleaning and maintenance occupations 3.4% 2.9%
Production occupations 2.7% 2.7%
Farming, fishing, and forestry occupations 2.5% 0.4%
Arts, design, entertainment, sports, and media occupations 1.9% 3.0%
Life, physical, and social science occupations 1.1% 1.3%
Transportation occupations 1.0% 1.4%
Legal occupations 0.9% 1.3%
Computer and mathematical occupations 0.6% 1.9%
Food environment data per 10,000 residents
Food environment statistics FresnoLong Beach
Number of convenience stores (no gas) 2.1 1.2
Number of convenience stores (with gas) 1.2 0.6
Number of full-service restaurants 5.8 7.2
Number of grocery stores 2.4 2.1
Food environment - absolute values
Food environment statistics FresnoLong Beach
Number of convenience stores (no gas) 190 1,206
Number of convenience stores (with gas) 108 567
Number of full-service restaurants 516 7,008
Number of grocery stores 215 2,084
Number of supercenters and club stores 4 32
Obesity and diabetes
Food environment statistics rate FresnoLong Beach
Adult diabetes rate 7.6% 7.5%
Adult obesity rate 26.4% 20.4%
Low-income preschool obesity rate 17.5% 18.6%

Health Care

While Fresno and Long Beach both offer quality healthcare, the latter is often rated higher in terms of healthcare access and quality. Both host significant hospital systems and numerous community health centers.

Fatal vehicle accidents per 100,000 residents
Type Total count per 100,000Drunk per 100,000Fatal count per 100,000Pedestrian count per 100,000Person count per 100,000Vehicle count per 100,000
Year FresnoLong BeachFresnoLong BeachFresnoLong BeachFresnoLong BeachFresnoLong BeachFresnoLong Beach
2021 14.9 7.0 0.0 0.0 15.8 7.2 6.6 4.8 33.6 11.4 23.3 9.9
2020 12.4 6.2 3.0 1.1 13.5 6.5 7.4 4.3 24.5 10.8 17.2 10.8
2019 8.5 7.9 2.6 1.5 8.9 8.3 4.7 5.5 18.1 14.2 13.0 12.2
2018 5.3 6.9 0.8 2.2 5.3 7.3 2.7 2.2 10.3 15.6 7.2 12.1
2017 10.7 5.6 3.2 0.9 11.8 5.8 5.5 1.9 25.6 11.4 17.9 8.6
2016 9.4 7.7 2.3 1.7 9.6 7.9 4.8 3.6 18.8 14.5 12.5 11.3
2015 3.7 6.2 1.0 1.9 3.7 6.8 1.4 3.0 9.5 11.5 5.6 8.9
2014 4.7 4.9 0.8 1.1 4.7 4.9 2.3 1.7 9.7 10.8 7.2 8.0
2013 5.1 5.8 0.6 1.3 5.3 6.0 3.3 2.1 14.1 13.8 8.0 11.5
2012 6.7 7.7 2.6 2.4 7.1 8.5 4.7 3.8 11.9 15.0 8.9 12.2
2011 7.2 5.6 1.8 1.1 7.2 5.8 3.4 1.7 15.0 13.5 10.4 8.8
2010 6.1 5.6 1.2 2.2 7.7 6.3 3.6 2.4 19.4 11.9 9.7 8.4
2009 6.3 6.1 2.3 1.5 6.9 6.3 2.1 2.4 16.3 12.3 10.4 9.5
2008 7.6 5.7 3.6 2.2 8.2 6.1 3.4 2.0 17.3 14.8 10.1 9.3
2007 7.9 8.5 3.7 3.7 8.4 8.7 2.8 3.7 20.8 20.4 12.0 12.0
2006 8.9 7.5 3.5 2.6 9.1 8.0 3.0 2.2 20.6 19.4 13.0 12.9
2005 10.3 6.4 3.7 1.9 10.3 7.1 3.9 1.7 25.0 20.5 14.9 11.1
2004 10.6 7.0 6.6 3.4 11.0 7.4 2.2 2.1 27.8 17.2 16.8 9.8
2003 12.9 7.6 7.1 3.6 14.2 8.1 6.0 1.9 40.3 21.4 20.7 11.9
2002 13.1 4.7 6.1 1.7 15.1 4.7 5.2 2.8 41.5 12.6 20.5 6.6
2001 9.6 4.7 5.1 2.2 10.1 4.7 3.0 3.2 24.8 12.3 15.4 6.7
2000 7.5 7.4 2.1 3.0 8.2 7.4 1.6 2.4 23.4 19.1 13.1 10.8
1999 11.1 5.5 5.2 2.3 13.6 6.4 4.5 1.8 37.9 19.3 17.6 9.9
1998 10.5 4.9 4.0 1.4 10.8 5.1 4.8 2.3 36.8 12.5 17.8 7.4
1997 9.1 7.5 2.0 3.5 10.6 8.6 4.0 2.3 26.4 23.4 12.8 11.2
1996 12.7 8.2 6.1 2.1 13.4 8.5 4.6 5.9 33.7 25.4 18.3 12.0
1995 11.5 7.5 4.1 1.6 12.2 7.7 3.3 4.2 40.0 21.3 19.1 10.5
1994 13.3 7.6 5.4 3.0 15.4 8.3 3.1 3.7 43.1 24.3 21.5 12.7
1993 14.0 7.6 4.2 3.0 14.8 9.2 5.5 2.5 44.7 22.2 22.1 13.4
1992 12.7 10.1 6.4 3.9 15.4 10.6 3.4 3.7 44.0 27.1 22.2 14.7
1991 13.6 13.1 7.3 5.5 14.6 13.6 3.8 4.4 41.2 36.0 22.8 21.0
1990 15.1 13.5 6.7 5.3 15.9 14.6 0.0 0.0 38.9 33.7 21.5 19.0
1989 15.6 14.4 6.8 6.6 17.0 14.9 0.0 0.0 40.2 38.1 21.7 21.1
1988 13.5 12.3 6.4 4.3 14.4 13.2 0.0 0.0 41.6 32.2 21.1 17.8
1987 14.0 15.6 6.7 6.8 16.0 16.1 0.0 0.0 39.3 38.6 20.4 22.2
1986 13.7 13.4 5.0 6.0 14.7 13.7 0.0 0.0 36.7 36.0 21.0 18.6
1985 15.0 14.4 4.2 4.6 15.7 15.4 0.0 0.0 41.6 37.4 20.6 21.2
1984 15.1 11.6 7.7 6.2 17.3 11.6 0.0 0.0 44.1 32.7 22.4 17.8
1983 12.4 13.9 3.5 6.0 12.8 14.9 0.0 0.0 28.6 37.4 17.4 20.2
1982 11.4 12.8 4.1 6.1 11.8 13.1 0.0 0.0 29.0 31.5 16.3 16.8
1981 16.0 17.4 8.7 7.6 17.7 18.5 0.0 0.0 42.0 39.4 25.5 23.4
1980 15.6 16.6 4.6 6.9 16.1 18.0 0.0 0.0 41.4 35.4 23.0 23.0
1979 20.3 20.2 7.5 10.0 20.7 20.8 0.0 0.0 46.6 47.3 29.7 29.3
1978 14.5 18.6 6.3 2.2 18.8 19.4 0.0 0.0 45.9 36.8 23.2 24.7
1977 18.8 19.1 8.4 6.9 18.8 19.7 0.0 0.0 50.0 47.1 30.7 26.1
1976 11.7 14.4 2.5 5.5 12.2 15.0 0.0 0.0 33.0 29.4 20.8 20.8
1975 12.0 14.4 2.6 5.6 12.5 15.0 0.0 0.0 33.9 29.4 21.4 20.8

Fatal vehicle accidents
Type Total countDrunkFatal countPedestrian countPerson countVehicle count
Year FresnoLong BeachFresnoLong BeachFresnoLong BeachFresnoLong BeachFresnoLong BeachFresnoLong Beach
1975 23 52 5 20 24 54 0 0 65 106 41 75
1976 23 52 5 20 24 54 0 0 65 106 41 75
1977 38 69 17 25 38 71 0 0 101 170 62 94
1978 30 67 13 8 39 70 0 0 95 133 48 89
1979 43 73 16 36 44 75 0 0 99 171 63 106
1980 34 60 10 25 35 65 0 0 90 128 50 83
1981 37 64 20 28 41 68 0 0 97 145 59 86
1982 28 48 10 23 29 49 0 0 71 118 40 63
1983 32 53 9 23 33 57 0 0 74 143 45 77
1984 41 45 21 24 47 45 0 0 120 127 61 69
1985 43 57 12 18 45 61 0 0 119 148 59 84
1986 41 54 15 24 44 55 0 0 110 145 63 75
1987 44 64 21 28 50 66 0 0 123 158 64 91
1988 44 51 21 18 47 55 0 0 136 134 69 74
1989 53 61 23 28 58 63 0 0 137 161 74 89
1990 54 58 24 23 57 63 0 0 139 145 77 82
1991 50 57 27 24 54 59 14 19 152 156 84 91
1992 48 44 24 17 58 46 13 16 166 118 84 64
1993 54 33 16 13 57 40 21 11 172 96 85 58
1994 52 33 21 13 60 36 12 16 168 105 84 55
1995 45 32 16 7 48 33 13 18 157 91 75 45
1996 50 35 24 9 53 36 18 25 133 108 72 51
1997 36 32 8 15 42 37 16 10 105 100 51 48
1998 42 21 16 6 43 22 19 10 147 54 71 32
1999 45 24 21 10 55 28 18 8 153 84 71 43
2000 32 34 9 14 35 34 7 11 100 88 56 50
2001 42 22 22 10 44 22 13 15 108 57 67 31
2002 58 22 27 8 67 22 23 13 184 59 91 31
2003 58 36 32 17 64 38 27 9 181 101 93 56
2004 48 33 30 16 50 35 10 10 126 81 76 46
2005 47 30 17 9 47 33 18 8 114 96 68 52
2006 41 35 16 12 42 37 14 10 95 90 60 60
2007 37 39 17 17 39 40 13 17 97 94 56 55
2008 36 26 17 10 39 28 16 9 82 68 48 43
2009 30 28 11 7 33 29 10 11 78 57 50 44
2010 30 26 6 10 38 29 18 11 96 55 48 39
2011 36 26 9 5 36 27 17 8 75 63 52 41
2012 34 36 13 11 36 40 24 18 60 70 45 57
2013 26 27 3 6 27 28 17 10 72 65 41 54
2014 24 23 4 5 24 23 12 8 50 51 37 38
2015 19 29 5 9 19 32 7 14 49 54 29 42
2016 49 36 12 8 50 37 25 17 98 68 65 53
2017 56 26 17 4 62 27 29 9 134 53 94 40
2018 28 32 4 10 28 34 14 10 54 72 38 56
2019 45 36 14 7 47 38 25 25 96 65 69 56
2020 67 29 16 5 73 30 40 20 133 50 93 50
2021 81 32 0 0 86 33 36 22 183 52 127 45
Police full-time law enforcement employees
Year FresnoLong Beach
2021 1,070 1,023
2020 1,026 1,174
2019 1,077 1,203
2018 1,063 1,164
2017 1,059 1,180
2016 1,013 1,173
2015 959 1,123
2014 947 1,105
2013 900 1,117
2012 934 1,131
2011 952 1,193
2010 1,007 1,252
2009 1,217 1,328
2008 1,267 1,361
2007 1,254 1,377
2006 1,217 1,363
2005 1,177 1,344
2004 1,140 1,355
2003 1,069 1,438
Police full-time law enforcement employees (per 1,000 residents)
Year FresnoLong Beach
2021 2.0 2.3
2020 1.9 2.5
2019 2.0 2.6
2018 2.0 2.5
2017 2.0 2.5
2016 1.9 2.5
2015 1.8 2.4
2014 1.8 2.3
2013 1.8 2.4
2012 1.8 2.4
2011 1.9 2.6
2010 2.0 2.7
2009 2.5 2.9
2008 2.7 2.9
2007 2.7 2.9
2006 2.6 2.9
2005 2.6 2.8
2004 2.5 2.8
2003 2.4 3.0
Local government: full-time employees
Job FresnoLong Beach
Airports 97 99
Financial administration 100 139
Firefighters 301 389
Fire - other 47 89
Judicial and legal 40 98
Other and unallocable 199 834
Other government administration 96 143
Parks and recreation 71 193
Police - other 242 261
Police protection - officers 816 786
Sewerage 163 30
Solid waste management 156 115
Streets and highways 305 101
Totals for government 3,361 5,289
Transit 466 694
Water supply 262 197
Water transport and terminals 0 490
Local government: part-time employees
Job FresnoLong Beach
Airports 23 5
Financial administration 9 10
Fire - other 3 43
Judicial and legal 5 8
Other and unallocable 22 46
Other government administration 5 41
Parks and recreation 301 425
Police - other 39 80
Sewerage 0 3
Solid waste management 0 9
Streets and highways 23 3
Totals for government 457 877
Transit 16 34
Water supply 11 8
Water transport and terminals 0 23
Place of birth - Foreign born
Residents FresnoLong Beach
All residents 19.2% 24.2%
American Indian / Alaska Native residents 16.3% 27.0%
Asian residents 46.9% 58.4%
Black or African American residents 4.1% 2.2%
Native Hawaiian / Pacific Islander residents 26.1% 0.0%
Other race residents 27.1% 37.2%
Two or more races residents 13.3% 20.3%
White residents 6.8% 13.8%
White alone, not Hispanic / Latino residents 6.4% 7.5%
Place of birth - Native, outside of US
Residents FresnoLong Beach
All residents 1.1% 1.6%
American Indian / Alaska Native residents 1.5% 1.2%
Asian residents 1.7% 2.3%
Black or African American residents 1.1% 1.3%
Native Hawaiian / Pacific Islander residents 6.9% 16.3%
Other race residents 1.2% 1.2%
Two or more races residents 0.8% 2.4%
White residents 1.0% 0.8%
White alone, not Hispanic / Latino residents 0.8% 1.0%
Place of birth - Born in state of residence
Residents FresnoLong Beach
All residents 70.3% 58.6%
American Indian / Alaska Native residents 75.9% 65.2%
Asian residents 47.1% 33.7%
Black or African American residents 77.6% 73.5%
Native Hawaiian / Pacific Islander residents 42.8% 59.0%
Other race residents 67.3% 58.4%
Two or more races residents 80.1% 67.3%
White residents 74.7% 61.2%
White alone, not Hispanic / Latino residents 72.2% 60.3%
Place of birth - Born in other state
Residents FresnoLong Beach
All residents 9.4% 15.5%
American Indian / Alaska Native residents 6.3% 6.6%
Asian residents 4.3% 5.6%
Black or African American residents 17.2% 23.0%
Native Hawaiian / Pacific Islander residents 24.3% 24.7%
Other race residents 4.4% 3.1%
Two or more races residents 5.8% 9.9%
White residents 17.5% 24.3%
White alone, not Hispanic / Latino residents 20.6% 31.2%
English speakers (speaking English at home)
Type Fresno Long Beach
Born in the United States residents 80% 88.7%
Foreign born residents 8.7% 9.9%
Native, born elsewhere residents 55.1% 51.9%
Total residents 56.9% 54%
Mechanisms of homicide
Mechanism FresnoLong Beach
Homicides from 2000 to 2006 458 7,493
Cut / Pierce 79 577
Firearm 313 6,003
Poisoning 0 21
Struck by / against 0 39
Suffocation 0 166
Terrorism 0 23
Transportation - Related, Overall 0 34
Mechanisms of homicide per 1,000,000 residents
Mechanism FresnoLong Beach
Homicides from 2000 to 2006 77.8 110.2
Cut / Pierce 13.4 8.5
Firearm 53.2 88.3
Suffocation 0 2.4
Mechanisms of suicide per 1,000,000 residents
Mechanism FresnoLong Beach
Suicides from 2000 to 2006 84.8 72.9
Cut / Pierce 0 2.0
Fall 0 3.8
Firearm 42.5 30.7
Poisoning 8.8 11.9
Suffocation 25.3 20.5

Infrastructure

Fresno’s infrastructure is well-kept and continuously growing, marked by expanding suburban areas and downtown revitalization. Long Beach is known for its extensive port infrastructure and public amenities, making it a compelling place for tourists and new residents.
Infrastructure
Type Fresno Long Beach
Hospitals 32 17
TV stations 4 5
Arenas or stadiums 2 2
Bank branches located here 98 67
Bank institutions located here 25 18
Main business address for public companies 1 11
Drinking water stations with no reported violations in the past 5 2
Drinking water stations with reported violations in the past 43 1

Schools

School facilities
Type Fresno Long Beach
Private elementary/middle schools 8 24
Private high schools 9 8
Public elementary/middle schools 131 61
Public high schools 44 14
Colleges/Universities 14 7
HMDA - Conventional home purchase loans - Applications denied
Year FresnoLong Beach
1999 717 1,159
2000 484 710
2001 462 677
2002 569 708
2003 1,510 1,861
2004 2,462 2,162
2005 3,394 3,065
2006 3,441 3,591
2007 2,138 2,287
2008 760 887
2009 354 475

Culture and Food

Both cities have rich cultural scenes. Fresno, surrounded by agriculture, is renowned for fresh farm-to-table foods, several vineyards, and craft breweries. Meanwhile, Long Beach presents an eclectic array of global cuisines, thanks to its diverse population and coastal location.

Sports Teams

While neither city hosts any major professional sports teams, both maintain a passionate sports culture. Fresno enjoys minor-league baseball and soccer, while Long Beach offers water sports and sailing events.
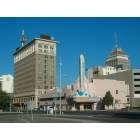