When comparing Fresno and Riverside, California, they equally offer unique experiences based on lifestyle preferences. Fresno is in the Central Valley, surrounded by agricultural lands, whereas Riverside is closer to coastal areas, presenting diverse geographical conditions. Despite their contrasts, both cities have an array of industries and employers, adequate infrastructure, and blooming real estate markets. However, they differ in terms of crime rates, weather, cost of living, education, and specific cultural elements. Let's dive deep into these aspects for an exhaustive comparison.
Distance between
Fresno, CA and
Riverside, CA : 237.8 miles
Fresno's population is larger by 72%. Its population has grown by 116,858 people (27.3%) since 2000. The population of Riverside has grown by 62,095 people (24.3%) during that time.
In terms of safety, both areas have crime rates that are higher than the national average, but Fresno's crime rate tends to be slightly higher than Riverside's. The violent crime rate and property crime rate are typically higher in Fresno. However, developments are underway in both cities to increase security and safety for residents and visitors, such as community policing, and surveillance technologies.
City-data.com crime index counts serious crimes and violent crime more heavily. It adjusts for the number of visitors and daily workers commuting into cities. (higher means more crime, U.S. average = 301.1)
City-data.com crime index counts serious crimes and violent crime more heavily. It adjusts for the number of visitors and daily workers commuting into cities. (higher means more crime, U.S. average = 301.1)
Sex Offenders
According to our data, there are 1,478 registered sex offenders living in Fresno and 616 registered sex offenders living in . The ratio of residents to sex offenders in Fresno is 353 to 1; the ratio in Riverside is 527 to 1. The number of registered sex offenders compared to the number of residents is larger in Fresno than in Riverside.
Cost of Living
The cost of living in Riverside is slightly higher than in Fresno. This can be attributed to higher housing costs in Riverside due to its proximity to coastal areas. Additionally, the cost of goods and services tends to be higher in Riverside than in Fresno. However, Fresno's cost of living is above the national average as well, due to California's overall high cost of living.
Income Tax
Both cities are subject to California's progressive income tax system. The state has ten tax brackets, ranging from 1% to 13.3%, with the same tax rates applying to both cities. As such, income tax doesn't offer a significant difference between the two cities.
Property Tax
Property taxes in both cities are calculated based on the assessed home value. While the average property tax rate in California is 0.77%, Riverside's rate is slightly higher than Fresno's, reflective of the generally higher property values in Riverside.
Sales Tax
The sales tax rate in Fresno is 7.975% while Riverside has a slightly higher sales tax rate of 8.75%. These rates are significantly higher than the national average due to the high state-level rate in California.
Income
Type
Fresno
Riverside
Estimated median household income
$61,250
$76,558
Estimated per capita income
$28,499
$29,013
Cost of living index (U.S. average is 100)
96.3
83
If you make $50,000 in Riverside, you will have to make $58,012 in Fresno to maintain the same standard of living.
Geographical Conditions
Fresno is part of California's San Joaquin Valley, surrounded by farmlands and foothills on its outskirts. It has relatively flat terrain. Meanwhile, Riverside lies along the Santa Ana River, with a mix of flat and hilly terrain. It's closer to beaches compared to Fresno, adding to its geographical appeal.
Fresno is home to the well-regarded California State University, Fresno (Fresno State), creating a college-city feel. It also has a range of highly-rated elementary, middle, and high schools. Riverside plays host to the prestigious University of California Riverside, among others, and has a robust education system from elementary to high school level. Both cities offer strong education systems for residents.
Both cities foster a diverse economy. Fresno's economy has a significant presence in the agriculture, healthcare, and education sectors. Similarly, Riverside's economy is well-diversified with sectors such as education, healthcare, retail, and manufacturing playing a significant role. Unemployment rates in both cities average around the national rate, with varying job growth potential.
Biggest Employers
In Fresno, the main employers are Community Medical Centers, the City of Fresno, Saint Agnes Medical Center, and the Fresno Unified School District. Meanwhile, in Riverside, top employers include the University of California, Riverside, Riverside Unified School District, and the City of Riverside.
There were 1,911 building permits issued in Fresno in 2012 (1205 more than in 2011) compared to 293 building permits issued in Riverside in 2012 (250 more than in 2011).
In Fresno (Fresno County), 49.8% voted for Democrats and 48.0% for Republicans in 2012 Presidential Election. In Riverside (Riverside County), 49.6% voted for Democrats and 48.0% for Republicans.
Elections
Type
Democrats
Republicans
Other
Year
Fresno
Riverside
Fresno
Riverside
Fresno
Riverside
2020
53.0%
53.0%
45.2%
45.0%
1.8%
2.0%
2016
49.2%
49.7%
43.2%
44.4%
7.5%
5.9%
2012
49.8%
49.6%
48.0%
48.0%
2.2%
2.4%
2008
50.2%
50.4%
48.1%
48.1%
1.8%
1.5%
2004
42.0%
41.3%
57.8%
58.2%
0.3%
0.6%
2000
43.2%
45.0%
53.3%
51.6%
3.5%
3.4%
1996
45.3%
43.0%
47.4%
45.6%
7.3%
11.3%
Breakdown of population affiliated with a religious congregation
Type
Adherents
Congregations
Religion
Fresno
Riverside
Fresno
Riverside
CATHOLIC CHURCH
31.0%
27.5%
6.1%
4.5%
SOUTHERN BAPTIST CONVENTION
1.6%
1.2%
8.1%
11.2%
SEVENTH DAY ADVENTIST CHURCH
0.7%
0.9%
2.6%
3.4%
AMERICAN BAPTIST CHURCHES IN THE USA
0.6%
0.0%
2.4%
0.7%
EVANGELICAL LUTHERAN CHURCH IN AMERICA
0.5%
0.3%
2.0%
1.5%
MUSLIM ESTIMATE
0.3%
0.5%
0.6%
0.7%
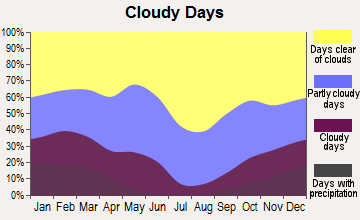
Weather
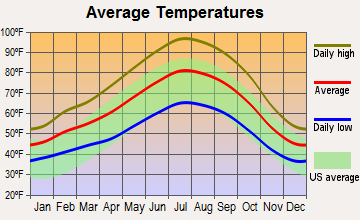
When it comes to weather, Riverside, which lies in a semi-arid Mediterranean climate zone, is hotter in summer with daily temperatures often reaching 95°F. Fresno, on the other hand, enjoys a Mediterranean climate with hot, dry summers and mild, wet winters, though temperatures can rise above 100°F occasionally. Fresno, indeed, is known for its perfect weather, suitable for outdoor enthusiasts.
Weather and climate
Type
Fresno
Riverside
Temperature - Average
63°F
66°F
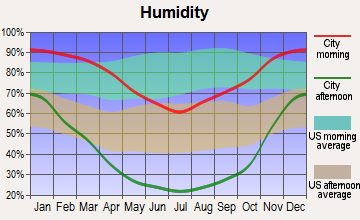
Humidity - Average morning or afternoon humidity
60.9%
66.7%
Humidity - Differences between morning and afternoon humidity
67%
21.4%
Humidity - Maximum monthly morning or afternoon humidity
88%
73.5%
Humidity - Minimum monthly morning or afternoon humidity
21%
52.1%
Precipitation - Yearly average
11.6 in
10.3 in
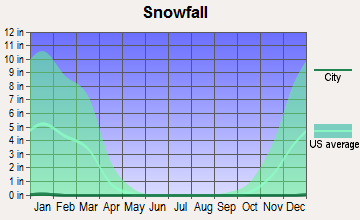
Snowfall - Yearly average
0 in
0 in
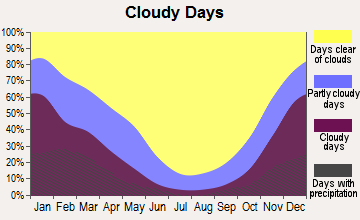
Clouds - Number of days clear of clouds
32.4%
27.3%
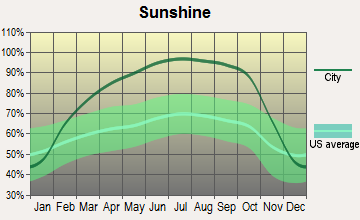
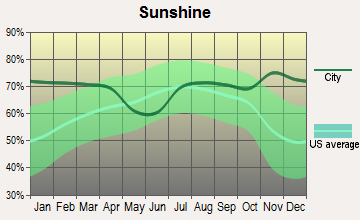
Sunshine amount - Average
82.8%
78.2%
Sunshine amount - Differences during a year
52%
21.5%
Sunshine amount - Maximum monthly
96%
84.2%
Sunshine amount - Minimum monthly
44%
62.6%
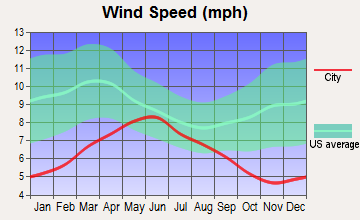
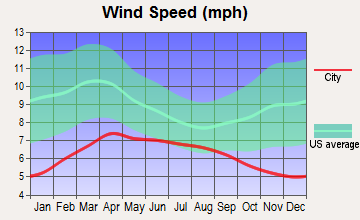
Wind speed - Average
6.5 mph
4.5 mph
Average climate in Fresno, California
Average climate in Riverside, California
Air pollution
Type
AQI
CO
NO2
OZONE
PB
PM10
PM25
SO2
Year
Fresno
Riverside
Fresno
Riverside
Fresno
Riverside
Fresno
Riverside
Fresno
Riverside
Fresno
Riverside
Fresno
Riverside
Fresno
Riverside
2018
128
153
0.35
0.35
9.7
14.4
31.7
29.8
N/A
0.006
39.7
44.6
14.8
13.6
0.6
0.4
2017
132
151
0.35
0.34
9.2
14.7
33.2
31.5
N/A
0.004
38.3
48.4
14.3
14.8
0.6
0.3
2016
128
140
0.35
0.33
8.4
14.8
31.4
30.9
N/A
0.006
34.7
44.4
13.5
14.5
0.5
0.2
2015
134
147
0.32
0.33
8.7
14.5
31.1
30.8
N/A
0.004
34.2
43.6
13.9
15.4
0.5
0.3
2014
139
147
0.33
0.37
10.1
15.9
32.4
30.7
0.004
0.006
39.3
34.1
16.4
16.5
0.5
0.3
2013
136
147
0.37
0.38
11.1
16.4
31.0
29.2
0.005
0.006
43.3
33.2
19.1
16.4
0.6
0.2
2012
140
148
0.36
0.35
9.7
16.4
31.9
30.2
0.004
0.007
36.1
32.3
14.2
16.0
0.6
0.3
2011
139
150
0.34
0.37
8.7
16.3
33.5
32.0
N/A
0.006
30.2
33.1
21.1
15.2
0.8
0.3
2010
121
144
0.27
0.42
6.9
17.8
31.1
30.9
N/A
0.008
N/A
31.9
N/A
15.5
0.7
1.3
2009
107
151
0.31
0.37
7.3
20.0
29.6
29.0
N/A
0.009
N/A
38.0
N/A
19.6
1.6
1.5
2008
130
157
0.33
0.41
9.3
20.5
31.1
30.0
N/A
0.010
N/A
43.6
22.2
16.3
1.0
0.9
2007
146
135
0.34
0.65
10.0
20.8
28.4
28.3
N/A
0.011
N/A
N/A
26.0
N/A
0.7
1.6
2006
104
129
0.36
0.58
11.3
21.0
29.7
28.0
0.006
0.005
N/A
N/A
N/A
N/A
N/A
1.4
2005
101
134
0.33
0.53
10.7
22.8
28.1
27.3
N/A
0.012
N/A
N/A
N/A
N/A
N/A
3.3
2004
103
142
0.34
0.72
11.5
18.5
30.8
29.5
N/A
0.013
N/A
N/A
N/A
N/A
N/A
3.1
2003
115
144
0.44
0.75
15.0
22.7
31.2
28.5
N/A
0.013
N/A
N/A
N/A
N/A
1.2
2.0
2002
139
142
0.43
0.82
15.2
24.9
44.8
28.5
N/A
0.015
N/A
N/A
N/A
N/A
N/A
0.2
2001
143
145
0.42
0.79
15.1
25.7
47.3
26.1
N/A
0.025
N/A
N/A
N/A
N/A
N/A
0.9
2000
136
157
0.51
0.82
15.4
24.2
41.0
25.0
N/A
0.031
N/A
N/A
N/A
N/A
N/A
1.2
Natural disasters
Type
Fresno
Riverside
Tornado activity compared to U.S. average
9.9%
17.4%
Earthquake activity compared to U.S. average
8,613%
7,322.6%
Natural disasters compared to U.S. average
12%
46%
Transportation
Both cities offer a mix of public and private transit options. Fresno has the Fresno Area Express (FAX) serving the city while Riverside is served by the Riverside Transit Agency (RTA). Both services provide comprehensive bus services throughout their respective cities. However, commuters in both cities primarily rely on their cars for transportation.
Transport
Type
Fresno
Riverside
Amtrak stations
1
1
Amtrak stations nearby
2
3
FAA registered aircraft
408
307
FAA registered aircraft manufacturers and dealers
36
15
Means of transportation to work
Type
Fresno
Riverside
Bicycle
0.8%
0.5%
Bus
1.3%
0.9%
Carpooled
10.7%
9%
Car alone
84.4%
85.7%
Motorcycle
0.2%
0.3%
Railroad
0%
0.4%
Walked
1.4%
2.3%
Average travel time to work
Type
Fresno
Riverside
Average
23.7 min
31.3 min
Other means
21.5 min
28.7 min
Public transportation
45.3 min
45.3 min
Private vehicle occupancy
Type
Fresno
Riverside
Average
1.2
1.1
Drove alone
88.3%
89.1%
In 2 person carpool
8.5%
8.4%
In 3 person carpool
1.8%
2%
In 4 person carpool
0.8%
0.2%
In 5-6 person carpool
0.5%
0.2%
In 7+ person carpool
0.1%
0.1%
How many people usually rode to work in the car, truck or van.
Real Estate
The median home value in Fresno is lower compared to Riverside, making Fresno's real-estate market more affordable. However, both cities have seen steady growth in real estate values over the past few years, signifying a healthy real estate market.
Neighborhoods
Both Fresno and Riverside offer a mix of urban and suburban neighborhoods that cater to various lifestyles. In Fresno, neighborhoods like Hoover are popular for their suburban yet vibrant atmosphere. Riverside, known for its historic and picturesque neighborhoods like Victoria and Mission Grove, offers a charming residential atmosphere.
Houses and residents
Type
Fresno
Riverside
Houses
188,756
94,246
Average household size (people)
3.1
3.2
Median year apartment built
1977
1982
Median year house/condo built
1983
1974
Length of stay in the house since moving in
12.6 years
14.2 years
Houses occupied
181,841 (96.3%)
91,110 (96.7%)
Houses occupied by owners
91,233 (50.2%)
51,211 (56.2%)
Houses occupied by renters
90,608 (49.8%)
39,899 (43.8%)
Median rent asked for vacant for-rent units
$958.34
$1,277
Median monthly housing costs
$1,209
$1,680
Median price asked for vacant for-sale houses and condos
$285,919
$414,585
Estimated median house or condo value
$321,300
$483,300
Median numbers of rooms
5
5.2
Median number of rooms in apartments
4
3.9
Median number of rooms in houses and condos
5.9
6.1
Median house price - detached houses
$375,492
$548,362
Median house price - in 2-unit structures
$184,112
$525,372
Median house price - in 3-to-4-unit structures
$196,355
$450,463
Median house price - in 5 or more unit structures
$287,684
$408,213
Median house price - mobile homes
$100,122
$81,780
Median house price - Townhouses or other attached units
$260,277
$442,670
Median house price - All housing units
$358,028
$529,360
Median house age
42
44
Renting percentage
50.9%
44.3%
Housing density (houses/condos per square mile)
1,808.6
1,206.8
House value disparities
29.4%
21%
Household income disparities
46.4%
40.5%
Median household income for houses/condes with a mortgage
$97,354
$104,161
Median household income for apartments without a mortgage
$73,445
$71,925
Housing units without a mortgage
1,037 (1.7%)
393 (1%)
Housing units with both a second mortgage and home equity loan
2,880 (4.8%)
1,312 (3.3%)
Housing units with a mortgage
59,354 (98.3%)
39,744 (99%)
Housing units with a home equity loan
68 (0.1%)
123 (0.3%)
Housing units with a second mortgage
4,120 (6.8%)
2,112 (5.3%)
House/condo owner moved in on average (years ago)
10
13
House/condo renter moved in on average (years ago)
3
3
Housing units lacking complete kitchen facilities
1.5%
2.5%
Housing units lacking complete plumbing facilities
0.4%
0.4%
Housing units in structures
Housing units in structures
Fresno
Riverside
One, detached
59.0%
63.1%
One, attached
3.2%
5.6%
Two
3.0%
1.1%
3 or 4
7.8%
3.7%
5 to 9
9.6%
6.8%
10 to 19
3.6%
7.0%
20 to 49
3.4%
4.6%
50 or more
7.5%
6.4%
Mobile homes
2.6%
1.8%
Boats, RVs, vans, etc.
0.1%
0.0%
Median real estate property taxes paid for housing units
Self-employed workers in own not incorporated business
14,428
8,164
State government workers
9,836
8,293
Unpaid family workers
890
199
Industries and Occupations
In Fresno, agriculture dominates the economy, with various occupations related to farming. Additionally, the education, healthcare, and public administration sectors also provide many jobs. In contrast, Riverside's economy leans more into education, with the University of California, Riverside being one of the largest employers. The city also houses manufacturing, retail, and healthcare sectors.
Both Fresno and Riverside have a strong healthcare sector, driven by a number of hospitals and clinics. Community Medical Centers in Fresno and Riverside Community Hospital in Riverside form part of the larger network of healthcare providers in the cities.
The two cities boast reputable infrastructures. Fresno is home to the Fresno Yosemite International Airport, while Riverside houses the Riverside Municipal Airport. Both cities have well-constructed freeways for easy commuting and also cities' amenities such as parks, libraries, and hospitals are comparable.
Infrastructure
Type
Fresno
Riverside
Hospitals
32
20
TV stations
4
5
Bank branches located here
98
61
Bank institutions located here
25
18
Main business address for public companies
1
2
Drinking water stations with no reported violations in the past
5
2
Drinking water stations with reported violations in the past
HMDA - Conventional home purchase loans - Applications denied
Year
Fresno
Riverside
1999
717
794
2000
484
375
2001
462
310
2002
569
405
2003
1,510
1,399
2004
2,462
1,892
2005
3,394
2,728
2006
3,441
3,235
2007
2,138
1,568
2008
760
544
2009
354
285
Culture and Food
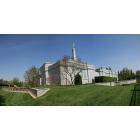
Fresno's culture is steeped in its agricultural roots, with popular farmer's markets and festivals like the Fresno County Blossom Trail featuring local produce. Downtown Fresno offers an evolving food scene with an array of restaurants and eateries suited for varied tastes. Riverside is known for its historic Mission Inn, a cultural and architectural landmark. The city promises a vibrant food scene, appreciated for its eclectic mix of cuisines from around the world.
Sports Teams
While neither city has a major league sports team, both cities support minor league teams. Fresno Grizzlies (MiLB) and Fresno F.C. (soccer team), call Fresno their home, while Riverside has become a popular destination for collegiate sports thanks to the presence of the University of California, Riverside.


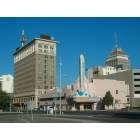
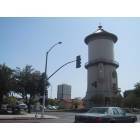

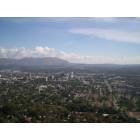
 Fresno, CA
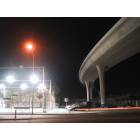
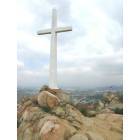
 Riverside, CA