Both Fresno and the South Coast of California present unique living experiences with respective advantages and challenges. Fresno, located in the agricultural heartland of Central California, boasts a lower cost of living, but struggles with higher crime rates and education challenges. The South Coast is renowned for its beautiful beaches, influential industries, and higher education opportunities, yet struggles with a high cost of living and wavering employment rates in certain sectors. Whether you're considering relocation or just visiting, these factors will inevitably affect your experience.
Fresno has a higher crime rate than the national average, affecting both residents and tourists. The city has been implementing safety measures to counteract this, but it remains an issue. On the other hand, the South Coast of California tends to have lower crime rates overall, with certain low-crime suburban areas standing out, like Laguna Niguel and Newport Beach.
Cost of Living
Fresno offers a lower cost of living compared to the state average, making it an attractive option for those looking to relocate to a more budget-friendly Californian city. Conversely, the South Coast is known for its higher cost of living, predominantly due to housing prices. Both cities face considerable costs in health care and groceries.
Income Tax
California has a progressive income tax system with rates that range from 1% to 13.3%. Both Fresno and South Coast residents are subject to the same state income tax rates.
Property Tax
California's average property tax rate is 0.73% which is lower than the national average, and applies to both Fresno and South Coast residents.
Sales Tax
Both Fresno and the South Coast have higher than average sales tax rates, with Fresno's sales tax being 7.975%, while many South Coast cities exceed 9%.
Income
Type
Fresno
South Coast
Estimated median household income
$61,250
$112,870
Estimated per capita income
$28,499
$68,453
Cost of living index (U.S. average is 100)
96.3
96.8
If you make $50,000 in Fresno, you will have to make $50,260 in South Coast to maintain the same standard of living.
Geographical Conditions
Fresno is situated in the San Joaquin Valley, surrounded by farmland and mountains. The South Coast is defined by its beautiful beaches, picture-perfect coastline, and close proximity to national parks and wilderness.
Geographical information
Type
Fresno
South Coast
Land area
104.4 sq. miles
101 sq. miles
Population density
5,217.4 people per sq. mile
2,953.2 people per sq. mile
Relative area comparison
Fresno, CA South Coast, CA
Education
Fresno’s higher education institutions include Fresno State and Fresno Pacific University, among others. However, the city struggles with poor secondary school performance. The South Coast has an array of esteemed universities such as UC Santa Barbara, Pepperdine, and several community colleges. The primary and secondary schools in the region generally rank higher than those in Fresno.
Fresno's local economy is heavily dependent on agriculture and health care services. The South Coast's economy is more diverse, encompassing tourism, education, technology, and entertainment industries. However, Fresno has a higher unemployment rate compared to the South Coast.
Biggest Employers
Fresno's biggest employers are largely in the health care, education, and retail sectors. The South Coast's major employers range from technology giants like Google to higher education institutions such as UC Santa Barbara, and the entertainment industry, including major film studios.
In Fresno (Fresno County), 49.8% voted for Democrats and 48.0% for Republicans in 2012 Presidential Election. In South Coast (Orange County), 45.8% voted for Democrats and 52.0% for Republicans.
Elections
Type
Democrats
Republicans
Other
Year
Fresno
South Coast
Fresno
South Coast
Fresno
South Coast
2020
53.0%
53.6%
45.2%
44.6%
1.8%
1.8%
2016
49.2%
50.9%
43.2%
42.4%
7.5%
6.7%
2012
49.8%
45.8%
48.0%
52.0%
2.2%
2.3%
2008
50.2%
47.8%
48.1%
50.3%
1.8%
1.9%
2004
42.0%
39.3%
57.8%
60.2%
0.3%
0.5%
2000
43.2%
40.4%
53.3%
55.9%
3.5%
3.7%
1996
45.3%
37.9%
47.4%
51.7%
7.3%
10.5%
Breakdown of population affiliated with a religious congregation
Type
Adherents
Congregations
Religion
Fresno
South Coast
Fresno
South Coast
CATHOLIC CHURCH
31.0%
26.5%
6.1%
4.4%
SOUTHERN BAPTIST CONVENTION
1.6%
2.3%
8.1%
8.8%
SEVENTH DAY ADVENTIST CHURCH
0.7%
0.4%
2.6%
1.3%
AMERICAN BAPTIST CHURCHES IN THE USA
0.6%
0.2%
2.4%
1.7%
EVANGELICAL LUTHERAN CHURCH IN AMERICA
0.5%
0.4%
2.0%
2.3%
MUSLIM ESTIMATE
0.3%
0.8%
0.6%
1.3%
LUTHERAN CHURCH
0.1%
0.6%
0.7%
2.0%
EPISCOPAL CHURCH
0.0%
0.4%
0.1%
1.4%
REFORMED CHURCH IN AMERICA
0.0%
0.3%
0.1%
0.2%
Weather
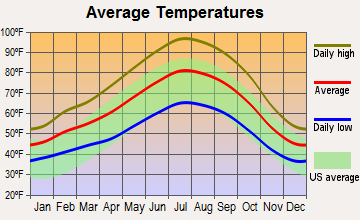
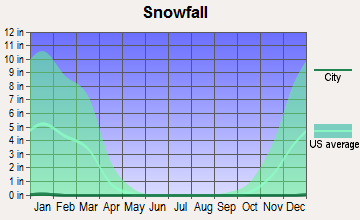
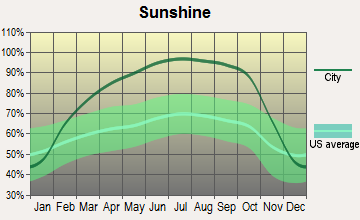
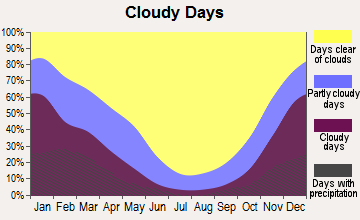
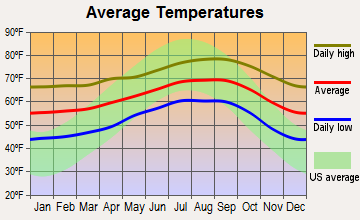
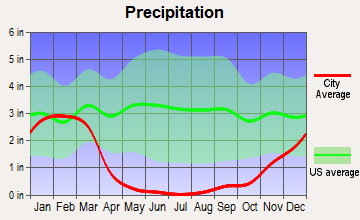
Fresno experiences a semi-arid climate, with very hot, dry summers and mild, wet winters. Its inland location and surrounding high mountains keep it hotter in the summer compared to coastal regions. The South Coast enjoys a Mediterranean climate with warm, dry summers and mild, wet winters, providing picturesque beach-going weather year-round.
Weather and climate
Type
Fresno
South Coast
Temperature - Average
63°F
62.1°F
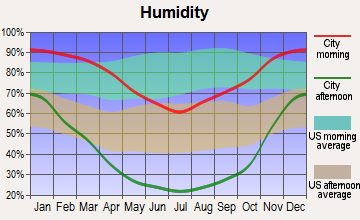
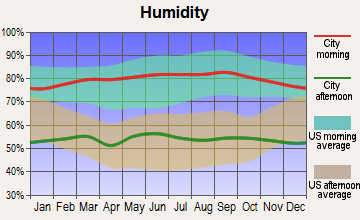
Humidity - Average morning or afternoon humidity
60.9%
69.1%
Humidity - Differences between morning and afternoon humidity
67%
24.6%
Humidity - Maximum monthly morning or afternoon humidity
88%
77%
Humidity - Minimum monthly morning or afternoon humidity
21%
52.4%
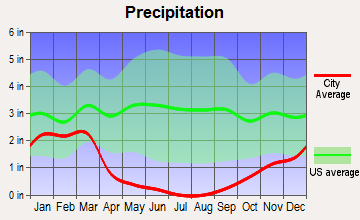
Precipitation - Yearly average
11.6 in
13.4 in
Snowfall - Yearly average
0 in
0 in
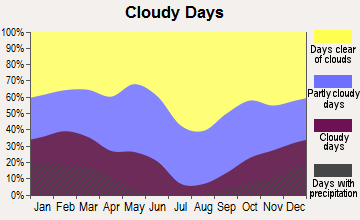
Clouds - Number of days clear of clouds
32.4%
26.7%
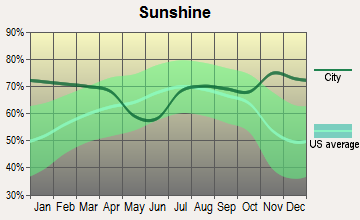
Sunshine amount - Average
82.8%
77.6%
Sunshine amount - Differences during a year
52%
20.5%
Sunshine amount - Maximum monthly
96%
81.9%
Sunshine amount - Minimum monthly
44%
61.4%
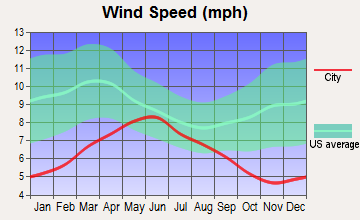
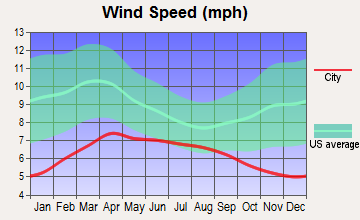
Wind speed - Average
6.5 mph
5.5 mph
Average climate in Fresno, California
Average climate in South Coast, California
Air pollution
Type
AQI
CO
NO2
OZONE
PB
PM10
PM25
SO2
Year
Fresno
South Coast
Fresno
South Coast
Fresno
South Coast
Fresno
South Coast
Fresno
Fresno
South Coast
Fresno
South Coast
Fresno
South Coast
2018
128
105
0.35
0.18
9.7
8.6
31.7
34.0
N/A
N/A
39.7
22.7
14.8
7.0
0.6
N/A
2017
132
111
0.35
0.21
9.2
8.4
33.2
34.7
N/A
N/A
38.3
23.0
14.3
11.3
0.6
N/A
2016
128
105
0.35
0.14
8.4
9.6
31.4
33.8
N/A
N/A
34.7
21.9
13.5
9.8
0.5
0.1
2015
134
111
0.32
0.10
8.7
10.5
31.1
32.9
N/A
N/A
34.2
19.4
13.9
10.5
0.5
0.1
2014
139
100
0.33
0.11
10.1
9.8
32.4
31.3
0.004
N/A
39.3
25.4
16.4
11.8
0.5
0.3
2013
136
97
0.37
0.17
11.1
10.6
31.0
30.0
0.005
N/A
43.3
24.5
19.1
10.3
0.6
0.2
2012
140
101
0.36
0.26
9.7
10.1
31.9
29.9
0.004
N/A
36.1
21.5
14.2
10.5
0.6
0.1
2011
139
113
0.34
0.15
8.7
10.2
33.5
30.3
N/A
N/A
30.2
24.0
21.1
10.9
0.8
0.3
2010
121
101
0.27
0.21
6.9
10.9
31.1
30.6
N/A
N/A
N/A
23.3
N/A
11.4
0.7
0.6
2009
107
120
0.31
0.15
7.3
13.0
29.6
31.5
N/A
N/A
N/A
27.3
N/A
12.4
1.6
1.1
2008
130
131
0.33
0.26
9.3
13.2
31.1
32.0
N/A
N/A
N/A
38.8
22.2
9.4
1.0
1.1
2007
146
110
0.34
0.24
10.0
13.7
28.4
30.6
N/A
N/A
N/A
N/A
26.0
N/A
0.7
0.8
2006
104
112
0.36
0.30
11.3
14.8
29.7
30.6
0.006
N/A
N/A
N/A
N/A
N/A
N/A
1.3
2005
101
109
0.33
0.28
10.7
13.7
28.1
29.9
N/A
N/A
N/A
N/A
N/A
N/A
N/A
1.3
2004
103
130
0.34
0.29
11.5
15.5
30.8
32.5
N/A
N/A
N/A
N/A
N/A
N/A
N/A
1.6
2003
115
132
0.44
0.38
15.0
18.2
31.2
31.3
N/A
N/A
N/A
N/A
N/A
N/A
1.2
1.1
2002
139
129
0.43
0.40
15.2
17.7
44.8
28.4
N/A
N/A
N/A
N/A
N/A
N/A
N/A
1.6
2001
143
137
0.42
0.52
15.1
18.5
47.3
27.8
N/A
N/A
N/A
N/A
N/A
N/A
N/A
1.4
2000
136
140
0.51
0.52
15.4
21.2
41.0
24.5
N/A
N/A
N/A
N/A
N/A
N/A
N/A
1.9
Natural disasters
Type
Fresno
South Coast
Tornado activity compared to U.S. average
9.9%
17.1%
Earthquake activity compared to U.S. average
8,613%
6,728.5%
Natural disasters compared to U.S. average
12%
32%
Transportation
In Fresno, commuting is generally by car, with limited public transit options as the city is spread out. The South Coast offers more public transportation options, but traffic and long commute times can be an issue, particularly in areas like Los Angeles.
Transport
Type
Fresno
South Coast
Amtrak stations
1
0
Amtrak stations nearby
2
3
FAA registered aircraft
408
0
FAA registered aircraft manufacturers and dealers
36
0
Means of transportation to work
Type
Fresno
South Coast
Bicycle
0.8%
0.3%
Bus
1.3%
1%
Carpooled
10.7%
10.5%
Car alone
84.4%
79.2%
Motorcycle
0.2%
0.2%
Railroad
0%
0.4%
Walked
1.4%
1.7%
Average travel time to work
Type
Fresno
South Coast
Average
23.7 min
27.9 min
Real Estate
Real estate in Fresno offers affordability over the California average. However, appreciation rates are higher in the South Coast, which hosts some of the most expensive real estate markets in California, like Malibu and Santa Barbara.
Neighborhoods
Fresno offers a mix of rural and suburban neighborhoods, with many retirees being drawn to Fresno's slower-paced neighborhoods. The South Coast features diverse and upscale neighborhoods, popular among young professionals and celebrities, such as Santa Monica and Santa Barbara.
Houses and residents
Type
Fresno
South Coast
Houses
188,756
124,031
Average household size (people)
3.1
2.5
Houses occupied
181,841 (96.3%)
117,093 (94.4%)
Houses occupied by owners
91,233 (50.2%)
81,601 (69.7%)
Houses occupied by renters
90,608 (49.8%)
35,492 (30.3%)
Median rent asked for vacant for-rent units
$958.34
$2,718
Median price asked for vacant for-sale houses and condos
$285,919
$1,099,558
Estimated median house or condo value
$321,300
Over $1,000,000
Median number of rooms in apartments
4
3.9
Median number of rooms in houses and condos
5.9
5.1
Renting percentage
50.9%
33.8%
Housing density (houses/condos per square mile)
1,808.6
1,227.5
Household income disparities
46.4%
38.1%
Housing units without a mortgage
1,037 (1.7%)
10,715 (16.4%)
Housing units with both a second mortgage and home equity loan
2,880 (4.8%)
248 (0.4%)
Housing units with a mortgage
59,354 (98.3%)
54,674 (83.6%)
Housing units with a home equity loan
68 (0.1%)
5,859 (9%)
Housing units with a second mortgage
4,120 (6.8%)
7,560 (11.6%)
Housing units lacking complete kitchen facilities
1.5%
0.8%
Housing units lacking complete plumbing facilities
Self-employed workers in own not incorporated business
14,428
17,244
State government workers
9,836
4,403
Unpaid family workers
890
640
Industries and Occupations
In Fresno, the major industries include agriculture, food processing, and health care. The South Coast hosts diversified sectors, including technology, tourism, education, and the entertainment industry. Both regions offer job opportunities but vary in occupational focus.
Both regions offer quality healthcare, but Fresno lacks enough medical professionals relative to its population. The South Coast has renowned medical facilities, including top-ranked hospitals like UCLA Medical Center and Cedars-Sinai.
Fresno is well-connected by highways, rail service, and has an airport. However, its infrastructure is aging. Meanwhile, the South Coast has extensive infrastructure, benefitting from major highways, numerous airports, and multiple ports. But, it has a higher population pressure leading to traffic and congestion issues.
Infrastructure
Type
Fresno
South Coast
TV stations
4
1
Nuclear power plants nearby
0
2
Culture and Food
Fresno is known for its cultural celebrations, including the Fresno County Blossom Trail and the Big Fresno Fair. The city's food showcases authentic Mexican and farm-to-table cuisines. The South Coast offers an abundance of seafood, wine, and local produce paired with a robust arts and entertainment scene.
Sports Teams
While Fresno doesn’t host any major league sports teams, it's home to minor league teams like the Fresno Grizzlies (baseball) and Fresno FC (soccer). South Coast cities host a number of professional sports teams, such as the Los Angeles Lakers (NBA), Los Angeles Rams (NFL), and Los Angeles Kings (NHL).
 Fresno, CA
 South Coast, CA