Honolulu, as a city, and Urban Honolulu, as its metropolitan area, constitute the same region but offer slightly different experiences. The comparisons can confuse some since they are interconnected, but distinguishing between them is necessary to fully understand what living or visiting in each entails. This comparison will assess them in terms of crime/safety, weather, cost of living, education, work and economy, infrastructure, industries and occupations, biggest employers, real-estate, neighborhoods, transportation/public transit/commuting, city/state sales tax, city/state income tax, city/state property tax, culture/food, sports teams, geographical conditions, and health care.
Crime in Honolulu city and Urban Honolulu are relatively similar, as they are part of the same geographic region. As a whole, the crime rate is slightly above the national average but varies by neighborhood. Though authorities are active in maintaining safety, it's prudent for residents and tourists to take standard precautions especially at night and in less travelled areas. Services such as neighborhood watch and community policing are prevalent across the city.
Cost of Living
The cost of living in both Honolulu and Urban Honolulu is high compared to the US average. This cost is primarily driven by housing, followed by groceries and transportation. Though urban areas have slightly higher living costs due to demand and proximity to services, the cost difference with Honolulu city is not substantial.
Income Tax
Hawaii's state income tax applies to residents in both Honolulu and Urban Honolulu, ranging from 1.4% to 11% based on income level.
Property Tax
Property tax rates in Honolulu County (which encompasses both regions) are relatively low at $3.50 per $1,000 of assessed value, providing some relief from the high cost of housing.
Sales Tax
Hawaii's General Excise Tax (GET) which applies to both areas, is 4.5% in Honolulu County. It is different from a sales tax, as it applies to all business activities, including goods and services, whereas a sales tax typically only applies to goods.
Income
Type
Honolulu
Urban Honolulu
Estimated median household income
$78,820
$90,704
Estimated per capita income
$43,518
$39,573
Cost of living index (U.S. average is 100)
158.6
128.3
If you make $50,000 in Urban Honolulu, you will have to make $61,808 in Honolulu to maintain the same standard of living.
Geographical Conditions
Both regions enjoy beautiful shores, lush mountains, and tropical greenery. However, as beach locations, they're at risk for tsunamis and hurricanes. Strategic planning and building codes are in place to minimize potential damages.
Honolulu, including its urban region, has strong education systems. Public and private schools, as well as universities like the University of Hawaii at Manoa, offer quality education at all levels. There are also community colleges and vocational schools to cater to diverse educational needs.
Tourism governs the economy in Honolulu and its metropolitan area. Other significant contributors are military defense, research and development, and manufacturing. Job opportunities are available mainly in tourism-related businesses, as well as in educational institutions, hospitals, and state administration. The unemployment rate is generally lower than the national average, but wages can be on the lower side due to the high cost of living.
Biggest Employers
In both areas, the City and County of Honolulu, State of Hawaii, federal government, Hawaiian Airlines, HECO, and the University of Hawaii system are among the largest employers. Also significant are sectors like hospitality and healthcare, with employers like Hilton Hawaiian Village and Queen's Health Systems.
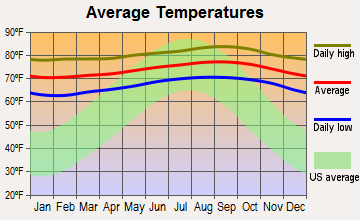
Weather
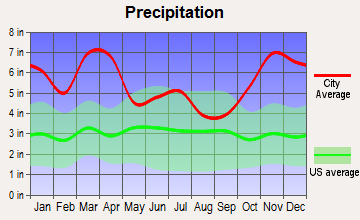
The weather in both regions is the same, characterized by a tropical climate with a warm, sunny, and humid atmosphere year-round. Rainfalls are frequent, but temperatures usually range from 60 to 90 degrees Fahrenheit, making it a paradise for beachgoers and nature lovers. Winter months are a bit cooler, but snow is unheard of in these parts.
Weather and climate
Type
Honolulu
Urban Honolulu
Temperature - Average
73.9°F
74.7°F
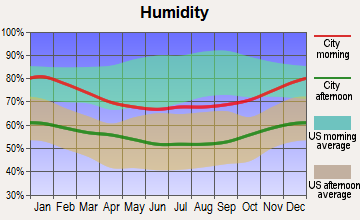
Humidity - Average morning or afternoon humidity
70.5%
70.5%
Humidity - Differences between morning and afternoon humidity
27%
27%
Humidity - Maximum monthly morning or afternoon humidity
79%
79%
Humidity - Minimum monthly morning or afternoon humidity
52%
52%
Precipitation - Yearly average
66.2 in
58.7 in
Snowfall - Yearly average
0 in
0 in
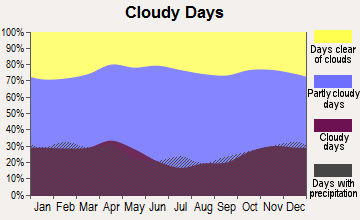
Clouds - Number of days clear of clouds
14.9%
14.9%
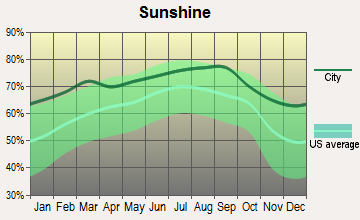
Sunshine amount - Average
71%
71%
Sunshine amount - Differences during a year
19%
19%
Sunshine amount - Maximum monthly
75%
75%
Sunshine amount - Minimum monthly
56%
56%
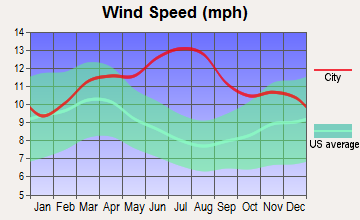
Wind speed - Average
11.1 mph
11.1 mph
Average climate in Honolulu, Hawaii
Air pollution
Type
AQI
CO
NO2
OZONE
PB
PM10
PM25
SO2
Year
Honolulu
Urban Honolulu
Honolulu
Urban Honolulu
Honolulu
Urban Honolulu
Honolulu
Urban Honolulu
Honolulu
Urban Honolulu
Honolulu
Urban Honolulu
Honolulu
Urban Honolulu
Honolulu
Urban Honolulu
2018
43
43
0.45
0.44
3.9
3.9
25.8
25.8
N/A
N/A
12.7
12.8
3.8
3.8
0.1
0.1
2017
46
46
0.50
0.49
4.4
4.4
24.8
24.8
N/A
N/A
11.7
11.9
3.4
3.5
0.4
0.4
2016
46
46
0.59
0.59
3.9
3.9
24.8
24.8
N/A
N/A
13.5
13.7
3.5
3.2
0.3
0.3
2015
53
53
0.54
0.53
3.5
3.5
24.0
24.0
N/A
N/A
11.4
11.7
4.8
4.5
0.4
0.4
2014
45
45
0.41
0.41
3.4
3.4
21.6
21.6
N/A
N/A
13.1
13.3
4.6
4.6
1.2
1.2
2013
53
53
0.41
0.41
3.0
3.0
26.4
26.4
N/A
N/A
11.8
12.0
5.8
5.6
1.1
1.1
2012
58
58
0.31
0.32
2.9
2.9
24.7
24.7
N/A
N/A
12.2
12.4
5.7
5.6
0.6
0.6
2011
57
57
0.39
0.38
2.9
2.9
28.4
28.4
N/A
N/A
12.7
12.8
7.0
6.1
0.6
0.6
2010
68
68
0.38
0.38
3.4
3.4
N/A
N/A
0.002
0.002
N/A
N/A
7.0
5.9
1.1
1.1
2009
58
58
0.42
0.42
4.3
4.3
N/A
N/A
0.003
0.003
N/A
N/A
6.2
5.8
0.7
0.7
2008
19
19
0.45
0.45
4.2
4.2
N/A
N/A
0.002
0.002
N/A
N/A
N/A
N/A
0.6
0.6
2007
23
23
0.52
0.52
4.7
4.7
N/A
N/A
0.001
0.001
N/A
N/A
N/A
N/A
0.5
0.5
2006
21
21
0.24
0.24
4.9
4.9
N/A
N/A
0.003
0.003
N/A
N/A
N/A
N/A
1.0
1.1
2005
19
19
0.42
0.42
5.0
5.0
N/A
N/A
0.001
0.001
N/A
N/A
N/A
N/A
0.7
0.7
2004
18
18
0.60
0.60
4.8
4.8
N/A
N/A
0.001
0.001
N/A
N/A
N/A
N/A
0.5
0.5
2003
21
21
0.62
0.62
4.7
4.7
N/A
N/A
0.002
0.002
N/A
N/A
N/A
N/A
0.5
0.5
2002
19
19
0.64
0.64
4.9
4.9
N/A
N/A
N/A
N/A
N/A
N/A
N/A
N/A
0.9
0.9
2001
21
21
0.62
0.62
4.5
4.5
N/A
N/A
N/A
N/A
N/A
N/A
N/A
N/A
0.6
0.7
2000
21
21
0.68
0.68
4.9
4.9
N/A
N/A
N/A
N/A
N/A
N/A
N/A
N/A
0.4
0.4
Natural disasters
Type
Honolulu
Urban Honolulu
Tornado activity compared to U.S. average
3.7%
3.7%
Earthquake activity compared to U.S. average
1,260.2%
1,250.1%
Natural disasters compared to U.S. average
16%
16%
Transportation
Public transportation in both areas is mainly provided by TheBus, which operates throughout the island of Oahu. Though car ownership is prevalent, alternatives like biking, walking, and ride-sharing are common. The city of Honolulu has started the Honolulu Rail Transit Project, which is a 20-mile elevated rail line expected to ease commuting when finished.
Transport
Type
Honolulu
Urban Honolulu
FAA registered aircraft
343
0
FAA registered aircraft manufacturers and dealers
7
0
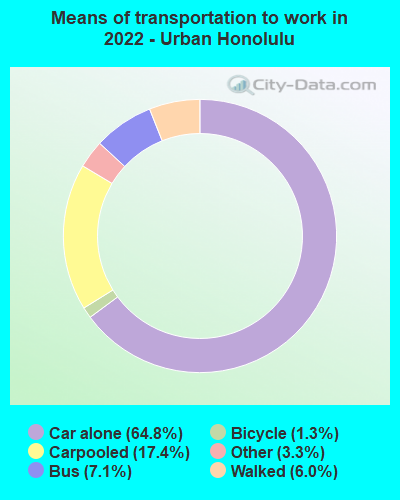
Means of transportation to work
Type
Honolulu
Urban Honolulu
Bicycle
1.2%
0.9%
Bus
11.3%
6.3%
Carpooled
18.1%
15.5%
Car alone
57.7%
69.3%
Motorcycle
0.9%
0%
Taxicab
0.3%
0%
Walked
6.6%
5.4%
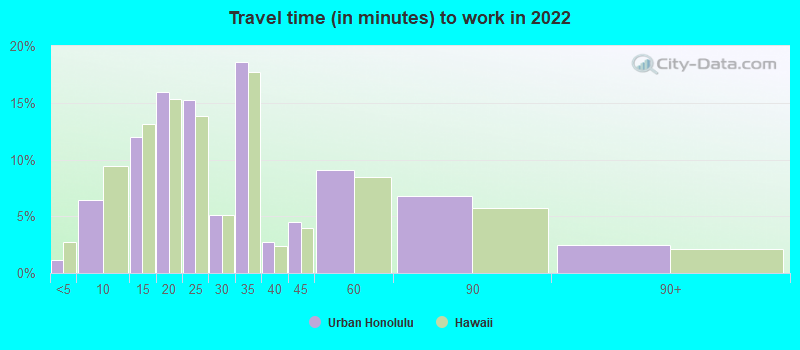
Average travel time to work
Type
Honolulu
Urban Honolulu
Average
24 min
29.3 min
Real Estate
Real estate in both regions is expensive. Urban Honolulu offers a mix of condos, townhouses, and single-family homes, while Honolulu city boasts single-family homes, low-rise apartments, and multi-unit residential complexes. Demand is usually high due to its desirable location and lifestyle, leading to a competitive market.
Neighborhoods
The neighborhoods in both areas are diverse, with some being extremely walkable and others more dependent on vehicles. The city has a mix of high-end neighborhoods like Diamond Head and Kahala, as well as more affordable areas like Kaimuki and Manoa. Urban Honolulu offers a more vibrant mixture of residential and commercial aspects.
Houses and residents
Type
Honolulu
Urban Honolulu
Houses
158,659
157,427
Average household size (people)
2.6
2.5
Houses occupied
140,328 (88.4%)
138,398 (87.9%)
Houses occupied by owners
65,860 (46.9%)
68,458 (49.5%)
Houses occupied by renters
74,468 (53.1%)
69,940 (50.5%)
Median rent asked for vacant for-rent units
$1,820
$1,712
Median price asked for vacant for-sale houses and condos
$674,769
$238,020
Estimated median house or condo value
$903,138
$781,600
Household income disparities
44.4%
45%
Housing units without a mortgage
16,363 (40.7%)
1,696 (4.1%)
Housing units with both a second mortgage and home equity loan
182 (0.5%)
6,219 (15.1%)
Housing units with a mortgage
23,799 (59.3%)
39,383 (95.9%)
Housing units with a home equity loan
4,350 (10.8%)
319 (0.8%)
Housing units with a second mortgage
2,936 (7.3%)
7,901 (19.2%)
Housing units lacking complete kitchen facilities
1.9%
2.6%
Housing units lacking complete plumbing facilities
Self-employed workers in own not incorporated business
12,632
10,949
State government workers
19,181
19,544
Unpaid family workers
657
446
Industries and Occupations
Both regions rely heavily on the tourism and hospitality industry. Other big sectors include healthcare, education, and state administration. Occupations in these industries are readily available, though the competition can be high due to their attractive nature.
Health Care
Healthcare services in both regions are robust, with facilities like The Queen's Medical Center and Kaiser Permanente Moanalua Medical Center providing quality care. The state's significant investments in health care have led to it consistently ranking high in national health statistics.
Infrastructure
Both areas have robust infrastructure with well-maintained roads, airports, ports, and public services. Honolulu International Airport serves as the main hub for commercial aviation. The city is home to several hospitals, educational institutions, shopping centers, and parks. Urban Honolulu has an edge in terms of more commercial buildings, high-rises, and condominiums.
Infrastructure
Type
Honolulu
Urban Honolulu
TV stations
13
15
Culture and Food
Hawaiian culture is vibrant in both areas, combining traditions of Native Hawaiian, Asian, and Western cultures. Food offers a smorgasbord of flavors, with dishes like poke, loco moco, and malasada delighting locals and tourists alike. Cultural events and festivals such as the Aloha Festivals and the Honolulu Festival are annual highlights.
Sports Teams
Though Honolulu does not have any major professional sports teams, it does host sporting events like the Honolulu Marathon and NFL's Pro Bowl games. High school and college sports are also popular, with teams from the University of Hawaii competing in the NCAA Division I.


 Honolulu, HI and
  Urban Honolulu, HI : 1.7 miles
 Honolulu, HI and
  Urban Honolulu, HI : 1.7 miles