Houston, Texas, and Oklahoma City, Oklahoma have distinct characteristics, each appealing to different lifestyles and preferences. The two cities offer dissimilar experiences in terms of safety, weather, living costs, education, job opportunities, city infrastructure, industries, real estate, neighborhoods, transportation systems, taxation, cultural and gastronomical experiences, sports, geological attributes, and health care systems. Our analysis dives into these factors, providing valuable information to potential residents and tourists.
Distance between
Houston, TX and
Oklahoma City, OK : 414.5 miles
Houston's population is larger by 233%. Its population has grown by 334,619 people (17.1%) since 2000. The population of Oklahoma City has grown by 181,593 people (35.9%) during that time.
Both Houston and Oklahoma City have crime rates higher than the national average. However, Houston's crime rate is significantly higher than Oklahoma City's, particularly for property crimes. In Houston, neighborhood crime-rates can vary greatly, so it is crucial for potential residents to research their preferred areas. Oklahoma City, while safer statistically, still has areas where crime is more prevalent.
City-data.com crime index counts serious crimes and violent crime more heavily. It adjusts for the number of visitors and daily workers commuting into cities. (higher means more crime, U.S. average = 301.1)
City-data.com crime index counts serious crimes and violent crime more heavily. It adjusts for the number of visitors and daily workers commuting into cities. (higher means more crime, U.S. average = 301.1)
Sex Offenders
According to our data, there are 7,873 registered sex offenders living in Houston and 1,386 registered sex offenders living in . The ratio of residents to sex offenders in Houston is 293 to 1; the ratio in Oklahoma City is 461 to 1. The number of registered sex offenders compared to the number of residents is larger in Houston than in Oklahoma City.
Cost of Living
Living in Oklahoma City is generally more affordable than in Houston. This is primarily due to a lower cost of housing in Oklahoma City. Other aspects like groceries, healthcare, and utilities are also cheaper in Oklahoma City than in Houston.
Income Tax
Both Texas (where Houston is located) and Oklahoma impose state income taxes. However, Texas does not have a state income tax, giving Houston an advantage for residents looking to save money on taxes.
Property Tax
Houston has a higher property tax rate compared to Oklahoma City. This is mainly due to higher property values in Houston.
Sales Tax
Houston carries a higher sales tax than Oklahoma City, with state and local combined at 8.25%. Oklahoma City has a lower combined sales tax rate of 8.13%.
Income
Type
Houston
Oklahoma City
Estimated median household income
$55,499
$59,214
Estimated per capita income
$36,265
$31,630
Cost of living index (U.S. average is 100)
97.2
85.4
If you make $50,000 in Oklahoma City, you will have to make $56,909 in Houston to maintain the same standard of living.
Geographical Conditions
Houston is located in southeastern Texas near the Gulf of Mexico, making it prone to hurricanes. Oklahoma City is in the Great Plains region and is part of Tornado Alley, making it subject to severe weather conditions, namely tornadoes.
Houston shines in terms of education, boasting higher-rated public schools and prestigious institutions like Rice University and the University of Houston. Oklahoma City's school system struggles by comparison but includes some well-regarded schools and higher education options, like the University of Oklahoma.
Houston has a diverse economy with a considerable impact from energy, aeronautics, and healthcare industries. Oklahoma City's economy is more reliant on natural gas, oil, and livestock. Both cities have seen recent growth, but Houston provides more job opportunities due to its larger economy.
Biggest Employers
Employers like Texas Medical Center, Houston Independent School District, and ExxonMobil dominate Houston. In contrast, Oklahoma City's top employers include the State of Oklahoma, Integris Health, and the Federal Aviation Administration.
There were 7,146 building permits issued in Houston in 2012 (4571 more than in 2011) compared to 4,127 building permits issued in Oklahoma City in 2012 (2834 more than in 2011).
In Houston (Harris County), 49.4% voted for Democrats and 49.3% for Republicans in 2012 Presidential Election. In Oklahoma City (Oklahoma County), 41.7% voted for Democrats and 58.3% for Republicans.
Elections
Type
Democrats
Republicans
Other
Year
Houston
Oklahoma City
Houston
Oklahoma City
Houston
Oklahoma City
2020
56.0%
48.1%
42.7%
49.2%
1.3%
2.7%
2016
54.0%
41.2%
41.6%
51.7%
4.4%
7.1%
2012
49.4%
41.7%
49.3%
58.3%
1.3%
0.0%
2008
50.5%
41.6%
48.9%
58.4%
0.6%
0.0%
2004
44.6%
35.8%
54.9%
64.2%
0.5%
0.0%
2000
43.0%
36.6%
54.4%
62.3%
2.6%
1.1%
1996
45.2%
36.5%
49.2%
54.7%
5.6%
8.8%
Breakdown of population affiliated with a religious congregation
Type
Adherents
Congregations
Religion
Houston
Oklahoma City
Houston
Oklahoma City
CATHOLIC CHURCH
18.1%
8.5%
3.6%
3.0%
SOUTHERN BAPTIST CONVENTION
14.2%
20.7%
26.8%
20.0%
MUSLIM ESTIMATE
2.9%
0.3%
1.6%
0.6%
EPISCOPAL CHURCH
1.0%
0.7%
1.4%
1.3%
LUTHERAN CHURCH
0.7%
0.5%
1.5%
1.0%
SEVENTH DAY ADVENTIST CHURCH
0.3%
0.4%
1.7%
1.5%
AMERICAN BAPTIST CHURCHES IN THE USA
0.0%
0.3%
0.1%
0.1%
INTERNA PENTECO HOLINESS CHURCH
0.0%
0.7%
0.3%
2.9%
Weather
Houston experiences hot, humid summers and mild winters due to its subtropical climate. Flooding and hurricanes are possible during the hurricane season. Oklahoma City has a humid subtropical climate with high temperature variability—hot summers and cold winters with occasional snowfall. Tornadoes are frequent in the spring and early fall.
Weather and climate
Type
Houston
Oklahoma City
Temperature - Average
69.7°F
60.1°F
Humidity - Average morning or afternoon humidity
80.3%
73.1%
Humidity - Differences between morning and afternoon humidity
36.7%
35%
Humidity - Maximum monthly morning or afternoon humidity
92.8%
85%
Humidity - Minimum monthly morning or afternoon humidity
56.1%
50%
Precipitation - Yearly average
52.9 in
35.7 in
Snowfall - Yearly average
0.6 in
17.2 in
Clouds - Number of days clear of clouds
15%
23.1%
Sunshine amount - Average
60.4%
72.1%
Sunshine amount - Differences during a year
24%
21%
Sunshine amount - Maximum monthly
67%
79%
Sunshine amount - Minimum monthly
43%
58%
Wind speed - Average
8.2 mph
12.3 mph
Average climate in Houston, Texas
Average climate in Oklahoma City, Oklahoma
Air pollution
Type
AQI
CO
NO2
OZONE
PB
PM10
PM25
SO2
Year
Houston
Oklahoma City
Houston
Oklahoma City
Houston
Oklahoma City
Houston
Oklahoma City
Houston
Oklahoma City
Oklahoma City
Houston
Oklahoma City
Houston
Oklahoma City
2018
102
85
0.19
0.29
9.2
6.6
21.5
31.9
N/A
0.002
21.3
N/A
10.0
9.6
0.3
0.0
2017
96
82
0.16
0.32
9.4
6.7
23.1
33.0
N/A
0.002
20.7
N/A
9.1
8.9
0.3
0.0
2016
91
72
0.16
0.29
10.4
6.6
22.7
31.9
N/A
0.002
19.4
N/A
8.6
8.5
0.2
0.2
2015
109
76
0.15
0.24
10.1
7.0
21.7
31.5
N/A
0.002
19.1
N/A
9.9
7.8
0.2
0.5
2014
98
84
0.24
0.15
10.4
7.1
21.8
32.4
N/A
0.002
N/A
N/A
10.2
8.7
0.3
0.1
2013
106
84
0.25
0.14
11.1
8.6
23.0
32.8
N/A
0.002
N/A
N/A
10.6
9.3
0.4
0.2
2012
115
97
0.25
0.13
11.6
9.4
23.8
34.0
N/A
0.007
N/A
N/A
11.1
7.9
0.5
0.3
2011
118
107
0.27
0.24
10.8
9.9
24.6
36.3
N/A
0.003
N/A
N/A
11.5
9.9
0.8
0.8
2010
110
81
0.25
0.30
12.8
8.8
22.8
31.7
N/A
0.002
N/A
N/A
11.4
9.8
1.1
0.7
2009
115
82
0.21
0.52
10.5
8.1
22.1
31.9
N/A
0.002
N/A
N/A
11.4
10.2
1.0
0.7
2008
105
78
0.30
0.51
13.1
9.8
22.1
31.0
0.006
N/A
N/A
N/A
12.4
N/A
1.3
1.4
2007
119
81
0.31
0.44
15.2
10.2
20.5
29.4
0.006
N/A
N/A
N/A
13.5
N/A
1.9
2.0
2006
134
95
0.32
0.43
14.6
10.1
22.3
33.7
0.006
N/A
N/A
N/A
13.0
N/A
2.3
1.2
2005
126
88
0.42
0.38
16.3
11.6
22.8
31.0
0.005
N/A
N/A
N/A
13.9
N/A
3.5
1.3
2004
137
75
0.44
0.46
17.7
10.5
20.4
28.6
0.010
N/A
N/A
N/A
N/A
N/A
3.2
0.6
2003
146
87
0.62
0.42
17.0
10.9
20.9
30.8
0.009
N/A
N/A
N/A
N/A
N/A
3.2
N/A
2002
128
91
0.55
0.35
16.1
14.3
19.7
29.0
0.007
N/A
N/A
N/A
N/A
N/A
1.7
2.0
2001
147
87
0.44
0.69
18.4
13.1
19.6
31.0
0.008
N/A
N/A
N/A
N/A
N/A
2.5
1.8
2000
136
89
0.50
0.66
17.0
13.4
22.0
29.5
0.008
N/A
N/A
N/A
N/A
N/A
3.1
3.0
Natural disasters
Type
Houston
Oklahoma City
Tornado activity compared to U.S. average
187.3%
353.4%
Earthquake activity compared to U.S. average
63.9%
938.9%
Natural disasters compared to U.S. average
32%
43%
Transportation
Houston provides better public transit, although traffic can be an issue during rush hours. METRORail, buses, and taxis are available as public transit options. Oklahoma City mainly relies on cars for commuting, with limited bus services and a small commuter rail line.
Transport
Type
Houston
Oklahoma City
Amtrak stations
1
1
Amtrak stations nearby
2
2
FAA registered aircraft
1
0
FAA registered aircraft manufacturers and dealers
44
0
Means of transportation to work
Type
Houston
Oklahoma City
Bicycle
0.5%
0.2%
Bus
2.4%
0.3%
Carpooled
11.1%
8.6%
Car alone
81.2%
87.6%
Railroad
0.1%
0%
Taxicab
0.1%
0.2%
Walked
1.6%
1.4%
Average travel time to work
Type
Houston
Oklahoma City
Average
32 min
25.6 min
Other means
27.1 min
21 min
Public transportation
47.6 min
33.1 min
Private vehicle occupancy
Type
Houston
Oklahoma City
Average
1.2
1.2
Drove alone
86.4%
89.5%
In 2 person carpool
9.7%
7.1%
In 3 person carpool
2.4%
1.9%
In 4 person carpool
0.9%
0.7%
In 5-6 person carpool
0.4%
0.5%
In 7+ person carpool
0.3%
0.2%
How many people usually rode to work in the car, truck or van.
Real Estate
While real estate costs are higher in Houston, the city provides more variety in housing types and architectural styles. Oklahoma City's real estate is more affordable but offers fewer variations in home styles.
Neighborhoods
Houston has a multitude of diverse neighborhoods that cater to different lifestyles. However, Oklahoma City's neighborhoods are less varied. Downtown Oklahoma City has recently become more dynamic with increasing entertainment options and housing developments.
Houses and residents
Type
Houston
Oklahoma City
Houses
1,028,763
302,241
Average household size (people)
2.6
2.5
Median year apartment built
1985
1978
Median year house/condo built
1976
1986
Length of stay in the house since moving in
14.4 years
11.8 years
Houses occupied
924,981 (89.9%)
275,285 (91.1%)
Houses occupied by owners
390,226 (42.2%)
164,470 (59.7%)
Houses occupied by renters
534,755 (57.8%)
110,815 (40.3%)
Median rent asked for vacant for-rent units
$1,323
$1,241
Median monthly housing costs
$1,134
$983
Median price asked for vacant for-sale houses and condos
$334,556
$278,299
Estimated median house or condo value
$236,700
$190,900
Median numbers of rooms
4.4
5.5
Median number of rooms in apartments
3.5
4.3
Median number of rooms in houses and condos
6.1
6.2
Median house price - detached houses
$348,048
$254,772
Median house price - in 2-unit structures
$232,228
$318,820
Median house price - in 3-to-4-unit structures
$205,330
$128,784
Median house price - in 5 or more unit structures
$297,061
$170,231
Median house price - mobile homes
$68,903
$112,256
Median house price - occupied boats, rvs, vans etc.
$50,694
$67,765
Median house price - Townhouses or other attached units
$299,072
$245,885
Median house price - All housing units
$337,365
$249,488
Median house age
40
40
Renting percentage
54.6%
40.3%
Housing density (houses/condos per square mile)
1,775.5
497.9
House value disparities
40.9%
34.7%
Household income disparities
49%
44.3%
Median household income for houses/condes with a mortgage
$109,539
$87,907
Median household income for apartments without a mortgage
$65,707
$61,761
Housing units without a mortgage
4,386 (2.1%)
1,238 (1.2%)
Housing units with both a second mortgage and home equity loan
7,696 (3.6%)
4,838 (4.7%)
Housing units with a mortgage
207,809 (97.9%)
100,798 (98.8%)
Housing units with a home equity loan
421 (0.2%)
123 (0.1%)
Housing units with a second mortgage
11,969 (5.6%)
5,921 (5.8%)
House/condo owner moved in on average (years ago)
13
9
House/condo renter moved in on average (years ago)
1
1
Housing units lacking complete kitchen facilities
2.4%
3.1%
Housing units lacking complete plumbing facilities
1.5%
1.9%
Housing units in structures
Housing units in structures
Houston
Oklahoma City
One, detached
43.2%
67.8%
One, attached
4.8%
3.4%
Two
2.2%
2.0%
3 or 4
4.4%
5.1%
5 to 9
7.1%
6.0%
10 to 19
10.9%
5.6%
20 to 49
7.7%
2.4%
50 or more
18.6%
4.6%
Mobile homes
0.9%
3.1%
Boats, RVs, vans, etc.
0.1%
0.1%
Median real estate property taxes paid for housing units
Self-employed workers in own not incorporated business
75,956
20,964
State government workers
38,359
17,132
Unpaid family workers
2,429
555
Industries and Occupations
Houston's primary industries include energy, manufacturing, aeronautics, and healthcare. Oklahoma City leans heavily on petroleum products, natural gas, and agricultural outputs. Houston tends to have higher-paying occupations due to its stronger economic sectors.
Houston holds an edge in healthcare because of the presence of the Texas Medical Center, the world's largest medical complex. Oklahoma City, however, offers quality healthcare services through organizations like the Integris Health System and the OU Medical Center.
Health (county statistics)
Type
Houston
Oklahoma City
General health status score of residents in this county from 1 (poor) to 5 (excellent)
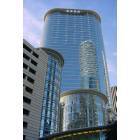
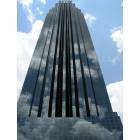
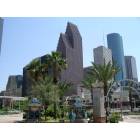
Houston’s infrastructure is more developed and modern, featuring numerous skyscrapers and a comprehensive highway system. Oklahoma City has less urban development but has recently seen improvement in its downtown area and public spaces, including parks and trails.
Infrastructure
Type
Houston
Oklahoma City
Hospitals
156
61
TV stations
26
20
Arenas or stadiums
6
4
Bank branches located here
755
183
Bank institutions located here
81
44
Main business address for public companies
197
15
Drinking water stations with no reported violations in the past
49
4
Drinking water stations with reported violations in the past
HMDA - Conventional home purchase loans - Applications denied
Year
Houston
Oklahoma City
1999
9,163
2,925
2000
0
2,396
2001
0
1,824
2002
0
1,507
2003
8,173
2,014
2004
11,803
2,323
2005
15,127
3,134
2006
16,911
3,132
2007
10,643
2,036
2008
4,410
1,143
2009
2,279
593
Culture and Food
Houston is known for its food scene, cultural diversity, and a wide array of entertainment venues. It has multiple theaters, museums, and art galleries. Oklahoma City has a more homogenous culture, with influences from the cowboy heritage and its Native American history.
Sports Teams
Houston has several professional sports teams including the Houston Texans (NFL), Houston Astros (MLB), and Houston Rockets (NBA). Oklahoma City is home to the Oklahoma City Thunder (NBA). Both cities have vibrant sports cultures that appeal to sports fans.


 Houston, TX
 Oklahoma City, OK


