Houston, Texas, and Virginia Beach, Virginia, are two US cities that offer unique lifestyles with diverse cultural nuances. Houston is the country's fourth most populous city, renowned for its cities, energy industry, and NASA's Mission Control Center. On the other hand, Virginia Beach is a tourist haven known for its sandy coastline and naval bases. Overall, comparing the two cities could involve aspects like crime/safety, weather, living costs, city taxes, education, economy, infrastructure, major employers, real estate, transportation, and cultural influences.
Distance between
Houston, TX and
Virginia Beach, VA : 1,213.7 miles
Houston's population is larger by 400%. Its population has grown by 334,619 people (17.1%) since 2000. The population of Virginia Beach has grown by 32,415 people (7.6%) during that time.
Crime rates slightly vary between these two locations. Houston struggles with higher crime rates compared to national averages, including substantially higher violent and property crime rates. However, crime rates have been gradually decreasing over the years. Meanwhile, Virginia Beach boasts lower crime rates than national averages in both categories. This trait showcases its reputation as a safer, more family-friendly destination, suitable for both residents and visitors.
City-data.com crime index counts serious crimes and violent crime more heavily. It adjusts for the number of visitors and daily workers commuting into cities. (higher means more crime, U.S. average = 301.1)
City-data.com crime index counts serious crimes and violent crime more heavily. It adjusts for the number of visitors and daily workers commuting into cities. (higher means more crime, U.S. average = 301.1)
Sex Offenders
According to our data, there are 7,873 registered sex offenders living in Houston and 706 registered sex offenders living in . The ratio of residents to sex offenders in Houston is 293 to 1; the ratio in Virginia Beach is 641 to 1. The number of registered sex offenders compared to the number of residents is larger in Houston than in Virginia Beach.
Cost of Living
Living in Houston is generally less expensive than in Virginia Beach. While cost depends on the neighborhood, Houston's average living cost, including housing, food, health, transportation, and entertainment, is lesser than the national average. Conversely, Virginia Beach's living costs are slightly higher than the national average, particularly in housing.
Income Tax
Texas doesn't impose an income tax, making Houston an attractive location for individuals and businesses. Virginia, on the other hand, levies a state income tax with rates ranging from 2% to 5.75%.
Property Tax
Property taxes in Houston are relatively high, above the national average, while property taxes in Virginia Beach are moderate, contributing to its residential appeal.
Sales Tax
Texas has a sales tax that varies from 6.25% to 8.25%, while Virginia's sales tax is 4.3% statewide, increasing with local surtaxes up to 6%.
Income
Type
Houston
Virginia Beach
Estimated median household income
$55,499
$81,634
Estimated per capita income
$36,265
$42,498
Cost of living index (U.S. average is 100)
97.2
97
If you make $50,000 in Virginia Beach, you will have to make $50,103 in Houston to maintain the same standard of living.
Geographical Conditions
Houston is primarily a flat, broad, marshy land situated near the Gulf of Mexico, providing a completely different geographical entity than Virginia Beach's coastal, sandy, and occasionally hilly landscape.
Both cities are home to prominent educational institutions. Houston's educational sector is anchored by institutions like the University of Houston and Rice University. The public school system is also extensive and well-established. On the other hand, Virginia Beach has a strong primary and secondary educational system but fewer higher education opportunities.
Houston hosts a vibrant economy driven by the oil and gas, aeronautics, and healthcare industries. The city's unemployment rate is comparable to the national average. On the flip side, Virginia Beach's economy hinges upon the military presence, tourism, and agribusiness. It generally has lower unemployment rates than the national average.
Biggest Employers
Houston's largest employers include energy giants like ExxonMobil and Chevron, healthcare providers like Memorial Hermann Health System, and the public school system. Virginia Beach's biggest employers are largely military related, including the Naval Air Station Oceana and Joint Expeditionary Base Little Creek.
There were 7,146 building permits issued in Houston in 2012 (4571 more than in 2011) compared to 335 building permits issued in Virginia Beach in 2012 (200 less than in 2011).
In Houston (Harris County), 49.4% voted for Democrats and 49.3% for Republicans in 2012 Presidential Election. In Virginia Beach (Virginia Beach city), 48.1% voted for Democrats and 50.7% for Republicans.
Elections
Type
Democrats
Republicans
Other
Year
Houston
Virginia Beach
Houston
Virginia Beach
Houston
Virginia Beach
2020
56.0%
51.6%
42.7%
46.2%
1.3%
2.2%
2016
54.0%
44.8%
41.6%
48.4%
4.4%
6.8%
2012
49.4%
48.1%
49.3%
50.7%
1.3%
1.2%
2008
50.5%
49.3%
48.9%
50.1%
0.6%
0.6%
2004
44.6%
40.4%
54.9%
59.3%
0.5%
0.4%
2000
43.0%
41.8%
54.4%
56.1%
2.6%
2.1%
1996
45.2%
41.4%
49.2%
50.6%
5.6%
8.0%
Breakdown of population affiliated with a religious congregation
Type
Adherents
Congregations
Religion
Houston
Virginia Beach
Houston
Virginia Beach
CATHOLIC CHURCH
18.1%
10.7%
3.6%
4.2%
SOUTHERN BAPTIST CONVENTION
14.2%
4.9%
26.8%
13.6%
MUSLIM ESTIMATE
2.9%
0.8%
1.6%
0.4%
EPISCOPAL CHURCH
1.0%
1.4%
1.4%
4.2%
LUTHERAN CHURCH
0.7%
0.2%
1.5%
0.8%
EVANGELICAL LUTHERAN CHURCH IN AMERICA
0.3%
0.4%
1.1%
1.5%
SEVENTH DAY ADVENTIST CHURCH
0.3%
0.1%
1.7%
1.1%
VINEYARD USA
0.1%
0.4%
0.2%
1.1%
AMERICAN BAPTIST CHURCHES IN THE USA
0.0%
0.4%
0.1%
0.4%
EVANGELICAL PRESBYTERIAN CHURCH
0.0%
0.3%
0.1%
0.4%
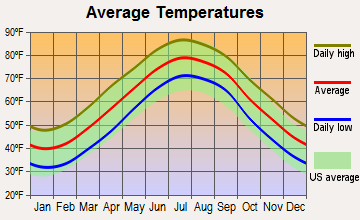
Weather
Weather conditions are considerably different in these two locations. Houston lies in a high-risk hurricane zone with hot, humid summers and mild winters. This climate facilitates outdoor activities year-round. Conversely, Virginia Beach experiences moderate weather with humid subtropical climate. Summers are hot and humid, winters cool but not too harsh, making it adored by lovers of seasonal transitions.
Weather and climate
Type
Houston
Virginia Beach
Temperature - Average
69.7°F
59.7°F
Humidity - Average morning or afternoon humidity
80.3%
73%
Humidity - Differences between morning and afternoon humidity
36.7%
32%
Humidity - Maximum monthly morning or afternoon humidity
92.8%
83%
Humidity - Minimum monthly morning or afternoon humidity
56.1%
51%
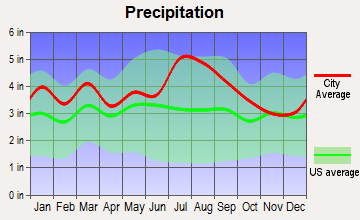
Precipitation - Yearly average
52.9 in
45.9 in
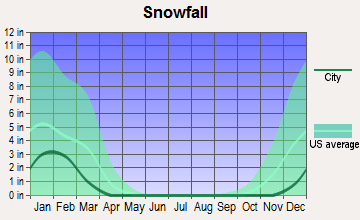
Snowfall - Yearly average
0.6 in
15.4 in
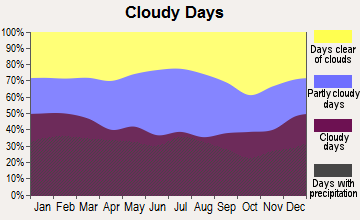
Clouds - Number of days clear of clouds
15%
17.6%
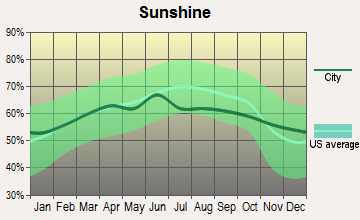
Sunshine amount - Average
60.4%
66.8%
Sunshine amount - Differences during a year
24%
14%
Sunshine amount - Maximum monthly
67%
67%
Sunshine amount - Minimum monthly
43%
53%
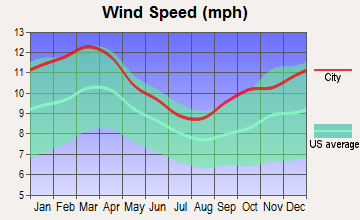
Wind speed - Average
8.2 mph
10.4 mph
Average climate in Houston, Texas
Average climate in Virginia Beach, Virginia
Air pollution
Type
AQI
CO
NO2
OZONE
PB
PM25
SO2
Year
Houston
Virginia Beach
Houston
Virginia Beach
Houston
Virginia Beach
Houston
Virginia Beach
Houston
Virginia Beach
Houston
Virginia Beach
Houston
Virginia Beach
2018
102
57
0.19
0.27
9.2
6.3
21.5
31.3
N/A
0.002
10.0
6.1
0.3
0.4
2017
96
60
0.16
0.22
9.4
6.8
23.1
33.2
N/A
0.002
9.1
6.9
0.3
0.3
2016
91
66
0.16
0.21
10.4
6.5
22.7
31.7
N/A
0.002
8.6
6.1
0.2
0.4
2015
109
57
0.15
0.27
10.1
7.3
21.7
33.8
N/A
0.002
9.9
6.4
0.2
0.5
2014
98
59
0.24
0.27
10.4
7.5
21.8
33.8
N/A
0.002
10.2
6.8
0.3
1.1
2013
106
66
0.25
0.28
11.1
7.1
23.0
31.2
N/A
0.002
10.6
6.8
0.4
1.1
2012
115
76
0.25
0.29
11.6
7.8
23.8
34.6
N/A
0.002
11.1
8.1
0.5
1.1
2011
118
66
0.27
0.27
10.8
9.2
24.6
35.1
N/A
0.003
11.5
8.8
0.8
1.7
2010
110
71
0.25
0.25
12.8
4.8
22.8
38.4
N/A
0.004
11.4
N/A
1.1
2.2
2009
115
51
0.21
0.25
10.5
9.7
22.1
31.5
N/A
0.012
11.4
N/A
1.0
2.6
2008
105
77
0.30
0.23
13.1
10.3
22.1
36.2
0.006
0.004
12.4
N/A
1.3
3.3
2007
119
81
0.31
0.18
15.2
12.2
20.5
36.3
0.006
0.004
13.5
N/A
1.9
4.3
2006
134
62
0.32
0.32
14.6
N/A
22.3
36.2
0.006
0.004
13.0
N/A
2.3
3.4
2005
126
67
0.42
0.28
16.3
N/A
22.8
35.4
0.005
N/A
13.9
N/A
3.5
3.4
2004
137
80
0.44
0.30
17.7
15.9
20.4
33.3
0.010
N/A
N/A
N/A
3.2
4.3
2003
146
84
0.62
0.34
17.0
16.2
20.9
34.3
0.009
N/A
N/A
N/A
3.2
3.9
2002
128
99
0.55
0.40
16.1
17.8
19.7
38.0
0.007
N/A
N/A
N/A
1.7
5.9
2001
147
92
0.44
0.42
18.4
18.2
19.6
36.3
0.008
N/A
N/A
N/A
2.5
6.0
2000
136
85
0.50
0.44
17.0
15.7
22.0
36.5
0.008
N/A
N/A
N/A
3.1
6.5
Natural disasters
Type
Houston
Virginia Beach
Tornado activity compared to U.S. average
187.3%
61.5%
Earthquake activity compared to U.S. average
63.9%
35.2%
Natural disasters compared to U.S. average
32%
0%
Transportation
Houston's Metropolitan Transit Authority provides extensive bus services and a light-rail system, while Houstonians mostly prefer driving. Virginia Beach's public transportation is limited, making personal vehicles nearly essential for commuting.
Transport
Type
Houston
Virginia Beach
Amtrak stations
1
1
Amtrak stations nearby
2
2
FAA registered aircraft
1
374
FAA registered aircraft manufacturers and dealers
44
4
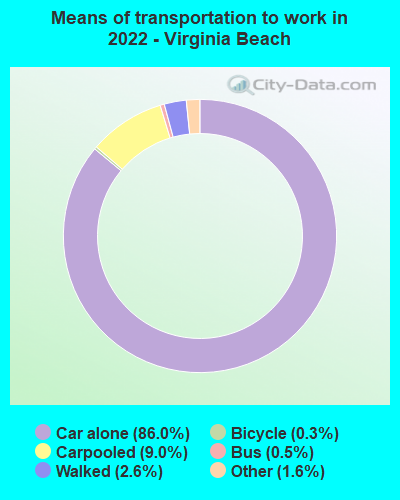
Means of transportation to work
Type
Houston
Virginia Beach
Bicycle
0.5%
0.2%
Bus
2.4%
1%
Carpooled
11.1%
9.5%
Car alone
81.2%
84.2%
Motorcycle
0.1%
0.1%
Railroad
0.1%
0%
Taxicab
0.1%
0%
Walked
1.6%
3.2%
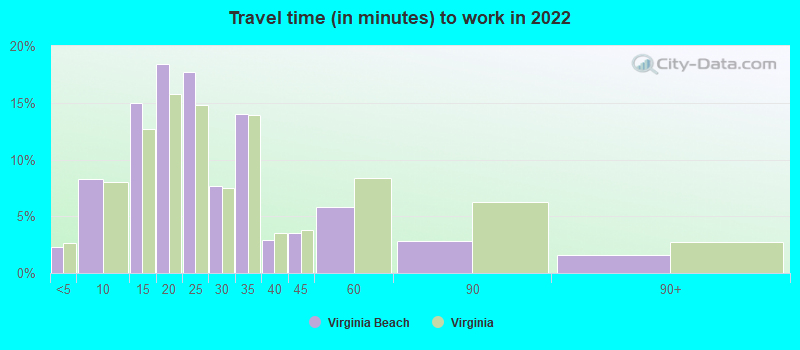
Average travel time to work
Type
Houston
Virginia Beach
Average
32 min
24.8 min
Other means
27.1 min
23.7 min
Public transportation
47.6 min
41.9 min
Private vehicle occupancy
Type
Houston
Virginia Beach
Average
1.2
1.1
Drove alone
86.4%
90.3%
In 2 person carpool
9.7%
8%
In 3 person carpool
2.4%
1.3%
In 4 person carpool
0.9%
0.2%
In 5-6 person carpool
0.4%
0.1%
In 7+ person carpool
0.3%
0%
How many people usually rode to work in the car, truck or van.
Real Estate
Real estate in Houston is generally affordable, with the median home value below the national average. However, the home value in Virginia Beach surpasses the national average, reflecting lower housing affordability in the coastal city.
Neighborhoods
Houston neighborhoods highlight cultural diversity with areas such as Montrose being a vibrant LGBTQ+ hub and the Fourth Ward steeped in African American history. Virginia Beach's neighborhoods, like the Oceanfront and Chesapeake Bay Area, exude a charming beach-town aura.
Houses and residents
Type
Houston
Virginia Beach
Houses
1,028,763
190,981
Average household size (people)
2.6
2.6
Median year apartment built
1985
1988
Median year house/condo built
1976
1983
Length of stay in the house since moving in
14.4 years
13.5 years
Houses occupied
924,981 (89.9%)
182,775 (95.7%)
Houses occupied by owners
390,226 (42.2%)
119,144 (65.2%)
Houses occupied by renters
534,755 (57.8%)
63,631 (34.8%)
Median rent asked for vacant for-rent units
$1,323
$1,833
Median monthly housing costs
$1,134
$1,490
Median price asked for vacant for-sale houses and condos
$334,556
$508,833
Estimated median house or condo value
$236,700
$328,500
Median numbers of rooms
4.4
6
Median number of rooms in apartments
3.5
4.6
Median number of rooms in houses and condos
6.1
7
Median house price - detached houses
$348,048
$459,164
Median house price - in 2-unit structures
$232,228
$200,674
Median house price - in 3-to-4-unit structures
$205,330
$279,464
Median house price - in 5 or more unit structures
$297,061
$229,647
Median house price - mobile homes
$68,903
$143,239
Median house price - occupied boats, rvs, vans etc.
$50,694
$85,917
Median house price - Townhouses or other attached units
$299,072
$261,878
Median house price - All housing units
$337,365
$401,957
Median house age
40
36
Renting percentage
54.6%
34.7%
Housing density (houses/condos per square mile)
1,775.5
769.2
House value disparities
40.9%
29%
Household income disparities
49%
40.6%
Median household income for houses/condes with a mortgage
$109,539
$104,941
Median household income for apartments without a mortgage
$65,707
$82,507
Housing units without a mortgage
4,386 (2.1%)
2,373 (2.6%)
Housing units with both a second mortgage and home equity loan
7,696 (3.6%)
9,070 (10%)
Housing units with a mortgage
207,809 (97.9%)
88,748 (97.4%)
Housing units with a home equity loan
421 (0.2%)
287 (0.3%)
Housing units with a second mortgage
11,969 (5.6%)
10,952 (12%)
House/condo owner moved in on average (years ago)
13
10
House/condo renter moved in on average (years ago)
1
1
Housing units lacking complete kitchen facilities
2.4%
1%
Housing units lacking complete plumbing facilities
1.5%
0.4%
Housing units in structures
Housing units in structures
Houston
Virginia Beach
One, detached
43.2%
53.2%
One, attached
4.8%
18.3%
Two
2.2%
1.7%
3 or 4
4.4%
4.6%
5 to 9
7.1%
9.0%
10 to 19
10.9%
4.5%
20 to 49
7.7%
2.1%
50 or more
18.6%
5.4%
Mobile homes
0.9%
1.1%
Boats, RVs, vans, etc.
0.1%
0.0%
Median real estate property taxes paid for housing units
Self-employed workers in own not incorporated business
75,956
9,992
State government workers
38,359
6,577
Unpaid family workers
2,429
251
Industries and Occupations
In Houston, the energy sector is the leading industry featuring Occidental Petroleum and ConocoPhillips. Conversely, military and defense are Virginia Beach's main industries, with many residents employed at the local naval bases. Tourism is a significant seasonal employer in Virginia Beach.
Houston is renowned for its world-class healthcare, home to the largest medical complex globally, the Texas Medical Center. Virginia Beach's healthcare system is also reliable, but not as internationally acclaimed as Houston's.
Health (county statistics)
Type
Houston
Virginia Beach
General health status score of residents in this county from 1 (poor) to 5 (excellent)
Houston's modern infrastructure includes elements like the expansion of light-rail, the construction of new parks, and an extensive highway system. Conversely, Virginia Beach is known for its beachfront infrastructure, boosting tourism efforts. However, Houston's constant development projects may pose traffic problems.
Infrastructure
Type
Houston
Virginia Beach
Hospitals
156
7
TV stations
26
24
Bank branches located here
755
96
Bank institutions located here
81
16
Main business address for public companies
197
2
Drinking water stations with no reported violations in the past
49
6
Drinking water stations with reported violations in the past
HMDA - Conventional home purchase loans - Applications denied
Year
Houston
Virginia Beach
1999
9,163
0
2003
8,173
941
2004
11,803
1,388
2005
15,127
1,545
2006
16,911
1,502
2007
10,643
1,073
2008
4,410
340
2009
2,279
167
Culture and Food
Houston offers a diverse cultural scene featuring Museums, Theater Districts, and rich cuisine varying from authentic Mexican to traditional Southern barbecue. Virginia Beach gives a taste of East Coast cultures with a focus on seafood and colonial-era historical sites.
Sports Teams
Houston supports various major professional teams like the Houston Astros (MLB), Houston Rockets (NBA), and Houston Texans (NFL), granting the city a vibrant sports culture. However, Virginia Beach doesn't have any major league teams but fervently supports local semi-pro and college teams.


 Houston, TX
 Virginia Beach, VA