Indianapolis, Indiana, and Aurora, Colorado, are two different cities offering a variety of experiences for residents and tourists alike. Indianapolis is a culturally rich, sports-centric city with a high population, while Aurora, smaller in population but larger in land area, is admired for its outdoor activities and views of the Rocky Mountains. However, differences in weather, cost of living, tax rates and other factors can significantly impact one's lifestyle in these cities. This comparison will provide insights into these variables, helping potential movers and tourists make informed decisions.
Distance between
Indianapolis, IN and
Aurora, CO : 989.5 miles
Indianapolis's population is larger by 127%. Its population has grown by 100,169 people (12.8%) since 2000. The population of Aurora has grown by 112,954 people (40.9%) during that time.
Indianapolis has seen a higher crime rate than the national average, with offenses such as burglaries, thefts and assaults, although efforts are in place to reduce these figures. On the other hand, Aurora, being significantly smaller, has a slightly lower crime rate compared to the national average, making it a safer option for families and retirees.
City-data.com crime index counts serious crimes and violent crime more heavily. It adjusts for the number of visitors and daily workers commuting into cities. (higher means more crime, U.S. average = 301.1)
City-data.com crime index counts serious crimes and violent crime more heavily. It adjusts for the number of visitors and daily workers commuting into cities. (higher means more crime, U.S. average = 301.1)
Sex Offenders
According to our data, there are 82 registered sex offenders living in Indianapolis and 1,043 registered sex offenders living in . The ratio of residents to sex offenders in Indianapolis is 10,396 to 1; the ratio in Aurora is 347 to 1. The number of registered sex offenders compared to the number of residents is a lot smaller in Indianapolis than in Aurora.
Cost of Living
The cost of living in Indianapolis is relatively lower than the national average, making it an attractive choice for those looking to move. In contrast, the cost of living in Aurora is slightly higher than the national average, driven by the costs associated with housing and transportation.
Income Tax
Indiana has a flat state income tax rate of 3.23%, applicable to Indianapolis residents. Colorado's income tax is a flat rate of 4.63%, which applies to residents in Aurora.
Property Tax
Property tax in Indianapolis averages 0.85% of a property's assessed fair market value, which is lower than the national average. Aurora homeowners also enjoy a lower property tax rate, just above 0.5% of the home value.
Sales Tax
Indianapolis has a sales tax rate of 7%, which is higher than the national average. Aurora has a combined (city and state) sales tax rate of 8.5%, making it higher than both the national average and Indianapolis.
Income
Type
Indianapolis
Aurora
Estimated median household income
$58,479
$71,647
Estimated per capita income
$32,792
$35,054
Cost of living index (U.S. average is 100)
87.7
109.4
If you make $50,000 in Indianapolis, you will have to make $62,372 in Aurora to maintain the same standard of living.
Geographical Conditions
Indianapolis is located on the Indiana flatlands, characterized by gently rolling terrain. Aurora, however, offers stunning views of the Rocky Mountains and is known for its open spaces and proximity to nature.
Indianapolis has several well-rated public, private and charter schools and is home to many reputed colleges and universities, including Indiana University-Purdue University Indianapolis. Aurora features a good education system with strong public schools, and it's just a short drive away from the University of Colorado Boulder.
Indianapolis' economy is based on sectors such as health care, education, finance, and hospitality, with the job growth rate slightly below the national average. Aurora, as part of the Denver metropolitan area, has a varied employment landscape, with healthcare, retail, and manufacturing prominent industries driving job growth and economic stability.
Biggest Employers
In Indianapolis, some of the largest employers are Indiana University Health, Eli Lilly and Company, and the local government. In Aurora, top employers include the University of Colorado Anschutz Medical Campus, Aurora Public Schools, and Buckley Space Force Base.
In Indianapolis (Marion County), 60.1% voted for Democrats and 37.9% for Republicans in 2012 Presidential Election. In Aurora (Adams County), 57.3% voted for Democrats and 40.4% for Republicans.
Elections
Type
Democrats
Republicans
Other
Year
Indianapolis
Aurora
Indianapolis
Aurora
Indianapolis
Aurora
2020
63.7%
57.1%
34.5%
40.7%
1.9%
2.2%
2016
58.2%
50.1%
35.6%
41.6%
6.2%
8.3%
2012
60.1%
57.3%
37.9%
40.4%
2.0%
2.3%
2008
63.8%
58.5%
35.4%
40.1%
0.8%
1.4%
2004
50.6%
50.7%
48.7%
48.4%
0.7%
0.9%
2000
48.0%
50.3%
49.3%
44.2%
2.8%
5.5%
1996
44.6%
51.3%
47.8%
38.9%
7.7%
9.8%
Breakdown of population affiliated with a religious congregation
Type
Adherents
Congregations
Religion
Indianapolis
Aurora
Indianapolis
Aurora
CATHOLIC CHURCH
11.1%
16.0%
4.6%
4.5%
SOUTHERN BAPTIST CONVENTION
1.6%
0.7%
5.7%
7.8%
AMERICAN BAPTIST CHURCHES IN THE USA
1.2%
0.0%
3.4%
0.4%
LUTHERAN CHURCH
0.8%
0.7%
1.5%
3.3%
EVANGELICAL LUTHERAN CHURCH IN AMERICA
0.5%
0.4%
1.6%
2.5%
SEVENTH DAY ADVENTIST CHURCH
0.5%
0.4%
1.6%
3.3%
EPISCOPAL CHURCH
0.4%
0.1%
1.1%
1.2%
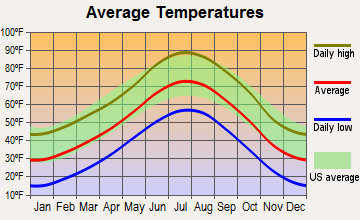
Weather
Indianapolis experiences a humid continental climate with hot summers and relatively cold winters. Aurora belongs to a semi-arid, continental climate zone with more sunny days but also colder winters thanks to its higher elevation. In Aurora, one can expect snowfall that's temporary, melting quickly due to often sunny days.
Weather and climate
Type
Indianapolis
Aurora
Temperature - Average
52.1°F
49.9°F
Humidity - Average morning or afternoon humidity
77%
50.6%
Humidity - Differences between morning and afternoon humidity
31%
20%
Humidity - Maximum monthly morning or afternoon humidity
86%
55%
Humidity - Minimum monthly morning or afternoon humidity
55%
35%
Precipitation - Yearly average
40.6 in
16.9 in
Snowfall - Yearly average
51 in
114 in
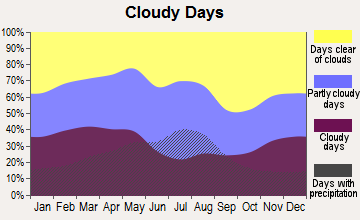
Clouds - Number of days clear of clouds
14.7%
19.2%
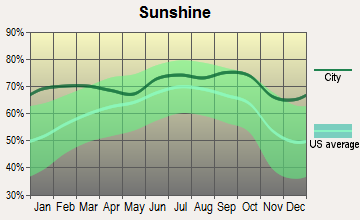
Sunshine amount - Average
56.2%
75.6%
Sunshine amount - Differences during a year
33%
10%
Sunshine amount - Maximum monthly
65%
74%
Sunshine amount - Minimum monthly
32%
64%
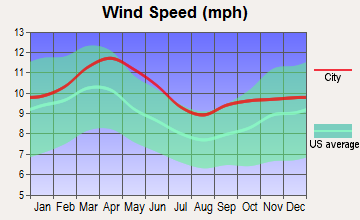
Wind speed - Average
10.3 mph
8.6 mph
Average climate in Indianapolis, Indiana
Average climate in Aurora, Colorado
Air pollution
Type
AQI
CO
NO2
OZONE
PB
PM10
PM25
SO2
Year
Indianapolis
Aurora
Indianapolis
Aurora
Indianapolis
Aurora
Indianapolis
Aurora
Indianapolis
Aurora
Indianapolis
Aurora
Indianapolis
Aurora
Indianapolis
Aurora
2018
94
99
0.58
0.37
13.2
21.5
23.1
31.3
N/A
N/A
18.2
29.2
10.4
8.5
0.3
0.7
2017
87
95
0.82
0.37
12.4
21.9
23.0
31.1
N/A
N/A
17.6
22.0
10.1
8.5
0.4
0.9
2016
91
90
0.62
0.42
13.0
24.0
22.5
30.7
N/A
N/A
18.0
22.6
9.9
8.1
0.4
1.0
2015
89
101
0.73
0.44
14.9
22.8
22.9
29.5
N/A
N/A
19.7
20.6
9.9
9.5
1.1
1.1
2014
100
94
0.62
0.42
16.1
21.8
25.1
29.6
N/A
N/A
20.6
22.5
12.1
10.1
3.2
1.3
2013
94
84
0.69
0.39
11.5
19.6
26.3
29.9
N/A
N/A
19.9
21.9
12.8
N/A
2.6
1.4
2012
103
90
0.65
0.35
10.4
18.9
25.7
30.8
N/A
N/A
20.8
24.2
12.9
N/A
2.9
1.2
2011
105
91
0.68
0.34
11.3
18.1
22.9
30.9
N/A
N/A
N/A
23.8
16.3
N/A
2.4
1.5
2010
101
81
0.54
0.41
12.7
16.3
21.6
28.8
N/A
N/A
N/A
26.6
15.9
N/A
3.3
1.0
2009
97
79
0.73
0.37
11.4
14.1
23.2
27.1
N/A
0.005
N/A
22.6
13.8
N/A
1.9
1.3
2008
91
85
0.62
0.41
11.5
17.3
N/A
28.8
0.010
0.008
N/A
25.5
13.2
N/A
3.0
1.6
2007
103
96
0.69
0.42
13.1
20.6
N/A
25.4
0.011
0.007
N/A
28.8
14.9
N/A
3.6
1.2
2006
95
89
0.59
0.50
14.5
19.0
N/A
25.0
0.009
0.027
N/A
28.0
14.5
N/A
3.6
1.4
2005
121
86
0.65
0.57
15.2
21.3
N/A
22.5
0.014
0.109
N/A
29.6
18.0
N/A
4.3
1.5
2004
104
82
0.62
0.61
15.8
21.2
N/A
21.4
0.010
0.037
N/A
28.6
15.1
N/A
4.6
1.8
2003
113
106
0.67
0.62
16.6
21.2
N/A
23.1
0.010
0.040
N/A
32.6
15.8
N/A
4.2
1.9
2002
125
86
0.76
0.64
17.4
19.2
N/A
22.8
0.009
0.028
N/A
35.7
16.8
N/A
3.9
2.5
2001
105
95
0.81
0.79
16.6
24.0
N/A
20.4
0.031
0.030
N/A
32.6
16.3
N/A
3.8
2.6
2000
98
93
0.87
0.77
17.3
13.8
N/A
21.4
N/A
0.033
N/A
12.2
N/A
N/A
4.5
2.1
Natural disasters
Type
Indianapolis
Aurora
Tornado activity compared to U.S. average
226.7%
138.7%
Earthquake activity compared to U.S. average
179.6%
796.4%
Natural disasters compared to U.S. average
16%
11%
Transportation
Indianapolis features a comprehensive bus system operated by IndiGo and is considered a car-centric city. Aurora is served by RTD bus service and light rail lines connecting to the Denver metro region, making commuting quite convenient.
Transport
Type
Indianapolis
Aurora
Amtrak stations
1
0
Amtrak stations nearby
1
2
FAA registered aircraft
739
138
FAA registered aircraft manufacturers and dealers
18
19
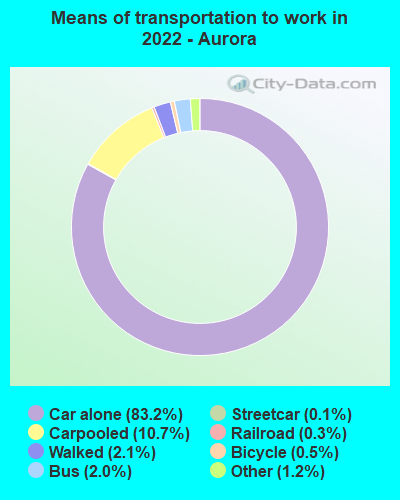
Means of transportation to work
Type
Indianapolis
Aurora
Bicycle
0.5%
0.6%
Bus
1.2%
1.7%
Carpooled
8.5%
9.3%
Car alone
87.3%
84.4%
Subway
0%
0.1%
Walked
1.6%
2.5%
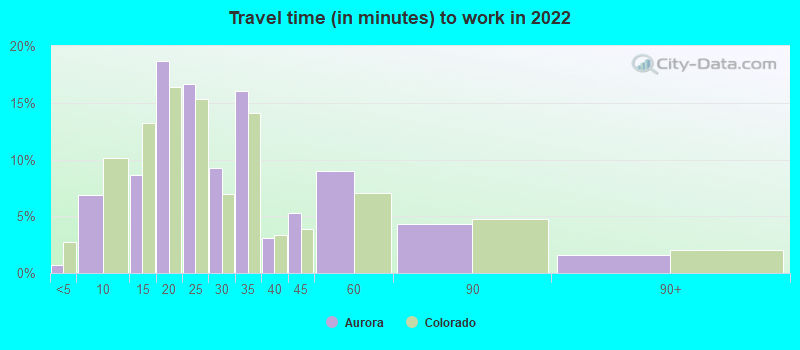
Average travel time to work
Type
Indianapolis
Aurora
Average
28.1 min
28.3 min
Other means
22.5 min
26.9 min
Public transportation
40.2 min
50.5 min
Private vehicle occupancy
Type
Indianapolis
Aurora
Average
1.2
1.2
Drove alone
88.2%
85.1%
In 2 person carpool
9.4%
10%
In 3 person carpool
1.3%
2.8%
In 4 person carpool
0.5%
1.5%
In 5-6 person carpool
0.4%
0.3%
In 7+ person carpool
0.1%
0.2%
How many people usually rode to work in the car, truck or van.
Real Estate
Real estate in Indianapolis is relatively affordable with a lower than average home price. Aurora, on the other hand, has seen home prices increase in recent years, reflecting the rising cost of living in the Denver Metro area.
Neighborhoods
Indianapolis neighborhoods offer a mix of urban and suburban living. Places like Carmel and Fishers are family-friendly. Aurora features upscale neighborhoods such as Tallyn's Reach and Meadow Hills while offering an unobstructed view of the Rocky Mountains for outdoors-loving residents.
Houses and residents
Type
Indianapolis
Aurora
Houses
399,820
149,636
Average household size (people)
2.4
2.7
Median year apartment built
1977
1986
Median year house/condo built
1971
1984
Length of stay in the house since moving in
13 years
10.4 years
Houses occupied
358,150 (89.6%)
140,003 (93.6%)
Houses occupied by owners
201,149 (56.2%)
89,615 (64%)
Houses occupied by renters
157,001 (43.8%)
50,388 (36%)
Median rent asked for vacant for-rent units
$876.58
$2,036
Median monthly housing costs
$980
$1,526
Median price asked for vacant for-sale houses and condos
$283,027
$725,445
Estimated median house or condo value
$188,700
$411,400
Median numbers of rooms
5.5
5.5
Median number of rooms in apartments
4.3
3.9
Median number of rooms in houses and condos
6.5
6.5
Median house price - detached houses
$231,490
$500,029
Median house price - in 2-unit structures
$257,253
$384,060
Median house price - in 3-to-4-unit structures
$240,688
$254,381
Median house price - in 5 or more unit structures
$247,275
$231,026
Median house price - mobile homes
$58,413
$130,226
Median house price - Townhouses or other attached units
$222,424
$471,483
Median house price - All housing units
$229,666
$476,379
Median house age
48
36
Renting percentage
44.2%
40.1%
Housing density (houses/condos per square mile)
1,106.1
1,050.1
House value disparities
36.1%
23.6%
Household income disparities
44.4%
41.5%
Median household income for houses/condes with a mortgage
$86,008
$99,433
Median household income for apartments without a mortgage
$61,922
$63,316
Housing units without a mortgage
4,552 (3.2%)
424 (0.6%)
Housing units with both a second mortgage and home equity loan
9,787 (6.8%)
5,246 (7.8%)
Housing units with a mortgage
138,622 (96.8%)
66,791 (99.4%)
Housing units with a home equity loan
271 (0.2%)
176 (0.3%)
Housing units with a second mortgage
12,987 (9.1%)
6,860 (10.2%)
House/condo owner moved in on average (years ago)
11
7
House/condo renter moved in on average (years ago)
1
1
Housing units lacking complete kitchen facilities
3.4%
1%
Housing units lacking complete plumbing facilities
1.1%
0.6%
Housing units in structures
Housing units in structures
Indianapolis
Aurora
One, detached
59.0%
52.6%
One, attached
9.2%
11.9%
Two
2.5%
0.2%
3 or 4
6.2%
4.2%
5 to 9
7.7%
7.1%
10 to 19
6.3%
11.0%
20 to 49
3.1%
5.5%
50 or more
5.0%
5.7%
Mobile homes
1.0%
1.7%
Median real estate property taxes paid for housing units
Self-employed workers in own not incorporated business
17,131
13,677
State government workers
15,502
5,134
Unpaid family workers
1,601
0
Industries and Occupations
Major industries in Indianapolis include manufacturing, healthcare, education, and finance. In contrast, Aurora's economy is dominated by industries like aerospace, retail, healthcare, and bioscience.
Indianapolis is home to many top-ranked hospitals, including the renowned Indiana University Health Medical Center. On the other hand, Aurora boasts the Anschutz Medical Campus, one of the largest and most advanced medical campuses in the country.
Health (county statistics)
Type
Indianapolis
Aurora
General health status score of residents in this county from 1 (poor) to 5 (excellent)
Indianapolis boasts high-quality infrastructure, including the highly-rated Indianapolis International Airport and a well-developed highways network. Aurora, being part of the Denver Metro area, shares the top-notch infrastructure, airport, and highways.
Infrastructure
Type
Indianapolis
Aurora
Hospitals
76
4
TV stations
19
15
Bank branches located here
259
77
Bank institutions located here
27
19
Main business address for public companies
28
1
Drinking water stations with no reported violations in the past
1
1
Drinking water stations with reported violations in the past
HMDA - Conventional home purchase loans - Applications denied
Year
Indianapolis
Aurora
1999
3,358
1,737
2000
3,562
1,460
2001
2,649
1,056
2002
1,915
635
2003
2,519
1,276
2004
3,702
2,052
2005
6,057
3,087
2006
5,811
2,880
2007
3,456
1,693
2008
1,247
782
2009
565
302
Culture and Food
Indianapolis brings Midwestern charm to its culture and food, offering sports events, racing culture and signature dishes such as pork tenderloin sandwiches. Aurora is known for its diverse food culture influenced by Hispanic, Korean, and Ethiopian communities, among others.
Sports Teams
Indianapolis is renowned for its sports culture, hosting the Indianapolis Colts (NFL) and the Indiana Pacers (NBA). Aurora doesn't host major sports teams but Denver’s teams — Nuggets (NBA), Broncos (NFL), and Rockies (MLB) — are popular in the area.


 Indianapolis, IN and
  Aurora, CO : 989.5 miles