A comparison of Indianapolis, IN and Aurora, IL takes into account various factors that influence the quality of life. As two diverse American cities, they offer different perspectives and cater to varied interests. This in-depth examination of qualities such as safety, weather conditions, education, economy, infrastructure among others, serves as an essential guide for potential residents or tourists contemplating relocation or a visit.
Distance between
Indianapolis, IN and
Aurora, IL : 176.5 miles
Indianapolis's population is larger by 392%. Its population has grown by 100,169 people (12.8%) since 2000. The population of Aurora has grown by 36,276 people (25.4%) during that time.
Indianapolis, although larger than Aurora, experiences higher crime rates overall. Considering safety is critical for both residents and tourists. According to FBI crime data, Indianapolis has a higher crime rate than the national average. Aurora, on the other hand, has been noted consistently as one of the safest cities in the US relative to its size, with crime rates consistently below the national average.
City-data.com crime index counts serious crimes and violent crime more heavily. It adjusts for the number of visitors and daily workers commuting into cities. (higher means more crime, U.S. average = 301.1)
City-data.com crime index counts serious crimes and violent crime more heavily. It adjusts for the number of visitors and daily workers commuting into cities. (higher means more crime, U.S. average = 301.1)
Sex Offenders
According to our data, there are 81 registered sex offenders living in Indianapolis and 252 registered sex offenders living in . The ratio of residents to sex offenders in Indianapolis is 10,525 to 1; the ratio in Aurora is 782 to 1. The number of registered sex offenders compared to the number of residents is a lot smaller in Indianapolis than in Aurora.
Cost of Living
When it comes to the cost of living, Indianapolis remains lower than the national average and offers a favorable economic environment. While Aurora has a slightly higher cost of living than the national average, largely due to housing costs.
Income Tax
Indiana poses a flat state income tax rate of 3.23% which applies to everyone in Indianapolis. On the flip side, Illinois has a flat income tax rate of 4.95% which applies to Aurora's residents.
Property Tax
Both cities have high property taxes, but Aurora, in Illinois, tends to have a higher property tax rate than Indianapolis.
Sales Tax
The combined sales tax rate for Indianapolis is 7%, while the combined sales tax rate for Aurora is slightly higher at 8%.
Income
Type
Indianapolis
Aurora
Estimated median household income
$58,479
$83,996
Estimated per capita income
$32,792
$34,054
Cost of living index (U.S. average is 100)
87.7
100.6
If you make $50,000 in Indianapolis, you will have to make $57,355 in Aurora to maintain the same standard of living.
Geographical Conditions
Indianapolis, located in Central Indiana, is characterized by flat to undulating topography and abundant green spaces. Located at the confluence of three rivers, Aurora is mostly a flat landscape with a variety of natural settings due to its advantageous location near Lake Michigan.
Indianapolis is home to highly-rated schools and houses several colleges and universities, including Indiana University-Purdue University Indianapolis (IUPUI). On the contrary, Aurora also showcases several excellent public schools, and Aurora University adds to the city's educational credibility.
Despite the economic diversity Indianapolis offers, it's recognized for its finance and insurance sector, healthcare, and professional and business services. On the other hand, Aurora has a diversified economy including manufacturing, retail trade, and educational services.
Biggest Employers
In Indianapolis, some of the major employers include Indiana University Health, Eli Lilly and Company, and the City of Indianapolis. While in Aurora, the largest employers are Caterpillar, Inc., Rush-Copley Medical Center, and West Aurora School District.
There were 1,221 building permits issued in Indianapolis in 2012 (704 more than in 2011) compared to 55 building permits issued in Aurora in 2012 (12 less than in 2011).
In Indianapolis (Marion County), 60.1% voted for Democrats and 37.9% for Republicans in 2012 Presidential Election. In Aurora (Kane County), 49.7% voted for Democrats and 48.6% for Republicans.
Elections
Type
Democrats
Republicans
Other
Year
Indianapolis
Aurora
Indianapolis
Aurora
Indianapolis
Aurora
2020
63.7%
56.3%
34.5%
41.9%
1.9%
1.8%
2016
58.2%
52.0%
35.6%
41.5%
6.2%
6.4%
2012
60.1%
49.7%
37.9%
48.6%
2.0%
1.6%
2008
63.8%
55.4%
35.4%
43.6%
0.8%
1.0%
2004
50.6%
44.1%
48.7%
55.1%
0.7%
0.8%
2000
48.0%
42.5%
49.3%
54.5%
2.8%
3.0%
1996
44.6%
41.8%
47.8%
47.4%
7.7%
10.8%
Breakdown of population affiliated with a religious congregation
Type
Adherents
Congregations
Religion
Indianapolis
Aurora
Indianapolis
Aurora
CATHOLIC CHURCH
11.1%
30.2%
4.6%
8.6%
SOUTHERN BAPTIST CONVENTION
1.6%
0.5%
5.7%
4.9%
AMERICAN BAPTIST CHURCHES IN THE USA
1.2%
0.9%
3.4%
3.1%
LUTHERAN CHURCH
0.8%
2.6%
1.5%
6.1%
EVANGELICAL LUTHERAN CHURCH IN AMERICA
0.5%
1.8%
1.6%
4.3%
SEVENTH DAY ADVENTIST CHURCH
0.5%
0.3%
1.6%
2.8%
EPISCOPAL CHURCH
0.4%
0.6%
1.1%
2.5%
MUSLIM ESTIMATE
0.3%
2.6%
1.1%
1.2%
Weather
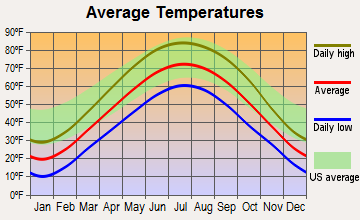
If a milder, more predictable climate entices you, Aurora, part of the Midwestern "Prairie State," is an ideal selection. Summers are pleasant, winters are cold, and the city sees a fair amount of rain during the year. Weather conditions in Indianapolis are also typical of the Midwest, with hot, humid summers and generally mild to cool winters, but there can be occasional extreme temperature shifts.
Weather and climate
Type
Indianapolis
Aurora
Temperature - Average
52.1°F
48°F
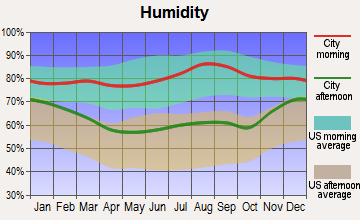
Humidity - Average morning or afternoon humidity
77%
75.7%
Humidity - Differences between morning and afternoon humidity
31%
31.3%
Humidity - Maximum monthly morning or afternoon humidity
86%
85.3%
Humidity - Minimum monthly morning or afternoon humidity
55%
54%
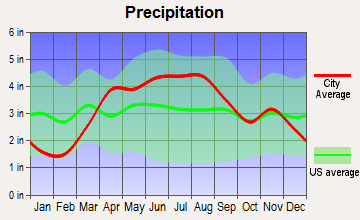
Precipitation - Yearly average
40.6 in
38.4 in
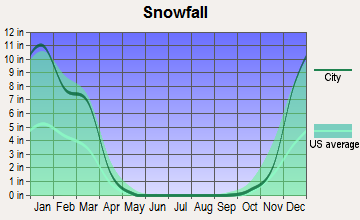
Snowfall - Yearly average
51 in
77.2 in
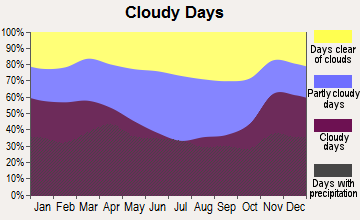
Clouds - Number of days clear of clouds
14.7%
14.1%
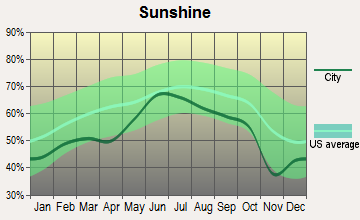
Sunshine amount - Average
56.2%
56.8%
Sunshine amount - Differences during a year
33%
33%
Sunshine amount - Maximum monthly
65%
68%
Sunshine amount - Minimum monthly
32%
35%
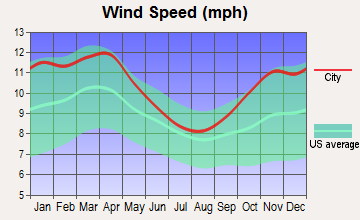
Wind speed - Average
10.3 mph
10.7 mph
Average climate in Indianapolis, Indiana
Average climate in Aurora, Illinois
Air pollution
Type
AQI
CO
NO2
OZONE
PB
PM10
PM25
SO2
Year
Indianapolis
Aurora
Indianapolis
Indianapolis
Indianapolis
Aurora
Indianapolis
Indianapolis
Aurora
Indianapolis
Aurora
Indianapolis
Aurora
2018
94
85
0.58
N/A
13.2
N/A
23.1
26.6
N/A
N/A
18.2
23.9
10.4
10.6
0.3
0.9
2017
87
76
0.82
N/A
12.4
N/A
23.0
27.8
N/A
N/A
17.6
26.2
10.1
N/A
0.4
1.0
2016
91
77
0.62
N/A
13.0
N/A
22.5
27.6
N/A
N/A
18.0
27.7
9.9
N/A
0.4
0.5
2015
89
76
0.73
N/A
14.9
N/A
22.9
26.3
N/A
N/A
19.7
36.0
9.9
N/A
1.1
1.5
2014
100
72
0.62
N/A
16.1
N/A
25.1
24.8
N/A
N/A
20.6
46.2
12.1
N/A
3.2
1.0
2013
94
72
0.69
N/A
11.5
N/A
26.3
24.3
N/A
N/A
19.9
N/A
12.8
N/A
2.6
2.1
2012
103
87
0.65
N/A
10.4
N/A
25.7
25.7
N/A
N/A
20.8
N/A
12.9
10.3
2.9
2.5
2011
105
82
0.68
N/A
11.3
N/A
22.9
24.6
N/A
N/A
N/A
26.9
16.3
12.8
2.4
3.1
2010
101
87
0.54
N/A
12.7
N/A
21.6
24.3
N/A
N/A
N/A
26.5
15.9
12.6
3.3
2.7
2009
97
94
0.73
N/A
11.4
N/A
23.2
21.7
N/A
N/A
N/A
26.4
13.8
13.2
1.9
2.7
2008
91
87
0.62
N/A
11.5
N/A
N/A
22.4
0.010
N/A
N/A
29.0
13.2
11.8
3.0
4.2
2007
103
111
0.69
N/A
13.1
N/A
N/A
23.6
0.011
N/A
N/A
32.6
14.9
12.7
3.6
4.8
2006
95
68
0.59
N/A
14.5
N/A
N/A
20.2
0.009
N/A
N/A
32.1
14.5
N/A
3.6
4.3
2005
121
84
0.65
N/A
15.2
N/A
N/A
22.7
0.014
N/A
N/A
32.0
18.0
N/A
4.3
4.7
2004
104
71
0.62
N/A
15.8
N/A
N/A
19.8
0.010
N/A
N/A
32.8
15.1
N/A
4.6
4.5
2003
113
80
0.67
N/A
16.6
N/A
N/A
20.2
0.010
N/A
N/A
31.8
15.8
N/A
4.2
4.0
2002
125
90
0.76
N/A
17.4
N/A
N/A
21.2
0.009
N/A
N/A
37.1
16.8
N/A
3.9
4.6
2001
105
85
0.81
N/A
16.6
N/A
N/A
20.6
0.031
N/A
N/A
37.8
16.3
N/A
3.8
5.4
2000
98
64
0.87
N/A
17.3
N/A
N/A
19.4
N/A
N/A
N/A
N/A
N/A
N/A
4.5
4.2
Natural disasters
Type
Indianapolis
Aurora
Tornado activity compared to U.S. average
226.7%
153.1%
Earthquake activity compared to U.S. average
179.6%
154.4%
Natural disasters compared to U.S. average
16%
15%
Transportation
Both cities offer comprehensive public transit systems. Indianapolis's IndyGo bus system and Aurora's Pace Bus services make commuting around the city convenient. Indianapolis also has a bike-share program, while Aurora offers Metra's commuter rail service for effortless commuting to downtown Chicago.
Transport
Type
Indianapolis
Aurora
Amtrak stations
1
0
Amtrak stations nearby
1
3
FAA registered aircraft
739
30
FAA registered aircraft manufacturers and dealers
18
0
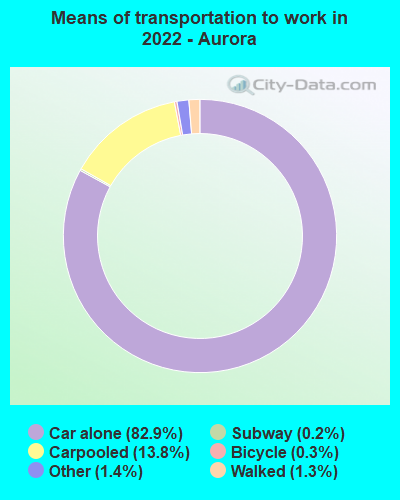
Means of transportation to work
Type
Indianapolis
Aurora
Bicycle
0.5%
0.2%
Bus
1.2%
0.3%
Carpooled
8.5%
11%
Car alone
87.3%
85.1%
Motorcycle
0%
0.1%
Subway
0%
0.3%
Walked
1.6%
1.8%
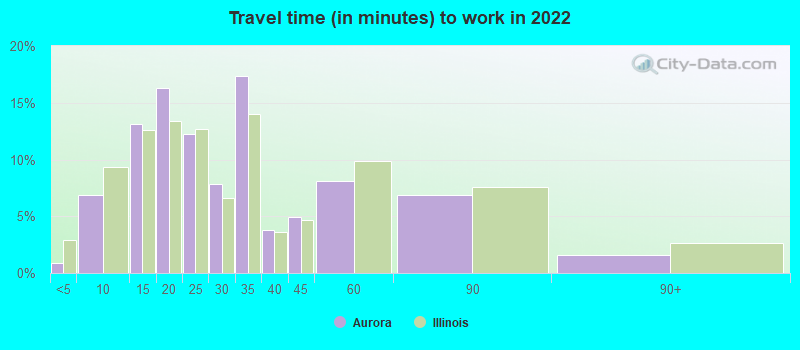
Average travel time to work
Type
Indianapolis
Aurora
Average
28.1 min
27 min
Other means
22.5 min
28.1 min
Public transportation
40.2 min
61.4 min
Private vehicle occupancy
Type
Indianapolis
Aurora
Average
1.2
1.3
Drove alone
88.2%
86.1%
In 2 person carpool
9.4%
9.7%
In 3 person carpool
1.3%
0.6%
In 4 person carpool
0.5%
1%
In 5-6 person carpool
0.4%
2.5%
In 7+ person carpool
0.1%
0%
How many people usually rode to work in the car, truck or van.
Real Estate
The housing market in Aurora tends to be more expensive than Indianapolis. Indianapolis' real estate market is attractive to investors due to low property costs and high rental yields.
Neighborhoods
Indianapolis is known for its friendly neighborhoods like Downtown, Broad Ripple Village, and Lockerbie Square. Similarly, Aurora is admired for its diverse and charming neighborhoods such as Paramount Theatre and Riddle Highlands.
Houses and residents
Type
Indianapolis
Aurora
Houses
399,820
64,677
Average household size (people)
2.4
3.1
Median year apartment built
1977
1977
Median year house/condo built
1971
1990
Length of stay in the house since moving in
13 years
13.1 years
Houses occupied
358,150 (89.6%)
62,379 (96.4%)
Houses occupied by owners
201,149 (56.2%)
43,361 (69.5%)
Houses occupied by renters
157,001 (43.8%)
19,018 (30.5%)
Median rent asked for vacant for-rent units
$876.58
$1,534
Median monthly housing costs
$980
$1,408
Median price asked for vacant for-sale houses and condos
$283,027
$92,244
Estimated median house or condo value
$188,700
$232,400
Median numbers of rooms
5.5
5.7
Median number of rooms in apartments
4.3
4.3
Median number of rooms in houses and condos
6.5
6.4
Median house price - detached houses
$231,490
$255,964
Median house price - in 2-unit structures
$257,253
$145,729
Median house price - in 3-to-4-unit structures
$240,688
$141,854
Median house price - in 5 or more unit structures
$247,275
$103,693
Median house price - mobile homes
$58,413
$317,080
Median house price - Townhouses or other attached units
$222,424
$202,183
Median house price - All housing units
$229,666
$240,490
Median house age
48
34
Renting percentage
44.2%
30.4%
Housing density (houses/condos per square mile)
1,106.1
1,678.8
House value disparities
36.1%
26.4%
Household income disparities
44.4%
40.1%
Median household income for houses/condes with a mortgage
$86,008
$112,817
Median household income for apartments without a mortgage
$61,922
$76,448
Housing units without a mortgage
4,552 (3.2%)
296 (1%)
Housing units with both a second mortgage and home equity loan
9,787 (6.8%)
1,148 (3.8%)
Housing units with a mortgage
138,622 (96.8%)
30,127 (99%)
Housing units with a home equity loan
271 (0.2%)
0 (0%)
Housing units with a second mortgage
12,987 (9.1%)
1,552 (5.1%)
House/condo owner moved in on average (years ago)
11
11
House/condo renter moved in on average (years ago)
1
1
Housing units lacking complete kitchen facilities
3.4%
1.3%
Housing units lacking complete plumbing facilities
1.1%
0.5%
Housing units in structures
Housing units in structures
Indianapolis
Aurora
One, detached
59.0%
59.3%
One, attached
9.2%
16.8%
Two
2.5%
3.6%
3 or 4
6.2%
3.4%
5 to 9
7.7%
3.5%
10 to 19
6.3%
6.0%
20 to 49
3.1%
2.2%
50 or more
5.0%
4.8%
Mobile homes
1.0%
0.3%
Median real estate property taxes paid for housing units
Self-employed workers in own not incorporated business
17,131
3,558
State government workers
15,502
1,410
Unpaid family workers
1,601
54
Industries and Occupations
Indianapolis has a broad industry base, including health care, education, finance, and tourism. Conversely, Aurora's major industries are manufacturing, health care, and education. It's also recognized as the second-largest city in Illinois.
Both cities have access to quality healthcare. Indianapolis is home to top-rated health institutions like Indiana University Health and Riley Children's Hospital. Aurora provides notable healthcare services through facilities such as the Rush-Copley Medical Center and Provena Mercy Medical Center.
Health (county statistics)
Type
Indianapolis
Aurora
General health status score of residents in this county from 1 (poor) to 5 (excellent)
Indianapolis is well-planned, featuring modern architecture and infrastructures such as The Indianapolis Cultural Trail. Aurora's infrastructure also reflects a blend of modern and historic architecture, with the city constantly investing in infrastructure improvements.
Infrastructure
Type
Indianapolis
Aurora
Hospitals
76
5
TV stations
19
27
Bank branches located here
259
45
Bank institutions located here
27
19
Main business address for public companies
28
3
Drinking water stations with no reported violations in the past
1
4
Drinking water stations with reported violations in the past
HMDA - Conventional home purchase loans - Applications denied
Year
Indianapolis
Aurora
1999
3,358
182
2000
3,562
240
2001
2,649
182
2002
1,915
191
2003
2,519
363
2004
3,702
683
2005
6,057
1,038
2006
5,811
1,182
2007
3,456
627
2008
1,247
211
2009
565
89
Culture and Food
Indianapolis offers a medley of American midwestern food experiences and an encaptivating culture with its wide range of museums and music festivals. Aurora is known for its rich cultural diversity, offers a variety of cuisines, and is home to the Aurora Regional Fire Museum and Paramount Theatre.
Sports Teams
Indianapolis has an edge, being home to two major league sports teams, the Indianapolis Colts (NFL) and the Indiana Pacers (NBA). However, sports fans in Aurora are not left out, the city being the hometown of several minor league and semi-pro sporting teams.


 Indianapolis, IN and
  Aurora, IL : 176.5 miles