Cleveland, Ohio, and Indianapolis, Indiana, both have unique pros and cons for residents and tourists alike. Comparative analysis between these two cities is based on various components, comprising crime and safety, weather, cost of living, education, work and economy, infrastructure, and other relevant factors. From social life to employment opportunities, these factors play a role in shaping the quality of life in these cities. This comprehensive comparison will help clarify what to expect when considering a visit or permanent relocation.
Distance between
Indianapolis, IN and
Cleveland, OH : 262.2 miles
Indianapolis's population is larger by 140%. Its population has grown by 100,169 people (12.8%) since 2000. The population of Cleveland has decreased by 110,412 people (23.1%) during that time.
When it comes to crime rates, both Indianapolis and Cleveland tend to have higher rates compared to the national average. However, just like any other city, the crime rate can vary considerably between different neighborhoods. Cleveland has been focusing on enhancing its law enforcement efforts, and Indianapolis is working on improving its community engagement to prevent crime. Both cities are striving to improve their safety record.
City-data.com crime index counts serious crimes and violent crime more heavily. It adjusts for the number of visitors and daily workers commuting into cities. (higher means more crime, U.S. average = 301.1)
City-data.com crime index counts serious crimes and violent crime more heavily. It adjusts for the number of visitors and daily workers commuting into cities. (higher means more crime, U.S. average = 301.1)
Sex Offenders
According to our data, there are 82 registered sex offenders living in Indianapolis and 1,976 registered sex offenders living in . The ratio of residents to sex offenders in Indianapolis is 10,396 to 1; the ratio in Cleveland is 195 to 1. The number of registered sex offenders compared to the number of residents is a lot smaller in Indianapolis than in Cleveland.
Cost of Living
The cost of living in Indianapolis is somewhat lower than in Cleveland. This difference incorporates housing costs, groceries, transportation, and utility prices. Indianapolis' lower cost of living factor can be appealing to those considering relocation or long-term stays.
Income Tax
Both Indiana and Ohio have state income taxes, with Ohio's being slightly higher. Additionally, Cleveland imposes a city income tax, while Indianapolis does not have a separate city income tax.
Property Tax
In terms of property taxes, Indiana’s rates are generally lower than Ohio’s. This results in a lower overall property tax burden for homeowners in Indianapolis compared to those in Cleveland.
Sales Tax
Indiana's state sales tax, affecting Indianapolis, stands at 7 percent, while Ohio's, impacting Cleveland, is at 5.75 percent. However, Cleveland has an additional city sales tax which varies depending on the purchase.
Income
Type
Indianapolis
Cleveland
Estimated median household income
$58,479
$35,562
Estimated per capita income
$32,792
$24,093
Cost of living index (U.S. average is 100)
87.7
94.3
If you make $50,000 in Indianapolis, you will have to make $53,763 in Cleveland to maintain the same standard of living.
Geographical Conditions
Geographically, Indianapolis is primarily flat, situated just above sea level, making it ideal for activities like biking. Cleveland, on the other hand, sits on the southern shore of Lake Erie, offering beautiful lakeside views and beach opportunities.
Both Indianapolis and Cleveland have various educational opportunities, with a mix of public, private, and charter schools. However, Cleveland's higher education spectrum includes more internationally recognized institutions, such as Case Western Reserve University.
Cleveland boasts a diverse economy with sectors such as manufacturing, healthcare, and financial services, while Indianapolis has a robust economy centered around healthcare, education, and manufacturing industries. The unemployment rates are relatively similar, with recent years demonstrating positive job growth in both cities.
Biggest Employers
The largest employers in Cleveland include healthcare providers like Cleveland Clinic and University Hospitals. In contrast, in Indianapolis, Indiana University Health and Purdue University are among the biggest employers.
There were 1,221 building permits issued in Indianapolis in 2012 (704 more than in 2011) compared to 104 building permits issued in Cleveland in 2012 (18 more than in 2011).
In Indianapolis (Marion County), 60.1% voted for Democrats and 37.9% for Republicans in 2012 Presidential Election. In Cleveland (Cuyahoga County), 69.7% voted for Democrats and 29.7% for Republicans.
Elections
Type
Democrats
Republicans
Other
Year
Indianapolis
Cleveland
Indianapolis
Cleveland
Indianapolis
Cleveland
2020
63.7%
66.5%
34.5%
32.4%
1.9%
1.1%
2016
58.2%
65.5%
35.6%
30.3%
6.2%
4.1%
2012
60.1%
69.7%
37.9%
29.7%
2.0%
0.5%
2008
63.8%
69.1%
35.4%
30.1%
0.8%
0.8%
2004
50.6%
66.6%
48.7%
32.9%
0.7%
0.5%
2000
48.0%
62.9%
49.3%
33.6%
2.8%
3.5%
1996
44.6%
60.8%
47.8%
29.1%
7.7%
10.1%
Breakdown of population affiliated with a religious congregation
Type
Adherents
Congregations
Religion
Indianapolis
Cleveland
Indianapolis
Cleveland
CATHOLIC CHURCH
11.1%
28.6%
4.6%
11.3%
SOUTHERN BAPTIST CONVENTION
1.6%
0.4%
5.7%
3.0%
AMERICAN BAPTIST CHURCHES IN THE USA
1.2%
1.6%
3.4%
3.2%
LUTHERAN CHURCH
0.8%
1.4%
1.5%
4.0%
EVANGELICAL LUTHERAN CHURCH IN AMERICA
0.5%
1.1%
1.6%
3.9%
SEVENTH DAY ADVENTIST CHURCH
0.5%
0.4%
1.6%
1.6%
EPISCOPAL CHURCH
0.4%
0.6%
1.1%
2.2%
Weather
Weather-wise, both cities experience the four seasons. The summer in Indianapolis is warmer and more humid compared to Cleveland, whose proximity to Lake Erie provides a cool breeze. Winter in Cleveland tends to be colder with more snowfall compared to Indianapolis.
Weather and climate
Type
Indianapolis
Cleveland
Temperature - Average
52.1°F
50.1°F
Humidity - Average morning or afternoon humidity
77%
75.8%
Humidity - Differences between morning and afternoon humidity
31%
27%
Humidity - Maximum monthly morning or afternoon humidity
86%
83%
Humidity - Minimum monthly morning or afternoon humidity
55%
56%
Precipitation - Yearly average
40.6 in
38.5 in
Snowfall - Yearly average
51 in
115.9 in
Clouds - Number of days clear of clouds
14.7%
11.2%
Sunshine amount - Average
56.2%
51.8%
Sunshine amount - Differences during a year
33%
44%
Sunshine amount - Maximum monthly
65%
66%
Sunshine amount - Minimum monthly
32%
22%
Wind speed - Average
10.3 mph
10.4 mph
Average climate in Indianapolis, Indiana
Average climate in Cleveland, Ohio
Air pollution
Type
AQI
CO
NO2
OZONE
PB
PM10
PM25
SO2
Year
Indianapolis
Cleveland
Indianapolis
Cleveland
Indianapolis
Cleveland
Indianapolis
Cleveland
Indianapolis
Indianapolis
Cleveland
Indianapolis
Cleveland
Indianapolis
Cleveland
2018
94
85
0.58
0.26
13.2
11.3
23.1
26.9
N/A
N/A
18.2
22.7
10.4
9.3
0.3
0.6
2017
87
82
0.82
0.27
12.4
11.4
23.0
27.6
N/A
N/A
17.6
23.2
10.1
8.2
0.4
0.5
2016
91
81
0.62
0.27
13.0
11.1
22.5
27.1
N/A
N/A
18.0
23.4
9.9
9.9
0.4
1.0
2015
89
76
0.73
0.27
14.9
12.9
22.9
25.1
N/A
N/A
19.7
31.5
9.9
8.0
1.1
1.9
2014
100
83
0.62
0.25
16.1
12.3
25.1
23.7
N/A
N/A
20.6
28.4
12.1
10.6
3.2
1.7
2013
94
88
0.69
0.24
11.5
12.9
26.3
23.8
N/A
N/A
19.9
27.3
12.8
12.0
2.6
1.9
2012
103
119
0.65
0.28
10.4
13.7
25.7
26.5
N/A
N/A
20.8
32.0
12.9
15.2
2.9
2.5
2011
105
110
0.68
0.29
11.3
15.3
22.9
25.8
N/A
N/A
N/A
29.7
16.3
16.1
2.4
3.4
2010
101
113
0.54
0.35
12.7
15.8
21.6
27.0
N/A
N/A
N/A
24.2
15.9
18.7
3.3
3.6
2009
97
67
0.73
0.37
11.4
17.1
23.2
26.0
N/A
N/A
N/A
21.5
13.8
N/A
1.9
3.7
2008
91
87
0.62
0.29
11.5
15.2
N/A
32.9
0.010
N/A
N/A
27.1
13.2
N/A
3.0
4.2
2007
103
94
0.69
0.29
13.1
18.1
N/A
32.9
0.011
N/A
N/A
30.3
14.9
N/A
3.6
5.2
2006
95
75
0.59
0.25
14.5
16.2
N/A
27.7
0.009
N/A
N/A
27.3
14.5
N/A
3.6
5.0
2005
121
98
0.65
0.27
15.2
19.2
N/A
28.6
0.014
N/A
N/A
31.7
18.0
N/A
4.3
5.7
2004
104
77
0.62
0.47
15.8
19.5
N/A
20.1
0.010
N/A
N/A
29.2
15.1
N/A
4.6
3.8
2003
113
81
0.67
0.49
16.6
19.6
N/A
25.8
0.010
N/A
N/A
28.3
15.8
N/A
4.2
5.7
2002
125
95
0.76
0.40
17.4
19.8
N/A
28.6
0.009
N/A
N/A
32.5
16.8
N/A
3.9
5.1
2001
105
91
0.81
0.43
16.6
21.1
N/A
28.4
0.031
N/A
N/A
35.9
16.3
N/A
3.8
5.9
2000
98
79
0.87
0.48
17.3
20.5
N/A
25.2
N/A
N/A
N/A
35.9
N/A
N/A
4.5
5.8
Natural disasters
Type
Indianapolis
Cleveland
Tornado activity compared to U.S. average
226.7%
93%
Earthquake activity compared to U.S. average
179.6%
50.2%
Natural disasters compared to U.S. average
16%
16%
Transportation
Cleveland offers superior public transportation compared to Indianapolis. The Greater Cleveland Regional Transit Authority operates a network of buses, trolleys, and trains while Indianapolis mainly relies on bus service provided by IndyGo.
Transport
Type
Indianapolis
Cleveland
Amtrak stations
1
1
Amtrak stations nearby
1
1
FAA registered aircraft
739
307
FAA registered aircraft manufacturers and dealers
18
19
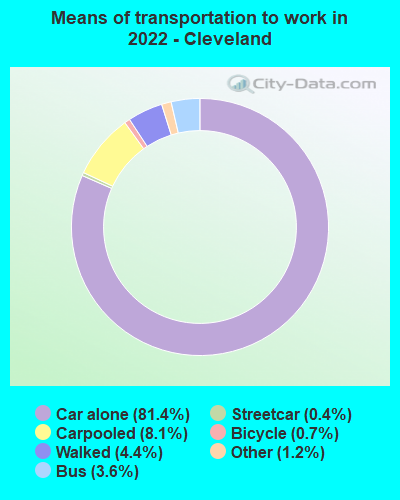
Means of transportation to work
Type
Indianapolis
Cleveland
Bicycle
0.5%
0.2%
Bus
1.2%
3.5%
Carpooled
8.5%
7.7%
Car alone
87.3%
83.1%
Railroad
0%
0.1%
Streetcar
0%
0.4%
Taxicab
0.1%
0.1%
Walked
1.6%
3.9%
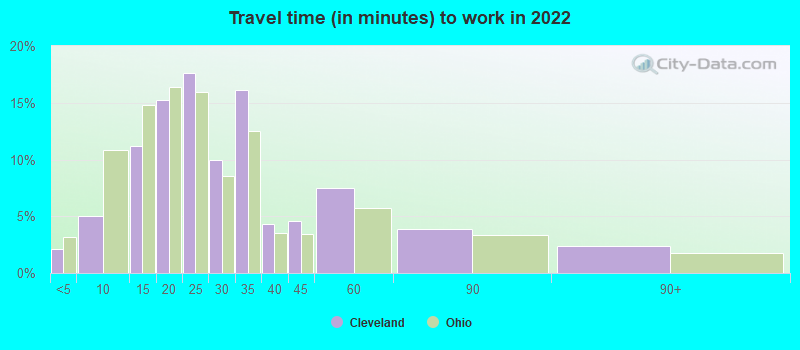
Average travel time to work
Type
Indianapolis
Cleveland
Average
28.1 min
28.9 min
Other means
22.5 min
23.2 min
Public transportation
40.2 min
42.9 min
Private vehicle occupancy
Type
Indianapolis
Cleveland
Average
1.2
1.2
Drove alone
88.2%
87.9%
In 2 person carpool
9.4%
10.3%
In 3 person carpool
1.3%
1%
In 4 person carpool
0.5%
0.4%
In 5-6 person carpool
0.4%
0.1%
In 7+ person carpool
0.1%
0.3%
How many people usually rode to work in the car, truck or van.
Real Estate
In terms of real estate, Indianapolis is generally cheaper than Cleveland. This can be reflected in housing prices and rental prices, making Indianapolis an attractive city for real estate investments.
Neighborhoods
Both cities boast diverse neighborhoods. Indianapolis is known for areas like Broad Ripple Village, known for its vibrant nightlife, and Cleveland has neighborhoods like Tremont, famous for its historic charm and fantastic eateries.
Houses and residents
Type
Indianapolis
Cleveland
Houses
399,820
202,735
Average household size (people)
2.4
2.3
Median year apartment built
1977
1946
Length of stay in the house since moving in
13 years
17.5 years
Houses occupied
358,150 (89.6%)
171,321 (84.5%)
Houses occupied by owners
201,149 (56.2%)
67,039 (39.1%)
Houses occupied by renters
157,001 (43.8%)
104,282 (60.9%)
Median rent asked for vacant for-rent units
$876.58
$1,284
Median monthly housing costs
$980
$754
Median price asked for vacant for-sale houses and condos
$283,027
$86,306
Estimated median house or condo value
$188,700
$83,400
Median numbers of rooms
5.5
5.2
Median number of rooms in apartments
4.3
4.4
Median number of rooms in houses and condos
6.5
6.3
Median house price - detached houses
$231,490
$104,861
Median house price - in 2-unit structures
$257,253
$81,957
Median house price - in 3-to-4-unit structures
$240,688
$250,787
Median house price - in 5 or more unit structures
$247,275
$156,467
Median house price - mobile homes
$58,413
$40,340
Median house price - Townhouses or other attached units
$222,424
$125,938
Median house price - All housing units
$229,666
$105,403
Median house age
48
80
Renting percentage
44.2%
55.9%
Housing density (houses/condos per square mile)
1,106.1
2,613.2
House value disparities
36.1%
41.6%
Household income disparities
44.4%
48.5%
Median household income for houses/condes with a mortgage
$86,008
$61,885
Median household income for apartments without a mortgage
$61,922
$42,551
Housing units without a mortgage
4,552 (3.2%)
2,325 (6.3%)
Housing units with both a second mortgage and home equity loan
9,787 (6.8%)
2,348 (6.4%)
Housing units with a mortgage
138,622 (96.8%)
34,401 (93.7%)
Housing units with a home equity loan
271 (0.2%)
166 (0.5%)
Housing units with a second mortgage
12,987 (9.1%)
3,335 (9.1%)
House/condo owner moved in on average (years ago)
11
19
House/condo renter moved in on average (years ago)
1
3
Housing units lacking complete kitchen facilities
3.4%
8.8%
Housing units lacking complete plumbing facilities
1.1%
5.1%
Housing units in structures
Housing units in structures
Indianapolis
Cleveland
One, detached
59.0%
48.7%
One, attached
9.2%
5.6%
Two
2.5%
14.7%
3 or 4
6.2%
5.2%
5 to 9
7.7%
5.0%
10 to 19
6.3%
3.8%
20 to 49
3.1%
3.3%
50 or more
5.0%
13.1%
Mobile homes
1.0%
0.4%
Boats, RVs, vans, etc.
0.0%
0.1%
Median real estate property taxes paid for housing units
Self-employed workers in own not incorporated business
17,131
7,246
State government workers
15,502
2,212
Unpaid family workers
1,601
328
Industries and Occupations
Cleveland's economy is known for its healthcare, biomedicine, and manufacturing industries, with potential job opportunities within these fields. Indianapolis, on the other hand, has a thriving healthcare and education sector, aside from having a strong auto racing industry.
Both cities are robust in terms of healthcare facilities. Cleveland is recognized worldwide for the Cleveland Clinic, known for its top-notch healthcare services. Indianapolis also offers excellent healthcare, featuring the renowned Indiana University Health.
Health (county statistics)
Type
Indianapolis
Cleveland
General health status score of residents in this county from 1 (poor) to 5 (excellent)
Infrastructure-wise, both cities have well-developed road networks, airports, and public buildings. Cleveland edges out Indianapolis with a slight advantage in terms of public transportation availability and infrastructure.
Infrastructure
Type
Indianapolis
Cleveland
Hospitals
76
30
TV stations
19
16
Arenas or stadiums
3
4
Bank branches located here
259
116
Bank institutions located here
27
17
Main business address for public companies
28
31
Drinking water stations with no reported violations in the past
1
1
Drinking water stations with reported violations in the past
HMDA - Conventional home purchase loans - Applications denied
Year
Indianapolis
Cleveland
1999
3,358
1,871
2000
3,562
2,587
2001
2,649
2,077
2002
1,915
1,561
2003
2,519
1,242
2004
3,702
1,561
2005
6,057
3,297
2006
5,811
3,951
2007
3,456
2,211
2008
1,247
482
2009
565
184
Culture and Food
In terms of culture and food, both Indianapolis and Cleveland have plenty to offer. Indy is known for its barbecue and comfort food, while Cleveland is famous for its Eastern European and Italian influences. Both cities boast vibrant, diverse cultural scenes with myriad festivals, museums, and live performances.
Sports Teams
Both Indianapolis and Cleveland are home to various professional sports teams. Indianapolis houses the Colts (NFL), the Pacers (NBA), and the Fever (WNBA), while in Cleveland, you will find the Browns (NFL), the Cavaliers (NBA), and the Guardians (MLB).


 Indianapolis, IN and
  Cleveland, OH : 262.2 miles