Indianapolis, IN and Lexington-Fayette, KY, both offer appealing qualities for relocation or tourism, though they cater to different preferences. Indianapolis, being larger and more metropolitan, is attractive to those seeking economic opportunities, vibrant city life, and diverse food and culture. On the other hand, Lexington, known as the “Horse Capital of the World,” offers a charm mixing urban and rural elements, making it a perfect choice for those who appreciate a relaxed pace but still want enjoy city benefits. Understanding the specifics of each city, from crime and safety to education and economy, can help discern which locality best fits one's needs and expectations.
Distance between
Indianapolis, IN and
Lexington-Fayette, KY : 150.7 miles
Indianapolis's population is larger by 174%. Its population has grown by 100,169 people (12.8%) since 2000. The population of Lexington-Fayette has grown by 61,281 people (23.5%) during that time.
Safety is always a top priority, and comparing Indianapolis to Lexington in terms of crime rates reveals rather contrasting pictures. Indianapolis, being larger, has a higher crime rate than the national average, although efforts for community policing are underway. Meanwhile, Lexington fares better in terms of crime, with rates lower than the national average, contributing to its reputation as a safe city for both residents and tourists.
Cost of Living
Compared to the national average, the cost of living in both Indianapolis and Lexington is lower. However, Indianapolis generally offers a lower cost of living when compared to Lexington. This is especially visible in housing costs, groceries, and healthcare, making it a favorable option for those looking for a more affordable city life.
Income Tax
Both Indiana and Kentucky have a progressive income tax system. Indianapolis residents will face an income tax rate of 3.23% while Lexington residents will be taxed at rates on a scale from 2% to 5%.
Property Tax
When weighting these cities in terms of property tax, Lexington generally has lower rates than Indianapolis. However, property is generally more affordable in Indianapolis, so the total annual payment may be comparable.
Sales Tax
Indiana’s state sales tax rate of 7% applies in Indianapolis, while in Lexington the state of Kentucky imposes a 6% sales tax. This slight difference contributes to the overall lower cost of living in Indianapolis.
Income
Type
Indianapolis
Lexington-Fayette
Estimated median household income
$58,479
$60,942
Estimated per capita income
$32,792
$37,011
Cost of living index (U.S. average is 100)
87.7
89.3
If you make $50,000 in Indianapolis, you will have to make $50,912 in Lexington-Fayette to maintain the same standard of living.
Geographical Conditions
Geographically, Indianapolis is rather flat, which lends itself to more biking and walking, while Lexington, situated in the Bluegrass region, is characterized by fertile soil and undulating hills, making it perfect for horse farming and offering attractive landscapes.
Both cities offer quality education opportunities. Indianapolis is home to several well-known institutions like Indiana University-Purdue University Indianapolis and Butler University. Lexington features the University of Kentucky and Transylvania University. Both cities also have sound public school systems.
While Indianapolis boasts a vibrant economy with strong sectors in healthcare, finance, and manufacturing, Lexington's economy leans more toward the public sector with University of Kentucky being the largest employer. Both cities, however, show promise in the technology sector, suggesting ample opportunities for future growth.
Biggest Employers
In Indianapolis, some of the biggest employers include Indiana University Health, St. Vincent Health, and Eli Lilly. Lexington, on the other hand, sees the University of Kentucky, Fayette County Public Schools, and Lexmark International as its biggest employers.
There were 1,221 building permits issued in Indianapolis in 2012 (704 more than in 2011) compared to 792 building permits issued in Lexington-Fayette in 2012 (279 more than in 2011).
In Indianapolis (Marion County), 60.1% voted for Democrats and 37.9% for Republicans in 2012 Presidential Election. In Lexington-Fayette (Fayette County), 49.3% voted for Democrats and 48.3% for Republicans.
Elections
Type
Democrats
Republicans
Other
Year
Indianapolis
Lexington-Fayette
Indianapolis
Lexington-Fayette
Indianapolis
Lexington-Fayette
2020
63.7%
59.4%
34.5%
38.6%
1.9%
1.9%
2016
58.2%
51.3%
35.6%
41.8%
6.2%
6.9%
2012
60.1%
49.3%
37.9%
48.3%
2.0%
2.3%
2008
63.8%
51.7%
35.4%
46.9%
0.8%
1.3%
2004
50.6%
46.3%
48.7%
53.1%
0.7%
0.6%
2000
48.0%
45.0%
49.3%
51.8%
2.8%
3.2%
1996
44.6%
47.1%
47.8%
46.3%
7.7%
6.6%
Breakdown of population affiliated with a religious congregation
Type
Adherents
Congregations
Religion
Indianapolis
Lexington-Fayette
Indianapolis
Lexington-Fayette
CATHOLIC CHURCH
11.1%
8.8%
4.6%
3.0%
SOUTHERN BAPTIST CONVENTION
1.6%
13.7%
5.7%
19.5%
AMERICAN BAPTIST CHURCHES IN THE USA
1.2%
0.0%
3.4%
0.0%
LUTHERAN CHURCH
0.8%
0.3%
1.5%
1.1%
EVANGELICAL LUTHERAN CHURCH IN AMERICA
0.5%
0.4%
1.6%
1.1%
SEVENTH DAY ADVENTIST CHURCH
0.5%
0.3%
1.6%
1.5%
EPISCOPAL CHURCH
0.4%
0.9%
1.1%
2.3%
PRESBYTERIAN CHURCH IN AMERICA
0.1%
0.3%
0.5%
0.8%
VINEYARD USA
0.1%
0.4%
0.3%
0.4%
Weather
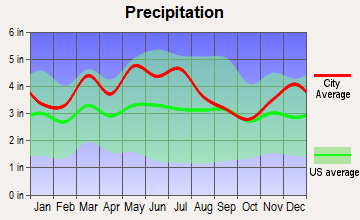
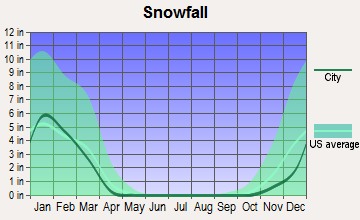
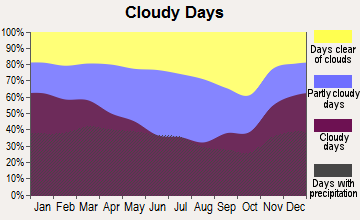
The weather in both Indianapolis and Lexington is similar; both cities experience a humid continental climate with hot, humid summers and cold winters. However, Indianapolis can experience slightly more snow during winter. Lexington typically has milder winters, but precipitation is more evenly distributed throughout the year.
Weather and climate
Type
Indianapolis
Lexington-Fayette
Temperature - Average
52.1°F
55.3°F
Humidity - Average morning or afternoon humidity
77%
75.8%
Humidity - Differences between morning and afternoon humidity
31%
31%
Humidity - Maximum monthly morning or afternoon humidity
86%
85%
Humidity - Minimum monthly morning or afternoon humidity
55%
54%
Precipitation - Yearly average
40.6 in
45.9 in
Snowfall - Yearly average
51 in
35.2 in
Clouds - Number of days clear of clouds
14.7%
14.9%
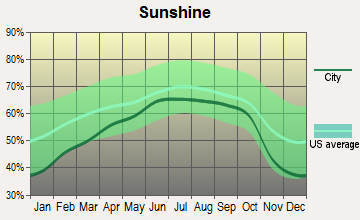
Sunshine amount - Average
56.2%
59.9%
Sunshine amount - Differences during a year
33%
25.5%
Sunshine amount - Maximum monthly
65%
66.2%
Sunshine amount - Minimum monthly
32%
40.7%
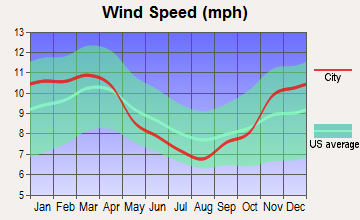
Wind speed - Average
10.3 mph
8.6 mph
Average climate in Indianapolis, Indiana
Average climate in Lexington-Fayette, Kentucky
Air pollution
Type
AQI
CO
NO2
OZONE
PB
PM10
PM25
SO2
Year
Indianapolis
Lexington-Fayette
Indianapolis
Lexington-Fayette
Indianapolis
Lexington-Fayette
Indianapolis
Lexington-Fayette
Indianapolis
Indianapolis
Indianapolis
Lexington-Fayette
Indianapolis
Lexington-Fayette
2018
94
63
0.58
N/A
13.2
3.1
23.1
31.6
N/A
N/A
18.2
N/A
10.4
9.7
0.3
0.1
2017
87
64
0.82
N/A
12.4
4.9
23.0
32.1
N/A
N/A
17.6
N/A
10.1
7.2
0.4
0.1
2016
91
68
0.62
N/A
13.0
6.6
22.5
33.3
N/A
N/A
18.0
N/A
9.9
6.9
0.4
0.1
2015
89
71
0.73
N/A
14.9
6.7
22.9
31.4
N/A
N/A
19.7
N/A
9.9
7.3
1.1
0.1
2014
100
68
0.62
N/A
16.1
6.8
25.1
34.1
N/A
N/A
20.6
N/A
12.1
7.6
3.2
0.3
2013
94
69
0.69
N/A
11.5
7.3
26.3
31.7
N/A
N/A
19.9
N/A
12.8
10.0
2.6
0.2
2012
103
81
0.65
N/A
10.4
8.1
25.7
34.9
N/A
N/A
20.8
N/A
12.9
10.6
2.9
0.8
2011
105
78
0.68
N/A
11.3
8.3
22.9
34.6
N/A
N/A
N/A
N/A
16.3
11.3
2.4
2.1
2010
101
76
0.54
N/A
12.7
9.5
21.6
34.9
N/A
N/A
N/A
N/A
15.9
10.0
3.3
2.2
2009
97
75
0.73
N/A
11.4
8.5
23.2
31.1
N/A
N/A
N/A
N/A
13.8
9.2
1.9
2.7
2008
91
72
0.62
N/A
11.5
7.8
N/A
36.4
0.010
N/A
N/A
N/A
13.2
9.1
3.0
2.4
2007
103
92
0.69
N/A
13.1
10.9
N/A
37.9
0.011
N/A
N/A
N/A
14.9
12.9
3.6
4.0
2006
95
65
0.59
N/A
14.5
11.8
N/A
32.8
0.009
N/A
N/A
N/A
14.5
N/A
3.6
3.8
2005
121
77
0.65
N/A
15.2
12.1
N/A
34.0
0.014
N/A
N/A
N/A
18.0
N/A
4.3
4.4
2004
104
60
0.62
N/A
15.8
11.6
N/A
28.6
0.010
N/A
N/A
N/A
15.1
N/A
4.6
3.2
2003
113
67
0.67
N/A
16.6
12.2
N/A
30.3
0.010
N/A
N/A
N/A
15.8
N/A
4.2
3.5
2002
125
76
0.76
0.04
17.4
12.1
N/A
31.3
0.009
N/A
N/A
N/A
16.8
N/A
3.9
3.6
2001
105
69
0.81
0.07
16.6
13.2
N/A
30.9
0.031
N/A
N/A
N/A
16.3
N/A
3.8
4.4
2000
98
79
0.87
0.14
17.3
13.4
N/A
32.7
N/A
N/A
N/A
N/A
N/A
N/A
4.5
5.0
Natural disasters
Type
Indianapolis
Lexington-Fayette
Tornado activity compared to U.S. average
226.7%
126.8%
Earthquake activity compared to U.S. average
179.6%
171.6%
Natural disasters compared to U.S. average
16%
14%
Transportation
Both cities provide multiple public transit options. Indianapolis is served by IndyGo, offering citywide bus services, while Lexington relies on Lextran. Both cities also offer bike-friendly paths, although Indianapolis' geographic flatness makes it more amenable for biking.
Transport
Type
Indianapolis
Lexington-Fayette
Amtrak stations
1
0
Amtrak stations nearby
1
0
FAA registered aircraft
739
0
FAA registered aircraft manufacturers and dealers
18
0
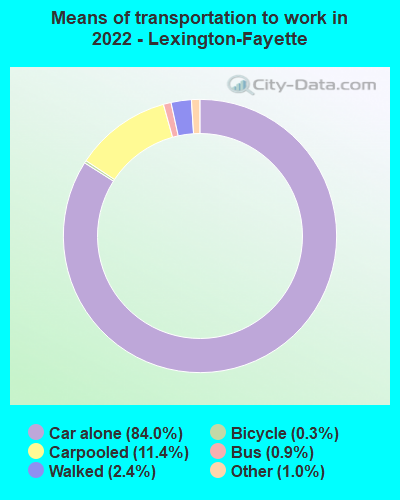
Means of transportation to work
Type
Indianapolis
Lexington-Fayette
Bicycle
0.5%
0.6%
Bus
1.2%
1.2%
Carpooled
8.5%
8.3%
Car alone
87.3%
86.5%
Taxicab
0.1%
0.1%
Walked
1.6%
2.6%
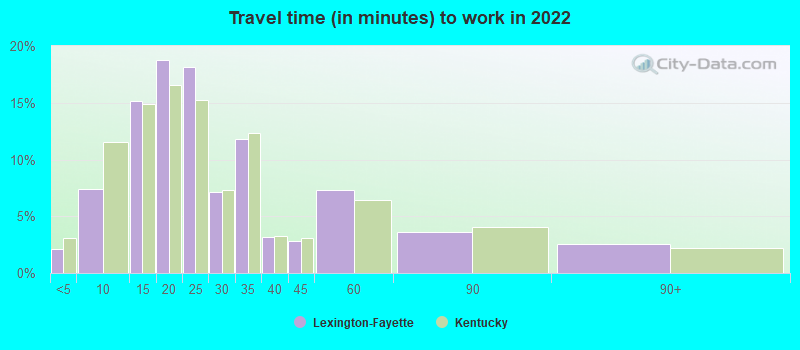
Average travel time to work
Type
Indianapolis
Lexington-Fayette
Average
28.1 min
26.5 min
Other means
22.5 min
20.2 min
Public transportation
40.2 min
35 min
Private vehicle occupancy
Type
Indianapolis
Lexington-Fayette
Average
1.2
1.1
Drove alone
88.2%
90.6%
In 2 person carpool
9.4%
7.7%
In 3 person carpool
1.3%
1.2%
In 4 person carpool
0.5%
0.3%
In 5-6 person carpool
0.4%
0.1%
In 7+ person carpool
0.1%
0.1%
How many people usually rode to work in the car, truck or van.
Real Estate
The real estate market in both cities provides favorable conditions for buyers with Indianapolis being slightly more affordable. Both cities offer a mix of urban and suburban living options depending on individual preferences.
Neighborhoods
Indianapolis is known for its vibrant neighborhoods, each with its own unique character. From the cultural hubs of Fountain Square and Mass Ave to the family-friendly regions of Meridian Kessler or Carmel, there's a neighborhood for everyone. Lexington also offers diverse neighborhoods, from the historic charm of Fayette Park to the urban vibe of downtown.
Houses and residents
Type
Indianapolis
Lexington-Fayette
Houses
399,820
147,590
Average household size (people)
2.4
2.3
Median year apartment built
1977
1983
Median year house/condo built
1971
1985
Length of stay in the house since moving in
13 years
12 years
Houses occupied
358,150 (89.6%)
139,303 (94.4%)
Houses occupied by owners
201,149 (56.2%)
75,129 (53.9%)
Houses occupied by renters
157,001 (43.8%)
64,174 (46.1%)
Median rent asked for vacant for-rent units
$876.58
$1,514
Median monthly housing costs
$980
$1,026
Median price asked for vacant for-sale houses and condos
$283,027
$229,178
Estimated median house or condo value
$188,700
$242,400
Median numbers of rooms
5.5
5.4
Median number of rooms in apartments
4.3
4
Median number of rooms in houses and condos
6.5
7
Median house price - detached houses
$231,490
$300,664
Median house price - in 2-unit structures
$257,253
$297,942
Median house price - in 3-to-4-unit structures
$240,688
$165,223
Median house price - in 5 or more unit structures
$247,275
$179,160
Median house price - mobile homes
$58,413
$37,529
Median house price - Townhouses or other attached units
$222,424
$232,720
Median house price - All housing units
$229,666
$289,099
Median house age
48
37
Renting percentage
44.2%
44.1%
Housing density (houses/condos per square mile)
1,106.1
518.7
House value disparities
36.1%
33%
Household income disparities
44.4%
46.3%
Median household income for houses/condes with a mortgage
$86,008
$95,171
Median household income for apartments without a mortgage
$61,922
$74,841
Housing units without a mortgage
4,552 (3.2%)
2,236 (4.2%)
Housing units with both a second mortgage and home equity loan
9,787 (6.8%)
6,457 (12.1%)
Housing units with a mortgage
138,622 (96.8%)
51,182 (95.8%)
Housing units with a home equity loan
271 (0.2%)
156 (0.3%)
Housing units with a second mortgage
12,987 (9.1%)
7,551 (14.1%)
House/condo owner moved in on average (years ago)
11
9
House/condo renter moved in on average (years ago)
1
1
Housing units lacking complete kitchen facilities
3.4%
1.3%
Housing units lacking complete plumbing facilities
1.1%
0.4%
Housing units in structures
Housing units in structures
Indianapolis
Lexington-Fayette
One, detached
59.0%
58.7%
One, attached
9.2%
6.4%
Two
2.5%
3.0%
3 or 4
6.2%
4.9%
5 to 9
7.7%
7.5%
10 to 19
6.3%
8.4%
20 to 49
3.1%
4.3%
50 or more
5.0%
5.6%
Mobile homes
1.0%
1.3%
Median real estate property taxes paid for housing units
Self-employed workers in own not incorporated business
17,131
9,814
State government workers
15,502
15,501
Unpaid family workers
1,601
346
Industries and Occupations
Indianapolis has a diverse economy with industries like healthcare, finance, and manufacturing leading the way. Lexington, being the “Horse Capital of the World”, thrives on equine industry, besides education and healthcare.
Both cities offer excellent healthcare facilities, but Indianapolis stands out, being home to top-rated hospitals and health research institutions like Indiana University Health and the Sidney & Lois Eskenazi Hospital. Lexington also provides quality healthcare, with the University of Kentucky HealthCare being a prominent player.
Health (county statistics)
Type
Indianapolis
Lexington-Fayette
General health status score of residents in this county from 1 (poor) to 5 (excellent)
Indianapolis, as a larger city, has more established infrastructure compared to Lexington. It has a wide range of public facilities, from libraries to parks. Lexington, though smaller, is catching up and continually improving its infrastructure.
HMDA - Conventional home purchase loans - Applications denied
Year
Indianapolis
Lexington-Fayette
1999
3,358
756
2000
3,562
655
2001
2,649
568
2002
1,915
463
2003
2,519
529
2004
3,702
777
2005
6,057
997
2006
5,811
751
2007
3,456
517
2008
1,247
325
2009
565
230
Culture and Food
Indianapolis offers a rich culinary scene, featuring everything from classic American fare to international cuisine, alongside an active performing arts scene. Lexington, while also offering diverse dining options, lays claim to a rich bourbon culture, along with a variety of festivals and events centered around horses and the famous Bluegrass music of Kentucky.
Sports Teams
Indianapolis is well-known for its sporting culture, boasting professional NFL and NBA teams, the Indianapolis Colts and Indiana Pacers, and famous for the Indianapolis 500. Lexington, while not hosting any major league sports teams, is home to the University of Kentucky Wildcats basketball team, a powerhouse in collegiate sports.


 Indianapolis, IN and
  Lexington-Fayette, KY : 150.7 miles