Indianapolis, the capital of Indiana, and Minneapolis, the largest city in Minnesota, offer distinct amenities and lifestyle options. Each city has its unique charm, ethos, and landscapes that attract residents and tourists alike. These range from sports, geography, and weather to job opportunities, safety, cost of living, healthcare, and cultural offerings. Determining the better city for relocation or visit ultimately depends on one's personal preferences and needed amenities.
Distance between
Indianapolis, IN and
Minneapolis, MN : 509.4 miles
Indianapolis's population is larger by 107%. Its population has grown by 100,169 people (12.8%) since 2000. The population of Minneapolis has grown by 42,718 people (11.2%) during that time.
In terms of overall crime rate, both Minneapolis and Indianapolis experience higher crime rates than the national average. However, crime rates vary by neighborhood within each city. Indianapolis has been focusing on investing in public safety and community building to reduce crime. Comparatively, Minneapolis has seen an increase in crime rates recently but many upstanding neighborhood communities have implemented robust neighborhood watch programs to mitigate this issue.
City-data.com crime index counts serious crimes and violent crime more heavily. It adjusts for the number of visitors and daily workers commuting into cities. (higher means more crime, U.S. average = 301.1)
City-data.com crime index counts serious crimes and violent crime more heavily. It adjusts for the number of visitors and daily workers commuting into cities. (higher means more crime, U.S. average = 301.1)
Sex Offenders
According to our data, there are 82 registered sex offenders living in Indianapolis and 181 registered sex offenders living in . The ratio of residents to sex offenders in Indianapolis is 10,396 to 1; the ratio in Minneapolis is 2,285 to 1. The number of registered sex offenders compared to the number of residents is a lot smaller in Indianapolis than in Minneapolis.
Cost of Living
The cost of living is generally lower in Indianapolis compared to Minneapolis. This encompasses elements such as housing, utilities, grocery costs, and transportation. While Minneapolis is known for its flourishing job market and higher wages, you'll find that your paycheck tends to stretch further in Indianapolis.
Income Tax
Both cities have a state income tax. In Indiana, residents have a flat tax rate of 3.23%. Minnesota has a progressive tax rate ranging from 5.35% to 9.85%, depending on income level.
Property Tax
Property taxes in Minneapolis are higher than in Indianapolis, reflecting the overall higher cost of living in the Twin Cities area.
Sales Tax
The combined sales tax for Indianapolis is 7%, which is the total of the state, county, and city tax rates. In Minneapolis, the combined sales tax is higher at 8.025%.
Income
Type
Indianapolis
Minneapolis
Estimated median household income
$58,479
$69,397
Estimated per capita income
$32,792
$44,836
Cost of living index (U.S. average is 100)
87.7
115.8
If you make $50,000 in Indianapolis, you will have to make $66,021 in Minneapolis to maintain the same standard of living.
Geographical Conditions
Indianapolis is fairly flat and has several small rivers and streams running through the region. In contrast, Minneapolis lies on both sides of the Mississippi River and is known for its lakes and wetlands.
Both cities have robust educational offerings. Minneapolis is home to the University of Minnesota, one of the largest public universities in the U.S. Indianapolis, likewise, houses well-regarded schools like Butler University and Indiana University-Purdue University Indianapolis (IUPUI). In terms of K-12 education, both cities have a mix of public, private, and charter schools.
The economy in Indianapolis is primarily driven by sectors such as healthcare, education, and manufacturing. Some large employers include Indiana University Health and Eli Lilly. Conversely, Minneapolis has a diverse economy with strong sectors like finance, healthcare, and retail trade. Major employers like Target, U.S. Bancorp, and Xcel Energy are based in the city.
Biggest Employers
Eli Lilly and Company, one of the world's largest pharmaceutical companies, is based in Indianapolis. Other significant employers include the State of Indiana and Indiana University Health. In Minneapolis, multinational corporations like Target Corporation, U.S. Bancorp, and Ameriprise Financial provide several jobs.
There were 1,221 building permits issued in Indianapolis in 2012 (704 more than in 2011) compared to 63 building permits issued in Minneapolis in 2012 (14 more than in 2011).
In Indianapolis (Marion County), 60.1% voted for Democrats and 37.9% for Republicans in 2012 Presidential Election. In Minneapolis (Hennepin County), 62.5% voted for Democrats and 35.4% for Republicans.
Elections
Type
Democrats
Republicans
Other
Year
Indianapolis
Minneapolis
Indianapolis
Minneapolis
Indianapolis
Minneapolis
2020
63.7%
70.7%
34.5%
27.4%
1.9%
1.9%
2016
58.2%
63.4%
35.6%
28.3%
6.2%
8.3%
2012
60.1%
62.5%
37.9%
35.4%
2.0%
2.1%
2008
63.8%
63.6%
35.4%
34.9%
0.8%
1.4%
2004
50.6%
59.7%
48.7%
39.7%
0.7%
0.6%
2000
48.0%
53.7%
49.3%
39.4%
2.8%
6.9%
1996
44.6%
54.4%
47.8%
33.2%
7.7%
12.5%
Breakdown of population affiliated with a religious congregation
Type
Adherents
Congregations
Religion
Indianapolis
Minneapolis
Indianapolis
Minneapolis
CATHOLIC CHURCH
11.1%
18.7%
4.6%
8.7%
SOUTHERN BAPTIST CONVENTION
1.6%
0.1%
5.7%
1.3%
AMERICAN BAPTIST CHURCHES IN THE USA
1.2%
0.4%
3.4%
1.3%
LUTHERAN CHURCH
0.8%
1.6%
1.5%
4.1%
EVANGELICAL LUTHERAN CHURCH IN AMERICA
0.5%
10.8%
1.6%
12.6%
SEVENTH DAY ADVENTIST CHURCH
0.5%
0.4%
1.6%
2.9%
EPISCOPAL CHURCH
0.4%
0.7%
1.1%
2.1%
MUSLIM ESTIMATE
0.3%
0.7%
1.1%
2.7%
NATIONA ASSOCIA CONGREG CHRISTIAN CHURCHES
0.0%
0.4%
0.0%
0.2%
WISCONSIN EVANGELICAL LUTHERAN SYNOD
0.0%
0.4%
0.1%
1.4%
Weather
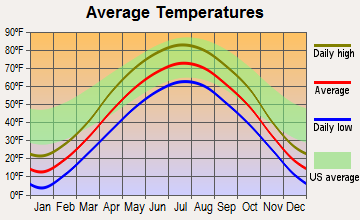
Indianapolis experiences a humid continental climate with hot, humid summers and cold winters. Snowfall is common during winter months. Minneapolis, on the other hand, has a very similar humid continental climate. However, it experiences severe cold in winter months with temperatures often dipping below freezing. If you prefer milder winters, Indianapolis might be the more suitable location.
Weather and climate
Type
Indianapolis
Minneapolis
Temperature - Average
52.1°F
45.3°F
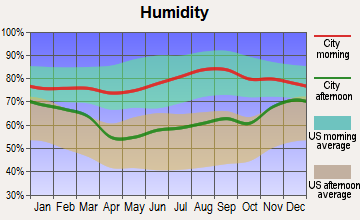
Humidity - Average morning or afternoon humidity
77%
74.9%
Humidity - Differences between morning and afternoon humidity
31%
33%
Humidity - Maximum monthly morning or afternoon humidity
86%
84%
Humidity - Minimum monthly morning or afternoon humidity
55%
51%
Precipitation - Yearly average
40.6 in
30.4 in
Snowfall - Yearly average
51 in
98.6 in
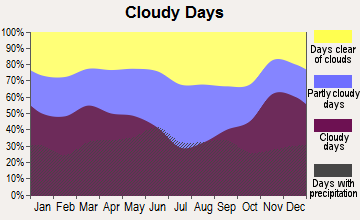
Clouds - Number of days clear of clouds
14.7%
15.8%
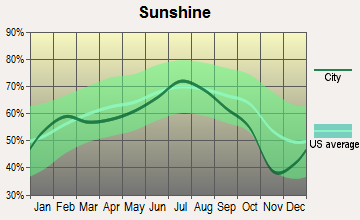
Sunshine amount - Average
56.2%
61.8%
Sunshine amount - Differences during a year
33%
37%
Sunshine amount - Maximum monthly
65%
74%
Sunshine amount - Minimum monthly
32%
37%
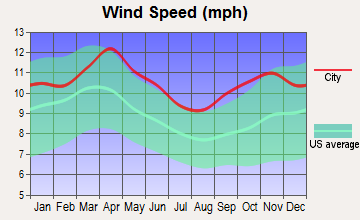
Wind speed - Average
10.3 mph
10.5 mph
Average climate in Indianapolis, Indiana
Average climate in Minneapolis, Minnesota
Air pollution
Type
AQI
CO
NO2
OZONE
PB
PM10
PM25
SO2
Year
Indianapolis
Minneapolis
Indianapolis
Minneapolis
Indianapolis
Minneapolis
Indianapolis
Minneapolis
Indianapolis
Minneapolis
Indianapolis
Minneapolis
Indianapolis
Minneapolis
Indianapolis
Minneapolis
2018
94
81
0.58
0.24
13.2
14.1
23.1
28.2
N/A
N/A
18.2
20.4
10.4
8.5
0.3
1.3
2017
87
71
0.82
0.26
12.4
13.4
23.0
27.9
N/A
N/A
17.6
17.5
10.1
7.8
0.4
1.4
2016
91
76
0.62
0.28
13.0
12.6
22.5
26.7
N/A
N/A
18.0
16.7
9.9
7.3
0.4
1.5
2015
89
80
0.73
0.28
14.9
13.8
22.9
27.8
N/A
N/A
19.7
19.4
9.9
8.8
1.1
1.1
2014
100
83
0.62
0.25
16.1
15.9
25.1
26.8
N/A
N/A
20.6
21.2
12.1
7.0
3.2
1.0
2013
94
81
0.69
N/A
11.5
12.8
26.3
32.1
N/A
N/A
19.9
20.9
12.8
6.7
2.6
0.9
2012
103
80
0.65
N/A
10.4
7.7
25.7
29.0
N/A
N/A
20.8
23.8
12.9
8.4
2.9
0.2
2011
105
90
0.68
0.22
11.3
7.8
22.9
29.7
N/A
N/A
N/A
23.4
16.3
9.8
2.4
0.1
2010
101
101
0.54
N/A
12.7
9.6
21.6
27.8
N/A
0.003
N/A
24.7
15.9
9.6
3.3
0.5
2009
97
103
0.73
N/A
11.4
7.4
23.2
N/A
N/A
0.004
N/A
21.4
13.8
9.4
1.9
1.1
2008
91
92
0.62
N/A
11.5
8.8
N/A
N/A
0.010
0.003
N/A
18.3
13.2
10.1
3.0
1.0
2007
103
102
0.69
N/A
13.1
9.2
N/A
N/A
0.011
0.003
N/A
21.6
14.9
11.6
3.6
0.6
2006
95
88
0.59
N/A
14.5
9.5
N/A
N/A
0.009
0.006
N/A
20.5
14.5
10.5
3.6
1.8
2005
121
107
0.65
N/A
15.2
12.3
N/A
N/A
0.014
0.004
N/A
22.0
18.0
10.6
4.3
2.1
2004
104
103
0.62
N/A
15.8
11.0
N/A
N/A
0.010
0.005
N/A
23.9
15.1
10.5
4.6
3.3
2003
113
114
0.67
N/A
16.6
12.5
N/A
N/A
0.010
0.004
N/A
25.9
15.8
11.9
4.2
3.0
2002
125
95
0.76
0.42
17.4
15.7
N/A
N/A
0.009
0.007
N/A
N/A
16.8
10.9
3.9
1.8
2001
105
82
0.81
0.75
16.6
17.5
N/A
32.4
0.031
0.011
N/A
N/A
16.3
9.3
3.8
2.0
2000
98
68
0.87
0.75
17.3
16.6
N/A
31.2
N/A
0.009
N/A
N/A
N/A
N/A
4.5
2.8
Natural disasters
Type
Indianapolis
Minneapolis
Tornado activity compared to U.S. average
226.7%
129.9%
Earthquake activity compared to U.S. average
179.6%
44.5%
Natural disasters compared to U.S. average
16%
17%
Transportation
Indianapolis is renowned for its car-friendly infrastructure, with most residents driving their personal vehicles. The city also offers public transit options like IndyGo buses. Conversely, Minneapolis boasts a robust public transit system, which includes light rail transit (LRT) lines and buses. Biking is also popular in Minneapolis due to its ample biking lanes.
Transport
Type
Indianapolis
Minneapolis
Amtrak stations
1
0
Amtrak stations nearby
1
1
FAA registered aircraft
739
284
FAA registered aircraft manufacturers and dealers
18
0
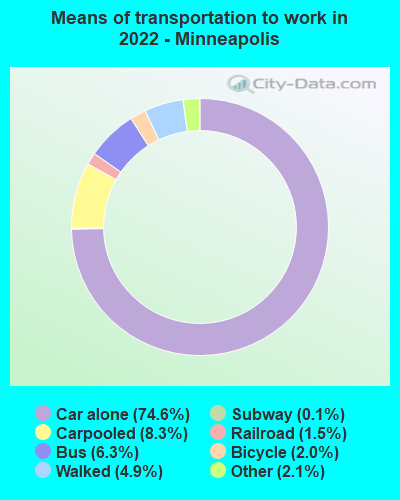
Means of transportation to work
Type
Indianapolis
Minneapolis
Bicycle
0.5%
1.9%
Bus
1.2%
6.6%
Carpooled
8.5%
9%
Car alone
87.3%
74.3%
Motorcycle
0%
0.1%
Railroad
0%
0.6%
Subway
0%
0.2%
Taxicab
0.1%
0.2%
Walked
1.6%
5.2%
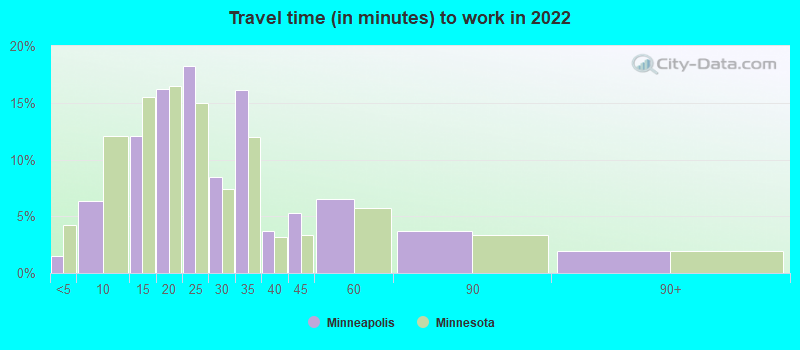
Average travel time to work
Type
Indianapolis
Minneapolis
Average
28.1 min
27.4 min
Other means
22.5 min
20.3 min
Public transportation
40.2 min
32.6 min
Private vehicle occupancy
Type
Indianapolis
Minneapolis
Average
1.2
1.2
Drove alone
88.2%
87.5%
In 2 person carpool
9.4%
10.3%
In 3 person carpool
1.3%
1%
In 4 person carpool
0.5%
0.8%
In 5-6 person carpool
0.4%
0.4%
In 7+ person carpool
0.1%
0%
How many people usually rode to work in the car, truck or van.
Real Estate
Real estate in Minneapolis tends to be more expensive than in Indianapolis, reflecting the higher cost of living. Minneapolis, however, offers a wide array of housing styles, some with views of its many lakes. Indianapolis has a mix of urban and suburban home styles that suit various budgets.
Neighborhoods
Indianapolis neighborhoods like Lockerbie Square and Fountain Square have historic charm and a robust arts scene. In Minneapolis, neighborhoods like Uptown and North Loop provide trendy shopping, dining, and entertainment options.
Houses and residents
Type
Indianapolis
Minneapolis
Houses
399,820
203,633
Average household size (people)
2.4
2.2
Median year apartment built
1977
1967
Length of stay in the house since moving in
13 years
13 years
Houses occupied
358,150 (89.6%)
188,681 (92.7%)
Houses occupied by owners
201,149 (56.2%)
93,981 (49.8%)
Houses occupied by renters
157,001 (43.8%)
94,700 (50.2%)
Median rent asked for vacant for-rent units
$876.58
$1,777
Median monthly housing costs
$980
$1,369
Median price asked for vacant for-sale houses and condos
$283,027
$238,504
Estimated median house or condo value
$188,700
$319,100
Median numbers of rooms
5.5
4.8
Median number of rooms in apartments
4.3
3.3
Median number of rooms in houses and condos
6.5
6.4
Median house price - detached houses
$231,490
$398,431
Median house price - in 2-unit structures
$257,253
$353,466
Median house price - in 3-to-4-unit structures
$240,688
$335,939
Median house price - in 5 or more unit structures
$247,275
$317,891
Median house price - mobile homes
$58,413
$9,605
Median house price - Townhouses or other attached units
$222,424
$376,360
Median house price - All housing units
$229,666
$383,883
Median house age
48
70
Renting percentage
44.2%
50.8%
Housing density (houses/condos per square mile)
1,106.1
3,709.7
House value disparities
36.1%
30.1%
Household income disparities
44.4%
45.3%
Median household income for houses/condes with a mortgage
$86,008
$113,268
Median household income for apartments without a mortgage
$61,922
$70,111
Housing units without a mortgage
4,552 (3.2%)
1,756 (2.5%)
Housing units with both a second mortgage and home equity loan
9,787 (6.8%)
6,107 (8.7%)
Housing units with a mortgage
138,622 (96.8%)
68,555 (97.5%)
Housing units with a home equity loan
271 (0.2%)
203 (0.3%)
Housing units with a second mortgage
12,987 (9.1%)
7,699 (10.9%)
House/condo owner moved in on average (years ago)
11
10
House/condo renter moved in on average (years ago)
1
1
Housing units lacking complete kitchen facilities
3.4%
0.7%
Housing units lacking complete plumbing facilities
1.1%
0.4%
Housing units in structures
Housing units in structures
Indianapolis
Minneapolis
One, detached
59.0%
41.8%
One, attached
9.2%
3.6%
Two
2.5%
7.4%
3 or 4
6.2%
3.8%
5 to 9
7.7%
3.7%
10 to 19
6.3%
6.2%
20 to 49
3.1%
9.8%
50 or more
5.0%
23.3%
Mobile homes
1.0%
0.3%
Median real estate property taxes paid for housing units
Self-employed workers in own not incorporated business
17,131
13,397
State government workers
15,502
12,526
Unpaid family workers
1,601
516
Industries and Occupations
Key industries in Indianapolis include manufacturing, logistics, health services, and education. In Minneapolis, finance, retail trade, and healthcare are the dominant sectors.
Top-notch health facilities are present in both cities. Indianapolis is home to the renowned Indiana University Health system. Conversely, Minneapolis has several leading health institutions, including the Mayo Clinic and the University of Minnesota Medical Center.
Health (county statistics)
Type
Indianapolis
Minneapolis
General health status score of residents in this county from 1 (poor) to 5 (excellent)
Indianapolis is known for its efficient road network and its world-known Indianapolis Motor Speedway. Conversely, Minneapolis is lauded for its impressive bike paths, pedestrian-friendly streets, and beautiful parks and lakes.
Infrastructure
Type
Indianapolis
Minneapolis
Hospitals
76
17
TV stations
19
17
Arenas or stadiums
3
4
Bank branches located here
259
86
Bank institutions located here
27
26
Main business address for public companies
28
59
Drinking water stations with no reported violations in the past
1
10
Drinking water stations with reported violations in the past
HMDA - Conventional home purchase loans - Applications denied
Year
Indianapolis
Minneapolis
1999
3,358
1,420
2000
3,562
428
2001
2,649
294
2002
1,915
272
2003
2,519
1,151
2004
3,702
1,818
2005
6,057
3,008
2006
5,811
3,221
2007
3,456
1,812
2008
1,247
710
2009
565
372
Culture and Food
Indianapolis boasts a vibrant arts scene, historical sites, and diverse dining options influenced by Midwest culture. Minneapolis has a renowned arts community, numerous museums, theatres, and a food scene boasting a mix of American and international cuisines.
Sports Teams
Indianapolis is home to the Indianapolis Colts (NFL) and Indiana Pacers (NBA), while Minneapolis hosts the Minnesota Vikings (NFL), Minnesota Twins (MLB), and Minnesota Timberwolves (NBA).


 Indianapolis, IN and
  Minneapolis, MN : 509.4 miles