Comparing two diverse cities like Indianapolis, Indiana, and North Hempstead, New York, involves numerous factors. Each city offers a different lifestyle and opportunities depending on personal preferences. From a broader perspective, this comparison includes elements from crime and safety to culture and food, public transit, and tax implications.
Distance between
Indianapolis, IN and
North Hempstead, NY : 660.8 miles
Indianapolis's population is larger by 290%. Its population has grown by 100,169 people (12.8%) since 2000. The population of North Hempstead has grown by 3,711 people (1.7%) during that time.
As for crime and safety rates, Indianapolis struggles with a crime rate that is higher than the national average, particularly in areas of property crime and violent crime. In contrast, North Hempstead, NY, maintains a crime rate substantially lower than the national average, making it a safe environment for both residents and visitors.
Cost of Living
In terms of cost of living, North Hempstead is significantly higher than Indianapolis due to its location in the greater New York City area. Housing, groceries, and transportation are generally more costly in North Hempstead than in Indianapolis.
Income Tax
Indiana has a flat income tax rate of 3.23%, while New York state has progressive income tax rates ranging from 4% to 8.82%.
Property Tax
Property taxes tend to be higher in North Hempstead than in Indianapolis, reflecting its higher cost of living and residential property values.
Sales Tax
Indianapolis, Indiana, has a city and state sales tax rate of 7%. On the other hand, North Hempstead, New York, has a combined city and state sales tax rate of 8.625%.
Income
Type
Indianapolis
North Hempstead
Estimated median household income
$58,479
$141,417
Estimated per capita income
$32,792
$71,121
Cost of living index (U.S. average is 100)
87.7
173.2
If you make $50,000 in Indianapolis, you will have to make $98,746 in North Hempstead to maintain the same standard of living.
Geographical Conditions
While Indianapolis is a flat city located in the Great Lakes region, North Hempstead is located on Long Island, providing oceanic landscapes with plenty of green spaces.
Both cities boast of excellent educational institutions. Indianapolis has a vast public school system and several higher education institutions like Indiana University—Purdue University Indianapolis. North Hempstead also has good schools and is in proximity to the world-renowned universities in New York City.
Regarding work and economy, Indianapolis has a diverse economy focused on education, health services, and retail. North Hempstead has a strong economy tied to professional services, health care, and public administration.
Biggest Employers
Indianapolis's biggest employers are IU Health, Eli Lilly, and St Vincent Health. On the other hand, North Hempstead's largest employers are Winthrop-University Hospital, Northwell Health, and Broadridge Financial Solutions.
Building permits
Type
Average value
Count
City
Indianapolis
North Hempstead
Indianapolis
North Hempstead
1997
$121,100
$144,100
3,063
55
1998
$122,400
$144,100
3,820
55
1999
$127,400
$104,800
3,962
81
2000
$136,500
$180,400
3,534
46
2001
$140,200
$174,000
4,765
57
2002
$144,100
$207,200
3,532
71
2003
$152,000
$181,600
3,375
122
2004
$155,300
$287,900
2,737
104
2005
$158,600
$281,700
2,760
96
2006
$162,800
$305,800
1,947
74
2007
$165,600
$281,500
1,317
18
2008
$155,400
$377,300
734
38
2009
$141,400
$342,600
587
14
2010
$143,800
$373,500
619
33
2011
$166,300
$399,700
517
28
2012
$205,300
$332,100
472
18
2013
$212,000
$413,400
562
24
2014
$226,200
$347,100
572
45
2015
$243,600
$347,000
743
56
2016
$251,500
$382,400
831
48
2017
$257,800
$428,900
914
49
2018
$258,600
$619,700
1,090
43
2019
$265,900
$515,300
1,153
37
2020
$276,900
$448,900
1,108
30
2021
$283,900
$497,800
1,221
11
There were 1,221 building permits issued in Indianapolis in 2012 (704 more than in 2011) compared to 11 building permits issued in North Hempstead in 2012 (17 less than in 2011).
In Indianapolis (Marion County), 60.1% voted for Democrats and 37.9% for Republicans in 2012 Presidential Election. In North Hempstead (Nassau County), 53.4% voted for Democrats and 45.7% for Republicans.
Elections
Type
Democrats
Republicans
Other
Year
Indianapolis
North Hempstead
Indianapolis
North Hempstead
Indianapolis
North Hempstead
2020
63.7%
54.3%
34.5%
44.7%
1.9%
1.0%
2016
58.2%
51.2%
35.6%
45.3%
6.2%
3.4%
2012
60.1%
53.4%
37.9%
45.7%
2.0%
0.9%
2008
63.8%
54.0%
35.4%
45.6%
0.8%
0.4%
2004
50.6%
52.3%
48.7%
46.7%
0.7%
1.0%
2000
48.0%
58.0%
49.3%
38.5%
2.8%
3.5%
1996
44.6%
55.7%
47.8%
36.1%
7.7%
8.1%
Breakdown of population affiliated with a religious congregation
Type
Adherents
Congregations
Religion
Indianapolis
North Hempstead
Indianapolis
North Hempstead
CATHOLIC CHURCH
11.1%
50.6%
4.6%
9.7%
SOUTHERN BAPTIST CONVENTION
1.6%
0.0%
5.7%
0.7%
AMERICAN BAPTIST CHURCHES IN THE USA
1.2%
0.2%
3.4%
1.6%
LUTHERAN CHURCH
0.8%
0.3%
1.5%
1.1%
EVANGELICAL LUTHERAN CHURCH IN AMERICA
0.5%
1.1%
1.6%
5.0%
SEVENTH DAY ADVENTIST CHURCH
0.5%
0.2%
1.6%
3.2%
EPISCOPAL CHURCH
0.4%
0.9%
1.1%
5.4%
MUSLIM ESTIMATE
0.3%
1.2%
1.1%
1.5%
Weather
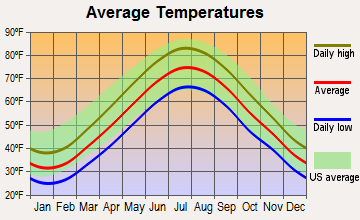
Concerning weather, Indianapolis experiences a humid continental climate, with hot and humid summers, and cold winters. North Hempstead, on the other hand, enjoys a temperate marine climate, with wet winters and hot summers, but with less temperature variation than Indianapolis.
Weather and climate
Type
Indianapolis
North Hempstead
Temperature - Average
52.1°F
53.2°F
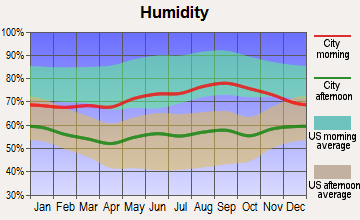
Humidity - Average morning or afternoon humidity
77%
68.6%
Humidity - Differences between morning and afternoon humidity
31%
25.2%
Humidity - Maximum monthly morning or afternoon humidity
86%
76.4%
Humidity - Minimum monthly morning or afternoon humidity
55%
51.2%
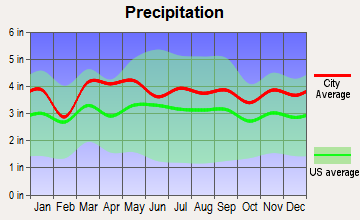
Precipitation - Yearly average
40.6 in
45.5 in
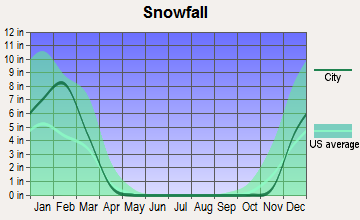
Snowfall - Yearly average
51 in
52.7 in
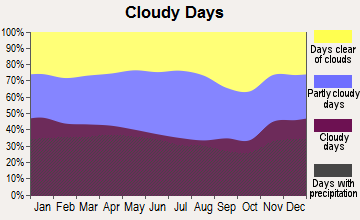
Clouds - Number of days clear of clouds
14.7%
16.4%
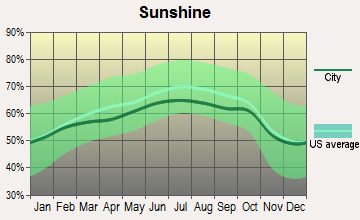
Sunshine amount - Average
56.2%
60.2%
Sunshine amount - Differences during a year
33%
20%
Sunshine amount - Maximum monthly
65%
64%
Sunshine amount - Minimum monthly
32%
44%
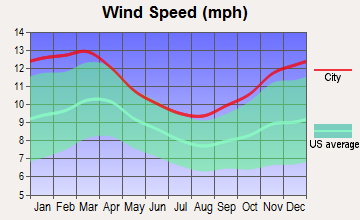
Wind speed - Average
10.3 mph
11.5 mph
Average climate in Indianapolis, Indiana
Average climate in North Hempstead, New York
Air pollution
Type
AQI
CO
NO2
OZONE
PB
PM10
PM25
SO2
Year
Indianapolis
North Hempstead
Indianapolis
North Hempstead
Indianapolis
North Hempstead
Indianapolis
North Hempstead
Indianapolis
North Hempstead
Indianapolis
North Hempstead
Indianapolis
North Hempstead
Indianapolis
North Hempstead
2018
94
96
0.58
0.28
13.2
15.9
23.1
25.3
N/A
N/A
18.2
N/A
10.4
6.7
0.3
0.3
2017
87
95
0.82
0.17
12.4
16.2
23.0
25.5
N/A
N/A
17.6
N/A
10.1
6.7
0.4
0.4
2016
91
96
0.62
0.26
13.0
16.9
22.5
25.2
N/A
N/A
18.0
N/A
9.9
6.8
0.4
0.5
2015
89
102
0.73
0.29
14.9
18.1
22.9
24.3
N/A
N/A
19.7
N/A
9.9
7.9
1.1
1.1
2014
100
95
0.62
0.31
16.1
18.0
25.1
24.1
N/A
N/A
20.6
N/A
12.1
7.8
3.2
1.3
2013
94
100
0.69
0.32
11.5
18.5
26.3
24.8
N/A
N/A
19.9
N/A
12.8
8.8
2.6
1.5
2012
103
102
0.65
0.36
10.4
18.1
25.7
25.1
N/A
N/A
20.8
N/A
12.9
9.1
2.9
1.9
2011
105
110
0.68
0.37
11.3
20.4
22.9
24.3
N/A
N/A
N/A
N/A
16.3
10.9
2.4
2.4
2010
101
108
0.54
0.42
12.7
19.5
21.6
24.5
N/A
N/A
N/A
N/A
15.9
10.0
3.3
2.6
2009
97
106
0.73
0.40
11.4
21.6
23.2
20.9
N/A
N/A
N/A
N/A
13.8
10.1
1.9
3.7
2008
91
113
0.62
0.47
11.5
22.8
N/A
21.8
0.010
0.013
N/A
N/A
13.2
11.5
3.0
4.6
2007
103
120
0.69
0.52
13.1
23.8
N/A
20.9
0.011
0.016
N/A
N/A
14.9
12.1
3.6
4.5
2006
95
116
0.59
0.52
14.5
24.0
N/A
20.3
0.009
0.018
N/A
N/A
14.5
12.8
3.6
4.7
2005
121
107
0.65
0.61
15.2
26.4
N/A
19.5
0.014
N/A
N/A
N/A
18.0
N/A
4.3
5.9
2004
104
96
0.62
0.62
15.8
26.1
N/A
18.3
0.010
0.030
N/A
N/A
15.1
N/A
4.6
5.6
2003
113
105
0.67
0.72
16.6
27.6
N/A
18.9
0.010
0.025
N/A
26.9
15.8
N/A
4.2
6.0
2002
125
115
0.76
0.67
17.4
27.6
N/A
19.5
0.009
N/A
N/A
25.6
16.8
N/A
3.9
5.4
2001
105
117
0.81
0.62
16.6
27.7
N/A
20.1
0.031
N/A
N/A
24.1
16.3
N/A
3.8
6.7
2000
98
110
0.87
0.65
17.3
27.4
N/A
18.5
N/A
N/A
N/A
22.2
N/A
N/A
4.5
6.6
Natural disasters
Type
Indianapolis
North Hempstead
Tornado activity compared to U.S. average
226.7%
51.8%
Earthquake activity compared to U.S. average
179.6%
30.3%
Natural disasters compared to U.S. average
16%
25%
Transportation
Both cities have good public transit systems, but North Hempstead is often preferred due to its proximity to NYC and an extensive train network.
Transport
Type
Indianapolis
North Hempstead
Amtrak stations
1
0
Amtrak stations nearby
1
3
FAA registered aircraft
739
0
FAA registered aircraft manufacturers and dealers
18
0
Means of transportation to work
Type
Indianapolis
North Hempstead
Bicycle
0.5%
0.2%
Bus
1.2%
2.3%
Carpooled
8.5%
9%
Car alone
87.3%
64.5%
Railroad
0%
14.5%
Subway
0%
1.2%
Taxicab
0.1%
0.3%
Walked
1.6%
3.6%
Average travel time to work
Type
Indianapolis
North Hempstead
Average
28.1 min
35.2 min
Real Estate
Real estate in Indianapolis tends to be more affordable than in North Hempstead. The median value of homes in North Hempstead is significantly higher due to its proximity to NYC.
Neighborhoods
Indianapolis has an urban-suburban mix feel with many coffee shops and parks, while North Hempstead is more suburban, offering residents a sparse urban feel with most residents owning their homes.
Houses and residents
Type
Indianapolis
North Hempstead
Houses
399,820
78,927
Average household size (people)
2.4
2.9
Houses occupied
358,150 (89.6%)
76,820 (97.3%)
Houses occupied by owners
201,149 (56.2%)
60,270 (78.5%)
Houses occupied by renters
157,001 (43.8%)
16,550 (21.5%)
Median rent asked for vacant for-rent units
$876.58
$2,429
Median price asked for vacant for-sale houses and condos
$283,027
$543,123
Estimated median house or condo value
$188,700
$868,288
Median number of rooms in apartments
4.3
4.1
Median number of rooms in houses and condos
6.5
7
Renting percentage
44.2%
21.9%
Housing density (houses/condos per square mile)
1,106.1
1,473.1
Household income disparities
44.4%
32%
Housing units without a mortgage
4,552 (3.2%)
19,645 (37.1%)
Housing units with both a second mortgage and home equity loan
9,787 (6.8%)
164 (0.3%)
Housing units with a mortgage
138,622 (96.8%)
33,305 (62.9%)
Housing units with a home equity loan
271 (0.2%)
4,188 (7.9%)
Housing units with a second mortgage
12,987 (9.1%)
2,281 (4.3%)
Housing units lacking complete kitchen facilities
3.4%
0.4%
Housing units lacking complete plumbing facilities
Self-employed workers in own not incorporated business
17,131
8,268
State government workers
15,502
2,777
Unpaid family workers
1,601
297
Industries and Occupations
In Indianapolis, the top industries are health care, social assistance, and retail trade. However, in North Hempstead, professional, scientific, and technical services dominate as the primary industries.
Indianapolis is known for its strong healthcare sector, featuring several top-rated hospitals and medical facilities. North Hempstead, located near NYC, provides easy access to world-class healthcare services, including renowned institutions like NYU Langone Health and NewYork-Presbyterian Hospital.
Health (county statistics)
Type
Indianapolis
North Hempstead
General health status score of residents in this county from 1 (poor) to 5 (excellent)
Infrastructure-wise, Indianapolis benefits from its status as a state capital, meaning it has significant public infrastructure investment. On the other hand, North Hempstead also has solid infrastructure due to its location close to NYC.
Infrastructure
Type
Indianapolis
North Hempstead
TV stations
19
30
Culture and Food
Indianapolis offers a diverse cultural scene that includes sports, music, and a burgeoning food scene. North Hempstead, being in the New York metro area, has an even more diverse cultural experience with plenty of international cuisines, theater, arts, and music.
Sports Teams
As for sports, Indianapolis is home to the NFL’s Colts, the NBA's Pacers, and the Indianapolis 500 motor race. North Hempstead residents root for the New York area teams and are close to the sporting events in New York City.


 Indianapolis, IN and
  North Hempstead, NY : 660.8 miles
 Indianapolis, IN and
  North Hempstead, NY : 660.8 miles