When looking at Indianapolis, Indiana and Richmond, Virginia, it's important to consider multiple factors that may influence the experience living or visiting there. These two cities offer distinct lifestyles, climates, and cost of living differences. Indianapolis is a large, bustling city known for its vibrant sports culture and automobile racing, while Richmond is renowned for its historic nature and picturesque riverfront. Each city possesses its own unique charm that can be a deciding factor for individuals planning to relocate or visit.
Distance between
Indianapolis, IN and
Richmond, VA : 493.5 miles
Indianapolis's population is larger by 289%. Its population has grown by 100,169 people (12.8%) since 2000. The population of Richmond has grown by 28,814 people (14.6%) during that time.
Like any urban area, both Indianapolis and Richmond struggle with crime. Indianapolis has crime rates that are significantly above the national average. Efforts have been ongoing to reduce crime with certain neighborhoods experiencing improvements. On the other hand, Richmond has reported a slight decrease in overall crime but it's still considered relatively high when compared to U.S. averages. Both cities have areas considered safer than others, so residents and visitors should research neighborhood-specific statistics.
City-data.com crime index counts serious crimes and violent crime more heavily. It adjusts for the number of visitors and daily workers commuting into cities. (higher means more crime, U.S. average = 301.1)
City-data.com crime index counts serious crimes and violent crime more heavily. It adjusts for the number of visitors and daily workers commuting into cities. (higher means more crime, U.S. average = 301.1)
Sex Offenders
According to our data, there are 82 registered sex offenders living in Indianapolis and 7,076 registered sex offenders living in . The ratio of residents to sex offenders in Indianapolis is 10,396 to 1; the ratio in Richmond is 32 to 1. The number of registered sex offenders compared to the number of residents is a lot smaller in Indianapolis than in Richmond.
Cost of Living
When it comes to cost of living factors like housing, food, and utilities, Indianapolis tends to be more affordable than Richmond. While cost of housing is lower in Indianapolis, Richmond has a somewhat higher median household income, which can help offset the increased cost of living.
Income Tax
Indiana has a flat state income tax rate of 3.23%, whereas Virginia's state income tax is based on income brackets, ranging from 2% to 5.75%. Residents will have varying tax responsibilities depending on their income.
Property Tax
Both cities have property taxes. In Indianapolis, the average property tax rate is about 0.85% of a property’s assessed fair market value. In Richmond, the property tax rate is slightly higher at around 1.2%.
Sales Tax
Indiana has a state sales tax of 7%, while Richmond in Virginia has a state sales tax of 4.3%, with an additional local tax that brings the total sales tax to 5.3%. This lower tax in Virginia could be an attraction for both residents and visitors.
Income
Type
Indianapolis
Richmond
Estimated median household income
$58,479
$51,770
Estimated per capita income
$32,792
$38,425
Cost of living index (U.S. average is 100)
87.7
94.8
If you make $50,000 in Indianapolis, you will have to make $54,048 in Richmond to maintain the same standard of living.
Geographical Conditions
Indianapolis is located in the Midwest, known for its flat landscapes, while Richmond is more towards the East Coast and is located on the James River, offering diverse landscapes - from the downtown riverfront to rolling hills.
Both cities boast strong educational institutions. Indianapolis is home to many well-regarded public and private schools and higher education institutions like Indiana University-Purdue University Indianapolis. Richmond has a robust public education system, with numerous higher education institutions including Virginia Commonwealth University and University of Richmond. Both cities offer diverse educational opportunities for residents.
Indianapolis has a diverse economy with strong sectors in healthcare, education, and finance, while Richmond has a robust economy focused on government, finance, and education sectors. Both cities have above-average job growth and plentiful job opportunities in their respective dominant sectors.
Biggest Employers
Major employers in Indianapolis include Indiana University Health, Eli Lilly and Company, and the Community Health Network. In Richmond, top employers include Virginia Commonwealth University Health System, Capital One Financial Corp, and Altria Group Inc.
There were 1,221 building permits issued in Indianapolis in 2012 (704 more than in 2011) compared to 502 building permits issued in Richmond in 2012 (410 more than in 2011).
In Indianapolis (Marion County), 60.1% voted for Democrats and 37.9% for Republicans in 2012 Presidential Election. In Richmond (Richmond city), 78.1% voted for Democrats and 20.6% for Republicans.
Elections
Type
Democrats
Republicans
Other
Year
Indianapolis
Richmond
Indianapolis
Richmond
Indianapolis
Richmond
2020
63.7%
82.9%
34.5%
14.9%
1.9%
2.1%
2016
58.2%
78.6%
35.6%
15.1%
6.2%
6.4%
2012
60.1%
78.1%
37.9%
20.6%
2.0%
1.3%
2008
63.8%
79.5%
35.4%
20.1%
0.8%
0.3%
2004
50.6%
70.4%
48.7%
29.2%
0.7%
0.4%
2000
48.0%
65.0%
49.3%
30.8%
2.8%
4.2%
1996
44.6%
63.0%
47.8%
31.3%
7.7%
5.7%
Breakdown of population affiliated with a religious congregation
Type
Adherents
Congregations
Religion
Indianapolis
Richmond
Indianapolis
Richmond
CATHOLIC CHURCH
11.1%
9.1%
4.6%
3.6%
SOUTHERN BAPTIST CONVENTION
1.6%
11.4%
5.7%
14.5%
AMERICAN BAPTIST CHURCHES IN THE USA
1.2%
10.1%
3.4%
8.7%
LUTHERAN CHURCH
0.8%
0.3%
1.5%
0.7%
EVANGELICAL LUTHERAN CHURCH IN AMERICA
0.5%
0.7%
1.6%
1.1%
SEVENTH DAY ADVENTIST CHURCH
0.5%
0.7%
1.6%
1.1%
EPISCOPAL CHURCH
0.4%
5.5%
1.1%
4.4%
MUSLIM ESTIMATE
0.3%
3.4%
1.1%
1.1%
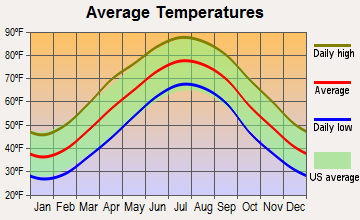
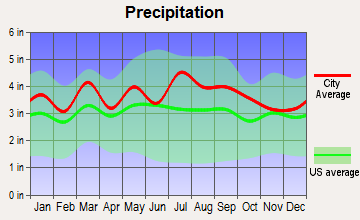
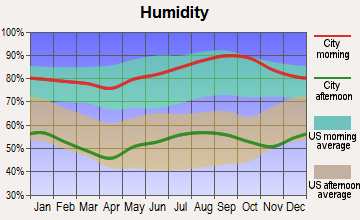
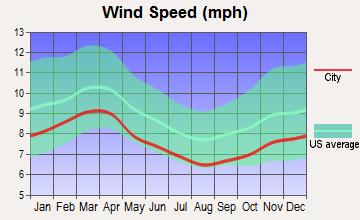
Weather
Climate-wise, Indianapolis and Richmond offer four distinct seasons. Indianapolis experiences long, hot, humid summers, and cold, snowy winters. Richmond's climate is slightly more moderate, with slightly warmer winters and cooler summers compared to Indianapolis. Regardless, both cities can be enjoyed year-round with plentiful indoor and outdoor activities suited for each season.
Weather and climate
Type
Indianapolis
Richmond
Temperature - Average
52.1°F
57.7°F
Humidity - Average morning or afternoon humidity
77%
72.5%
Humidity - Differences between morning and afternoon humidity
31%
42%
Humidity - Maximum monthly morning or afternoon humidity
86%
88%
Humidity - Minimum monthly morning or afternoon humidity
55%
46%
Precipitation - Yearly average
40.6 in
44 in
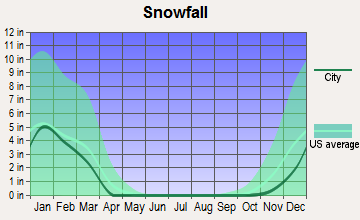
Snowfall - Yearly average
51 in
26.6 in
Clouds - Number of days clear of clouds
14.7%
16.6%
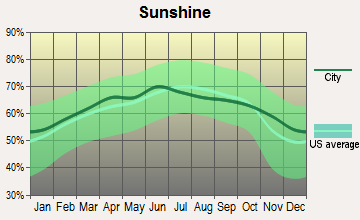
Sunshine amount - Average
56.2%
67.5%
Sunshine amount - Differences during a year
33%
14%
Sunshine amount - Maximum monthly
65%
68%
Sunshine amount - Minimum monthly
32%
54%
Wind speed - Average
10.3 mph
8.3 mph
Average climate in Indianapolis, Indiana
Average climate in Richmond, Virginia
Air pollution
Type
AQI
CO
NO2
OZONE
PB
PM10
PM25
SO2
Year
Indianapolis
Richmond
Indianapolis
Richmond
Indianapolis
Richmond
Indianapolis
Richmond
Indianapolis
Richmond
Indianapolis
Indianapolis
Richmond
Indianapolis
Richmond
2018
94
76
0.58
0.30
13.2
12.0
23.1
25.9
N/A
0.002
18.2
N/A
10.4
8.3
0.3
0.2
2017
87
72
0.82
0.27
12.4
12.6
23.0
27.3
N/A
0.002
17.6
N/A
10.1
8.4
0.4
0.2
2016
91
78
0.62
0.29
13.0
12.2
22.5
26.8
N/A
0.002
18.0
N/A
9.9
8.8
0.4
0.3
2015
89
78
0.73
0.29
14.9
14.3
22.9
25.7
N/A
0.002
19.7
N/A
9.9
10.2
1.1
0.5
2014
100
68
0.62
0.30
16.1
13.2
25.1
26.7
N/A
0.002
20.6
N/A
12.1
7.9
3.2
0.7
2013
94
71
0.69
0.26
11.5
9.3
26.3
24.7
N/A
0.002
19.9
N/A
12.8
7.5
2.6
0.6
2012
103
83
0.65
0.28
10.4
9.3
25.7
27.3
N/A
0.003
20.8
N/A
12.9
7.7
2.9
0.7
2011
105
85
0.68
0.28
11.3
9.7
22.9
32.2
N/A
0.003
N/A
N/A
16.3
8.7
2.4
1.1
2010
101
88
0.54
N/A
12.7
10.9
21.6
35.5
N/A
0.003
N/A
N/A
15.9
N/A
3.3
2.0
2009
97
69
0.73
N/A
11.4
9.1
23.2
28.3
N/A
0.004
N/A
N/A
13.8
N/A
1.9
2.0
2008
91
92
0.62
N/A
11.5
7.4
N/A
32.4
0.010
0.004
N/A
N/A
13.2
N/A
3.0
2.3
2007
103
101
0.69
N/A
13.1
7.1
N/A
33.8
0.011
0.006
N/A
N/A
14.9
N/A
3.6
3.2
2006
95
92
0.59
N/A
14.5
9.8
N/A
32.4
0.009
0.005
N/A
N/A
14.5
N/A
3.6
3.4
2005
121
92
0.65
0.47
15.2
10.2
N/A
30.5
0.014
0.006
N/A
N/A
18.0
N/A
4.3
4.4
2004
104
85
0.62
0.51
15.8
10.5
N/A
28.1
0.010
0.005
N/A
N/A
15.1
N/A
4.6
3.6
2003
113
85
0.67
0.47
16.6
10.8
N/A
28.7
0.010
N/A
N/A
N/A
15.8
N/A
4.2
4.3
2002
125
107
0.76
0.41
17.4
11.7
N/A
34.7
0.009
N/A
N/A
N/A
16.8
N/A
3.9
3.9
2001
105
100
0.81
0.42
16.6
12.0
N/A
30.6
0.031
N/A
N/A
N/A
16.3
N/A
3.8
4.4
2000
98
94
0.87
0.32
17.3
10.8
N/A
30.1
N/A
N/A
N/A
N/A
N/A
N/A
4.5
4.6
Natural disasters
Type
Indianapolis
Richmond
Tornado activity compared to U.S. average
226.7%
90.7%
Earthquake activity compared to U.S. average
179.6%
46.4%
Natural disasters compared to U.S. average
16%
0%
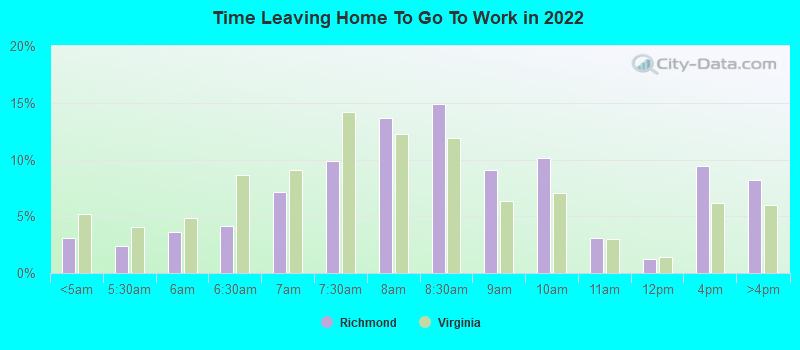
Transportation
Commuting times in Indianapolis are below the national average, and the city offers public bus services with IndyGo. Richmond offers public transit through the GRTC bus system. Both cities are serviced by international airports providing easy access for travel.
Transport
Type
Indianapolis
Richmond
Amtrak stations
1
2
Amtrak stations nearby
1
3
FAA registered aircraft
739
205
FAA registered aircraft manufacturers and dealers
18
0
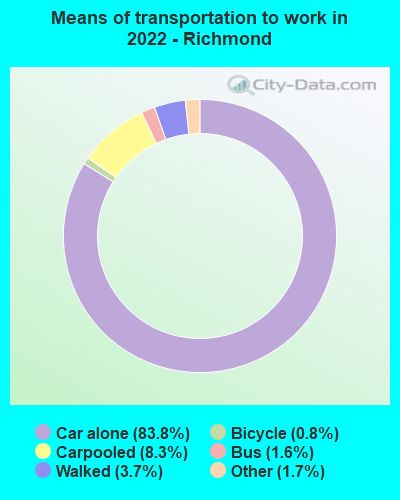
Means of transportation to work
Type
Indianapolis
Richmond
Bicycle
0.5%
0.8%
Bus
1.2%
2.8%
Carpooled
8.5%
7.5%
Car alone
87.3%
84.5%
Motorcycle
0%
0.1%
Streetcar
0%
0.1%
Walked
1.6%
2.7%
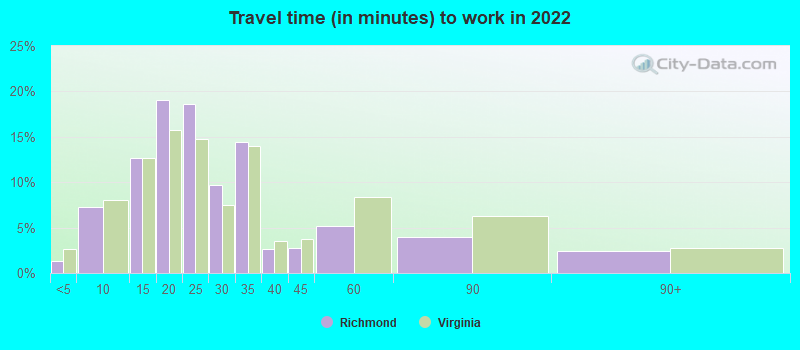
Average travel time to work
Type
Indianapolis
Richmond
Average
28.1 min
27.7 min
Other means
22.5 min
21.4 min
Public transportation
40.2 min
36.2 min
Private vehicle occupancy
Type
Indianapolis
Richmond
Average
1.2
1.2
Drove alone
88.2%
88.4%
In 2 person carpool
9.4%
8%
In 3 person carpool
1.3%
0.4%
In 4 person carpool
0.5%
2.2%
In 5-6 person carpool
0.4%
0.7%
In 7+ person carpool
0.1%
0.3%
How many people usually rode to work in the car, truck or van.
Real Estate
The real estate market in both cities is currently competitive. Indianapolis offers more affordable housing options, with a median home price significantly below the national average. Richmond sees higher home prices, but with more potential for home value appreciation.
Neighborhoods
Both cities are comprised of various neighborhoods each with its own unique charm and characteristics. Indianapolis neighborhoods like Meridian-Kessler and Broad Ripple offer a mix of urban and suburban feel. Richmond neighborhoods such as The Fan and the Church Hill are known for their historic homes and quaint charm.
Houses and residents
Type
Indianapolis
Richmond
Houses
399,820
112,806
Average household size (people)
2.4
2.2
Median year apartment built
1977
1966
Median year house/condo built
1971
1952
Length of stay in the house since moving in
13 years
13.7 years
Houses occupied
358,150 (89.6%)
99,929 (88.6%)
Houses occupied by owners
201,149 (56.2%)
44,985 (45%)
Houses occupied by renters
157,001 (43.8%)
54,944 (55%)
Median rent asked for vacant for-rent units
$876.58
$2,145
Median monthly housing costs
$980
$1,176
Median price asked for vacant for-sale houses and condos
$283,027
$789,890
Estimated median house or condo value
$188,700
$311,700
Median numbers of rooms
5.5
5
Median number of rooms in apartments
4.3
4.1
Median number of rooms in houses and condos
6.5
6.7
Median house price - detached houses
$231,490
$377,153
Median house price - in 2-unit structures
$257,253
$414,611
Median house price - in 3-to-4-unit structures
$240,688
$581,178
Median house price - in 5 or more unit structures
$247,275
$336,796
Median house price - mobile homes
$58,413
$383,025
Median house price - Townhouses or other attached units
$222,424
$485,625
Median house price - All housing units
$229,666
$387,051
Median house age
48
64
Renting percentage
44.2%
56.9%
Housing density (houses/condos per square mile)
1,106.1
1,877.9
House value disparities
36.1%
35.4%
Household income disparities
44.4%
49.3%
Median household income for houses/condes with a mortgage
$86,008
$88,018
Median household income for apartments without a mortgage
$61,922
$55,453
Housing units without a mortgage
4,552 (3.2%)
666 (2.1%)
Housing units with both a second mortgage and home equity loan
9,787 (6.8%)
1,789 (5.5%)
Housing units with a mortgage
138,622 (96.8%)
31,656 (97.9%)
Housing units with a home equity loan
271 (0.2%)
92 (0.3%)
Housing units with a second mortgage
12,987 (9.1%)
2,135 (6.6%)
House/condo owner moved in on average (years ago)
11
10
House/condo renter moved in on average (years ago)
1
1
Housing units lacking complete kitchen facilities
3.4%
1.9%
Housing units lacking complete plumbing facilities
1.1%
1.2%
Housing units in structures
Housing units in structures
Indianapolis
Richmond
One, detached
59.0%
46.3%
One, attached
9.2%
6.4%
Two
2.5%
5.8%
3 or 4
6.2%
7.5%
5 to 9
7.7%
8.0%
10 to 19
6.3%
6.3%
20 to 49
3.1%
6.8%
50 or more
5.0%
12.7%
Mobile homes
1.0%
0.2%
Median real estate property taxes paid for housing units
Self-employed workers in own not incorporated business
17,131
6,345
State government workers
15,502
8,436
Unpaid family workers
1,601
234
Industries and Occupations
The industries in Indianapolis are primarily centered around healthcare, manufacturing, and retail trade. Richmond has a significant government presence due to the state capital, with additional employment in finance, manufacturing, and retail. The employment opportunities vary between the two cities, given their industry presence.
Indianapolis has an excellent healthcare system and is home to Indiana University Health, a nationally ranked hospital. Richmond also offers good healthcare with the Virginia Commonwealth University Medical Center ranking highly for patient care.
Health (county statistics)
Type
Indianapolis
Richmond
General health status score of residents in this county from 1 (poor) to 5 (excellent)
Indianapolis is known for its easy-to-navigate infrastructure, with its grid-like pattern and numbered streets. Richmond offers an mix of modern construction and historical architecture, with an easy-to-navigate downtown area. Both cities have flooding risks in specific areas, so it's best to research if relocating.
Infrastructure
Type
Indianapolis
Richmond
Hospitals
76
25
TV stations
19
13
Arenas or stadiums
3
2
Bank branches located here
259
172
Bank institutions located here
27
27
Main business address for public companies
28
23
Drinking water stations with no reported violations in the past
1
8
Drinking water stations with reported violations in the past
HMDA - Conventional home purchase loans - Applications denied
Year
Indianapolis
Richmond
1999
3,358
0
2000
3,562
0
2001
2,649
0
2002
1,915
310
2003
2,519
418
2004
3,702
645
2005
6,057
904
2006
5,811
1,222
2007
3,456
898
2008
1,247
323
2009
565
132
Culture and Food
Indianapolis offers a vibrant food scene and rich culture with an emphasis on automobile racing history. The city hosts the world-famous Indy 500. Richmond offers a unique blend of Southern charm with a thriving arts scene, historic landmarks, and a wide range of food options from Southern comfort to international cuisine.
Sports Teams
Indianapolis is home to many professional sports teams, including the NFL's Indianapolis Colts and NBA's Indiana Pacers. Richmond doesn’t have any professional major league teams, but offers minor league sports and is a great city for college sports fans, hosting Virginia Commonwealth University teams.


 Indianapolis, IN and
  Richmond, VA : 493.5 miles