Indianapolis, IN, and St. Louis, MO, resident in the heartland of the United States, offer significantly differing living experiences. From comparing their crime rate to weather patterns and cost of living, various variables influence one's decision to relocate or pay a short visit. The subtleties of their local economies, tax structure, and cultural milieu also form a crucial part of understanding these cities. This comprehensive comparison aims to shed light on these aspects, offering insights into life in Indianapolis and St. Louis.
Distance between
Indianapolis, IN and
St. Louis, MO : 233.5 miles
Indianapolis's population is larger by 201%. Its population has grown by 100,169 people (12.8%) since 2000. The population of St. Louis has decreased by 54,879 people (15.8%) during that time.
St. Louis has been grappling with high crime rates for a long time, ranking above the national average, which is one of the city's significant challenges. The St. Louis Police Department is making efforts to improve safety via numerous initiatives. Indianapolis, on the other hand, records a lower crime rate in comparison, but it is still higher than the national average. Both cities' focus on safety reforms, with neighborhood watch schemes and improved policing, is promising.
City-data.com crime index counts serious crimes and violent crime more heavily. It adjusts for the number of visitors and daily workers commuting into cities. (higher means more crime, U.S. average = 301.1)
City-data.com crime index counts serious crimes and violent crime more heavily. It adjusts for the number of visitors and daily workers commuting into cities. (higher means more crime, U.S. average = 301.1)
Sex Offenders
According to our data, there are 82 registered sex offenders living in Indianapolis and 2,528 registered sex offenders living in . The ratio of residents to sex offenders in Indianapolis is 10,396 to 1; the ratio in St. Louis is 123 to 1. The number of registered sex offenders compared to the number of residents is a lot smaller in Indianapolis than in St. Louis.
Cost of Living
The cost of living in Indianapolis is generally lower than in St. Louis, including housing, groceries, and transportation costs. These lower living costs make Indianapolis an attractive option for both permanent residents and tourists.
Income Tax
Indianapolis residents pay a flat state income tax rate of 3.23%, and a county rate varies. In contrast, Missouri's income tax is based on a progressive system, and St. Louis adds an additional 1% earnings tax.
Property Tax
Property tax rates in Indianapolis are usually lower than those in St. Louis. However, this can vary based on the specific location and property value.
Sales Tax
The overall sales tax in Indy is 7%, with no city tax. St. Louis, MO, has a blended sales tax rate of 8.68%, reflecting state, county, and city rates.
Income
Type
Indianapolis
St. Louis
Estimated median household income
$58,479
$49,965
Estimated per capita income
$32,792
$33,810
Cost of living index (U.S. average is 100)
87.7
96.5
If you make $50,000 in Indianapolis, you will have to make $55,017 in St. Louis to maintain the same standard of living.
Geographical Conditions
Indianapolis is characterized by flat to gentle rolling terrain, located in the Central Till Plains. St. Louis lies at the junction of the Mississippi and Missouri rivers, offering diverse landscapes, including rolling hills and river lowlands.
Both cities have multiple public and private schooling options. Indianapolis boasts of higher high school graduation rates, but St. Louis has a higher population with a bachelor's degree or higher. Indianapolis is home to renowned universities like Butler University and Indiana University-Purdue University Indianapolis, while St. Louis hosts Washington University and St. Louis University.
Both cities have diversified economies, with healthcare and social services, manufacturing, retail trade, and educational services as leading industries in Indianapolis. However, St. Louis has a more diversified economic base, including healthcare, aerospace, transportation, and education.
Biggest Employers
Indianapolis hosts the headquarters of several Fortune 500 companies, including Anthem Inc. and Eli Lilly. The Federal government and Wal-Mart are the largest employers in St. Louis.
There were 1,221 building permits issued in Indianapolis in 2012 (704 more than in 2011) compared to 146 building permits issued in St. Louis in 2012 (105 more than in 2011).
In Indianapolis (Marion County), 60.1% voted for Democrats and 37.9% for Republicans in 2012 Presidential Election. In St. Louis (St. Louis city), 82.4% voted for Democrats and 15.9% for Republicans.
Elections
Type
Democrats
Republicans
Other
Year
Indianapolis
St. Louis
Indianapolis
St. Louis
Indianapolis
St. Louis
2020
63.7%
82.4%
34.5%
16.1%
1.9%
1.6%
2016
58.2%
79.0%
35.6%
15.8%
6.2%
5.2%
2012
60.1%
82.4%
37.9%
15.9%
2.0%
1.6%
2008
63.8%
83.8%
35.4%
15.5%
0.8%
0.7%
2004
50.6%
80.4%
48.7%
19.2%
0.7%
0.3%
2000
48.0%
77.5%
49.3%
19.9%
2.8%
2.6%
1996
44.6%
74.8%
47.8%
18.1%
7.7%
7.1%
Breakdown of population affiliated with a religious congregation
Type
Adherents
Congregations
Religion
Indianapolis
St. Louis
Indianapolis
St. Louis
CATHOLIC CHURCH
11.1%
15.4%
4.6%
9.5%
SOUTHERN BAPTIST CONVENTION
1.6%
2.5%
5.7%
9.0%
AMERICAN BAPTIST CHURCHES IN THE USA
1.2%
1.8%
3.4%
2.4%
LUTHERAN CHURCH
0.8%
2.2%
1.5%
6.1%
EVANGELICAL LUTHERAN CHURCH IN AMERICA
0.5%
0.2%
1.6%
1.0%
SEVENTH DAY ADVENTIST CHURCH
0.5%
0.3%
1.6%
0.5%
EPISCOPAL CHURCH
0.4%
0.5%
1.1%
1.5%
MUSLIM ESTIMATE
0.3%
1.1%
1.1%
2.4%
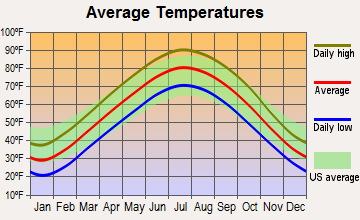
Weather
Both cities experience all four seasons. Indianapolis, however, often has slightly milder summers and winters compared to St. Louis. Comfort index, which considers humidity levels, ranks Indianapolis higher, implying more comfortable year-round weather than St. Louis.
Weather and climate
Type
Indianapolis
St. Louis
Temperature - Average
52.1°F
56.5°F
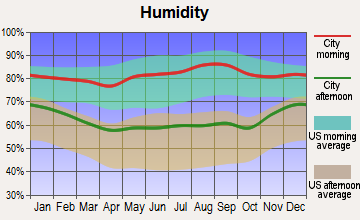
Humidity - Average morning or afternoon humidity
77%
74.8%
Humidity - Differences between morning and afternoon humidity
31%
32%
Humidity - Maximum monthly morning or afternoon humidity
86%
85%
Humidity - Minimum monthly morning or afternoon humidity
55%
53%
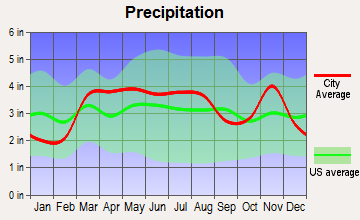
Precipitation - Yearly average
40.6 in
39 in
Snowfall - Yearly average
51 in
37.2 in
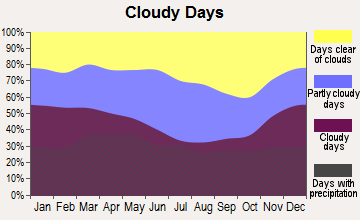
Clouds - Number of days clear of clouds
14.7%
16.7%
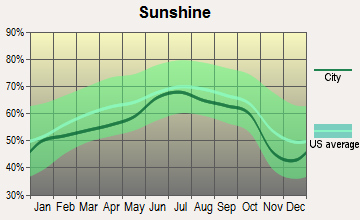
Sunshine amount - Average
56.2%
62.2%
Sunshine amount - Differences during a year
33%
30%
Sunshine amount - Maximum monthly
65%
71%
Sunshine amount - Minimum monthly
32%
41%
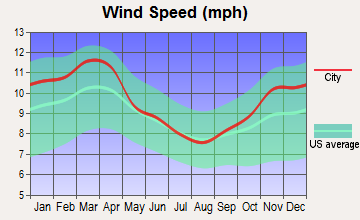
Wind speed - Average
10.3 mph
9.8 mph
Average climate in Indianapolis, Indiana
Average climate in St. Louis, Missouri
Air pollution
Type
AQI
CO
NO2
OZONE
PB
PM10
PM25
SO2
Year
Indianapolis
St. Louis
Indianapolis
St. Louis
Indianapolis
St. Louis
Indianapolis
St. Louis
Indianapolis
St. Louis
Indianapolis
St. Louis
Indianapolis
St. Louis
Indianapolis
St. Louis
2018
94
101
0.58
0.26
13.2
10.7
23.1
27.5
N/A
N/A
18.2
19.7
10.4
9.8
0.3
0.8
2017
87
90
0.82
0.25
12.4
10.4
23.0
28.5
N/A
N/A
17.6
16.2
10.1
8.0
0.4
1.4
2016
91
96
0.62
0.29
13.0
11.1
22.5
25.8
N/A
N/A
18.0
15.5
9.9
8.5
0.4
1.2
2015
89
97
0.73
0.28
14.9
11.8
22.9
22.2
N/A
N/A
19.7
16.6
9.9
10.5
1.1
1.6
2014
100
97
0.62
0.27
16.1
12.2
25.1
25.5
N/A
N/A
20.6
17.8
12.1
10.5
3.2
1.8
2013
94
92
0.69
0.27
11.5
12.2
26.3
26.2
N/A
N/A
19.9
16.3
12.8
10.6
2.6
2.1
2012
103
114
0.65
0.27
10.4
14.4
25.7
27.9
N/A
N/A
20.8
17.5
12.9
10.2
2.9
2.3
2011
105
107
0.68
0.27
11.3
13.2
22.9
27.0
N/A
N/A
N/A
17.3
16.3
12.4
2.4
2.7
2010
101
110
0.54
0.31
12.7
12.8
21.6
23.1
N/A
N/A
N/A
16.2
15.9
12.9
3.3
3.3
2009
97
101
0.73
0.31
11.4
12.5
23.2
22.2
N/A
0.039
N/A
21.6
13.8
12.4
1.9
2.8
2008
91
98
0.62
0.32
11.5
12.9
N/A
22.9
0.010
0.054
N/A
32.4
13.2
12.8
3.0
2.6
2007
103
125
0.69
0.37
13.1
14.1
N/A
24.3
0.011
0.055
N/A
38.8
14.9
14.6
3.6
2.9
2006
95
109
0.59
0.38
14.5
15.2
N/A
23.3
0.009
0.044
N/A
38.2
14.5
14.7
3.6
3.1
2005
121
110
0.65
0.39
15.2
16.3
N/A
24.4
0.014
0.056
N/A
41.4
18.0
N/A
4.3
4.1
2004
104
92
0.62
0.49
15.8
20.0
N/A
19.6
0.010
0.013
N/A
38.3
15.1
N/A
4.6
3.7
2003
113
106
0.67
0.49
16.6
19.6
N/A
21.7
0.010
0.044
N/A
37.8
15.8
N/A
4.2
3.7
2002
125
117
0.76
0.56
17.4
21.7
N/A
21.1
0.009
0.022
N/A
45.4
16.8
N/A
3.9
4.4
2001
105
100
0.81
0.57
16.6
22.4
N/A
20.4
0.031
0.057
N/A
46.6
16.3
N/A
3.8
5.0
2000
98
98
0.87
0.78
17.3
23.8
N/A
20.6
N/A
0.057
N/A
N/A
N/A
N/A
4.5
5.5
Natural disasters
Type
Indianapolis
St. Louis
Tornado activity compared to U.S. average
226.7%
182.4%
Earthquake activity compared to U.S. average
179.6%
413.3%
Natural disasters compared to U.S. average
16%
0%
Transportation
Both cities offer decent public transportation options. Indianapolis has IndyGo, a publicly funded citywide bus system, and a biking-sharing program. St. Louis provides MetroBus, MetroLink light rail services, and several bike-sharing services as well.
Transport
Type
Indianapolis
St. Louis
Amtrak stations
1
1
Amtrak stations nearby
1
2
FAA registered aircraft
739
0
FAA registered aircraft manufacturers and dealers
18
0
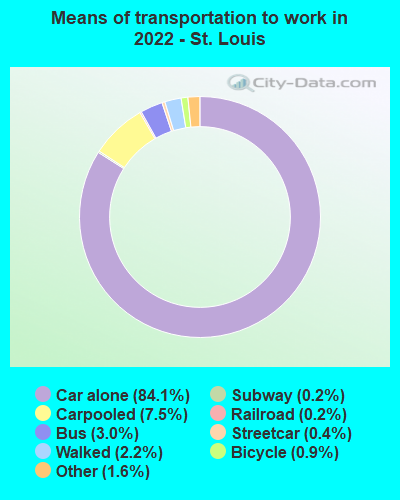
Means of transportation to work
Type
Indianapolis
St. Louis
Bicycle
0.5%
0.5%
Bus
1.2%
3.7%
Carpooled
8.5%
7.5%
Car alone
87.3%
83.9%
Railroad
0%
0.3%
Streetcar
0%
0.2%
Subway
0%
0.3%
Taxicab
0.1%
0.3%
Walked
1.6%
2.5%
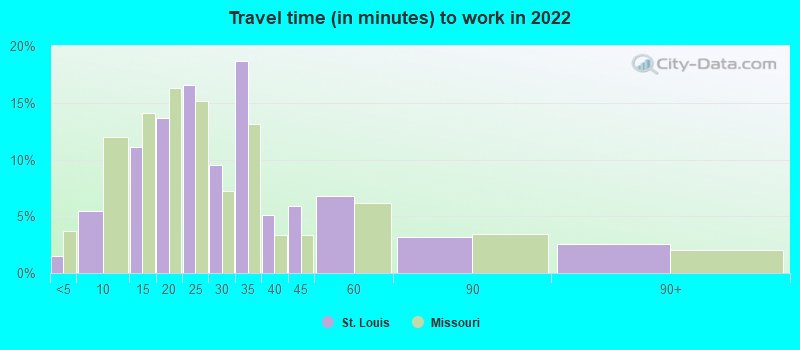
Average travel time to work
Type
Indianapolis
St. Louis
Average
28.1 min
29.4 min
Other means
22.5 min
22.9 min
Public transportation
40.2 min
42.8 min
Private vehicle occupancy
Type
Indianapolis
St. Louis
Average
1.2
1.1
Drove alone
88.2%
91.6%
In 2 person carpool
9.4%
6.5%
In 3 person carpool
1.3%
1%
In 4 person carpool
0.5%
0.1%
In 5-6 person carpool
0.4%
0.1%
In 7+ person carpool
0.1%
0.7%
How many people usually rode to work in the car, truck or van.
Real Estate
Home prices in Indianapolis are generally lower than in St. Louis, and have seen a more substantial appreciation rate in recent years. However, the real-estate market has remained more stable in St. Louis.
Neighborhoods
Indianapolis neighborhoods, such as Downtown, Broad Ripple, and Fountain Square, provide a welcoming and diverse living environment. St. Louis offers eclectic neighborhoods like Central West End, Tower Grove, and The Hill, each with a unique charm.
Houses and residents
Type
Indianapolis
St. Louis
Houses
399,820
173,493
Average household size (people)
2.4
2.2
Median year apartment built
1977
1943
Length of stay in the house since moving in
13 years
14.2 years
Houses occupied
358,150 (89.6%)
139,736 (80.5%)
Houses occupied by owners
201,149 (56.2%)
63,653 (45.6%)
Houses occupied by renters
157,001 (43.8%)
76,083 (54.4%)
Median rent asked for vacant for-rent units
$876.58
$923.98
Median monthly housing costs
$980
$883
Median price asked for vacant for-sale houses and condos
$283,027
$56,913
Estimated median house or condo value
$188,700
$170,800
Median numbers of rooms
5.5
4.8
Median number of rooms in apartments
4.3
4
Median number of rooms in houses and condos
6.5
5.9
Median house price - detached houses
$231,490
$196,007
Median house price - in 2-unit structures
$257,253
$166,673
Median house price - in 3-to-4-unit structures
$240,688
$155,363
Median house price - in 5 or more unit structures
$247,275
$260,843
Median house price - mobile homes
$58,413
$35,054
Median house price - Townhouses or other attached units
$222,424
$272,667
Median house price - All housing units
$229,666
$200,041
Median house age
48
2,021
Renting percentage
44.2%
54.6%
Housing density (houses/condos per square mile)
1,106.1
2,801.7
House value disparities
36.1%
38.7%
Household income disparities
44.4%
48.3%
Median household income for houses/condes with a mortgage
$86,008
$87,762
Median household income for apartments without a mortgage
$61,922
$55,824
Housing units without a mortgage
4,552 (3.2%)
1,236 (2.9%)
Housing units with both a second mortgage and home equity loan
9,787 (6.8%)
2,537 (6%)
Housing units with a mortgage
138,622 (96.8%)
41,018 (97.1%)
Housing units with a home equity loan
271 (0.2%)
188 (0.4%)
Housing units with a second mortgage
12,987 (9.1%)
3,349 (7.9%)
House/condo owner moved in on average (years ago)
11
10
House/condo renter moved in on average (years ago)
1
2
Housing units lacking complete kitchen facilities
3.4%
9.2%
Housing units lacking complete plumbing facilities
1.1%
5.8%
Housing units in structures
Housing units in structures
Indianapolis
St. Louis
One, detached
59.0%
43.2%
One, attached
9.2%
4.1%
Two
2.5%
14.2%
3 or 4
6.2%
13.5%
5 to 9
7.7%
4.9%
10 to 19
6.3%
2.2%
20 to 49
3.1%
3.8%
50 or more
5.0%
13.5%
Mobile homes
1.0%
0.5%
Median real estate property taxes paid for housing units
Self-employed workers in own not incorporated business
17,131
8,126
State government workers
15,502
2,962
Unpaid family workers
1,601
315
Industries and Occupations
Indianapolis's primary industries include healthcare, social assistance, manufacturing, retail trade, and education. On the other hand, St. Louis's key economic sectors are healthcare and social assistance, educational services, and retail trade. Professional, scientific, and technical services are also quite prevalent in St. Louis.
Indianapolis is home to several high-ranking hospitals, including IU Health Academic Health Center. St. Louis has Barnes-Jewish Hospital/Washington University, one of the largest medical centers by bed count in the U.S.
Health (county statistics)
Type
Indianapolis
St. Louis
General health status score of residents in this county from 1 (poor) to 5 (excellent)
Indianapolis boasts of a well-connected network of highways, making it easy to commute. St. Louis, on the other hand, has both air, road, and riverine infrastructure but has struggled with aging and maintenance issues of late.
HMDA - Conventional home purchase loans - Applications denied
Year
Indianapolis
St. Louis
1999
3,358
0
2000
3,562
0
2001
2,649
0
2002
1,915
0
2003
2,519
1,583
2004
3,702
2,101
2005
6,057
2,853
2006
5,811
3,391
2007
3,456
2,022
2008
1,247
841
2009
565
247
Culture and Food
Both cities boast a rich cultural scene. Indianapolis is well-known for sports-related activities and is home to Indiana Repertory Theatre, Indianapolis Symphony Orchestra, and Eiteljorg Museum. St. Louis is famous for its blues music, BBQ cuisine, and iconic Gateway Arch. Both cities are lively with multiple annual festivals and events.
Sports Teams
Indianapolis is famous for motor racing (Indianapolis 500), along with NFL's Indianapolis Colts and NBA's Indiana Pacers. St. Louis delivers with MLB's St. Louis Cardinals, NHL's St. Louis Blues, and the NFL's St. Louis Rams (before their move to LA).


 Indianapolis, IN and
  St. Louis, MO : 233.5 miles