When considering a relocation to either Indianapolis, Indiana or St. Paul, Minnesota, there are many factors to explore. Both cities display a distinctive charm and local culture that appeal to visitors and residents alike, but hold differences in aspects such as cost of living, education, infrastructure, industries and the overall living conditions. This comprehensive comparison will cover areas such as crime, weather, cost of living, education, and more to help make the choice easier.
Distance between
Indianapolis, IN and
St. Paul, MN : 503.3 miles
Indianapolis's population is larger by 187%. Its population has grown by 100,169 people (12.8%) since 2000. The population of St. Paul has grown by 20,042 people (7.0%) during that time.
The crime rates in both Indianapolis and St. Paul can vary greatly depending on specifics. Overall, Indianapolis generally has a higher crime rate than St. Paul, with violent crimes being more prevalent. Safety can vary widely, however, based on the neighborhood, with some being very safe and others having higher crime rates. St. Paul, while having less crime overall, is not crime-free either. Tourists and residents alike should always take precautions to ensure their safety. The police presence in both cities is robust and committed to providing a safe environment.
City-data.com crime index counts serious crimes and violent crime more heavily. It adjusts for the number of visitors and daily workers commuting into cities. (higher means more crime, U.S. average = 301.1)
City-data.com crime index counts serious crimes and violent crime more heavily. It adjusts for the number of visitors and daily workers commuting into cities. (higher means more crime, U.S. average = 301.1)
Sex Offenders
According to our data, there are 82 registered sex offenders living in Indianapolis and 90 registered sex offenders living in . The ratio of residents to sex offenders in Indianapolis is 10,396 to 1; the ratio in St. Paul is 3,360 to 1. The number of registered sex offenders compared to the number of residents is a lot smaller in Indianapolis than in St. Paul.
Cost of Living
The cost of living in Indianapolis is generally lower than in St. Paul, with cheaper housing, groceries, health care, and utilities. While salaries can be lower in Indianapolis, the lower cost of living generally makes up for this. Despite St. Paul having a higher cost of living, it might well balanced with the higher wages paid in certain sectors and the quality of life being generally higher.
Income Tax
For state income tax, Indianapolis residents pay a flat rate of 3.23%, while St. Paul residents have a progressive income tax ranging from 5.35% to 9.85% depending on income level.
Property Tax
Property taxes also differ between the two cities, with residents of St. Paul generally paying higher property taxes, which are based on the assessed value of their property. In contrast, Indianapolis has a lower property tax rate, making it more affordable for homeowners.
Sales Tax
Current sales tax rates are 7% for Indianapolis based in Indiana, and 7.875% for St. Paul based in Minnesota. Both cities levy their sales taxes on the sales of certain goods and services.
Income
Type
Indianapolis
St. Paul
Estimated median household income
$58,479
$66,098
Estimated per capita income
$32,792
$36,313
Cost of living index (U.S. average is 100)
87.7
114.5
If you make $50,000 in Indianapolis, you will have to make $65,279 in St. Paul to maintain the same standard of living.
Geographical Conditions
Indianapolis is generally flat, lying in the East North Central region of the Midwest, while St. Paul is more diverse with its geography, featuring rolling hills and riverfront views given its location along the Mississippi River.
Both Indianapolis and St. Paul boast strong educational systems. Indianapolis has a strong public system and several highly-rated private schools, with top colleges such as Indiana University-Purdue University Indianapolis (IUPUI) located within the city. St. Paul is known for its strong public school system and award-winning colleges, including Macalester College and the University of St. Thomas.
The economy in both cities is diversified with a focus on different sectors. Jobs in Indianapolis are mainly centered around healthcare, education and manufacturing. In St. Paul, jobs are prevalent in healthcare, education, and other skilled professions such as management and law. Both cities, however, offer a relatively strong job market.
Biggest Employers
In Indianapolis, the largest employers are Indiana University Health, Eli Lilly and Company, and Community Health Network. In St. Paul, the biggest employers include the State of Minnesota, UnitedHealth Group, and U.S. Bancorp.
There were 1,221 building permits issued in Indianapolis in 2012 (704 more than in 2011) compared to 77 building permits issued in St. Paul in 2012 (46 more than in 2011).
In Indianapolis (Marion County), 60.1% voted for Democrats and 37.9% for Republicans in 2012 Presidential Election. In St. Paul (Ramsey County), 66.6% voted for Democrats and 31.2% for Republicans.
Elections
Type
Democrats
Republicans
Other
Year
Indianapolis
St. Paul
Indianapolis
St. Paul
Indianapolis
St. Paul
2020
63.7%
71.8%
34.5%
26.3%
1.9%
1.9%
2016
58.2%
65.2%
35.6%
26.0%
6.2%
8.8%
2012
60.1%
66.6%
37.9%
31.2%
2.0%
2.2%
2008
63.8%
66.2%
35.4%
32.2%
0.8%
1.6%
2004
50.6%
63.5%
48.7%
35.9%
0.7%
0.7%
2000
48.0%
57.0%
49.3%
36.1%
2.8%
7.0%
1996
44.6%
58.7%
47.8%
29.3%
7.7%
12.0%
Breakdown of population affiliated with a religious congregation
Type
Adherents
Congregations
Religion
Indianapolis
St. Paul
Indianapolis
St. Paul
CATHOLIC CHURCH
11.1%
24.5%
4.6%
11.5%
SOUTHERN BAPTIST CONVENTION
1.6%
0.2%
5.7%
1.8%
AMERICAN BAPTIST CHURCHES IN THE USA
1.2%
0.7%
3.4%
3.4%
LUTHERAN CHURCH
0.8%
1.4%
1.5%
3.7%
EVANGELICAL LUTHERAN CHURCH IN AMERICA
0.5%
7.8%
1.6%
14.2%
SEVENTH DAY ADVENTIST CHURCH
0.5%
0.1%
1.6%
1.6%
EPISCOPAL CHURCH
0.4%
1.1%
1.1%
3.2%
MUSLIM ESTIMATE
0.3%
0.8%
1.1%
1.3%
SALVATION ARMY
0.3%
0.4%
0.3%
0.8%
WISCONSIN EVANGELICAL LUTHERAN SYNOD
0.0%
0.6%
0.1%
2.1%
Weather
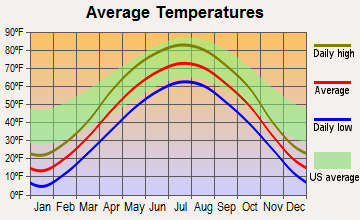
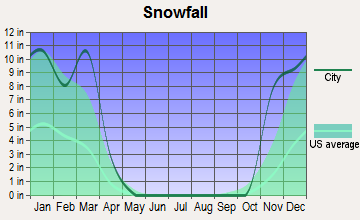
The weather in both Indianapolis and St. Paul can be quite varied. Indianapolis experiences a continental climate, with hot summers and cold winters. Snowfall in winter is frequent but usually not as heavy as it is in St. Paul. St. Paul experiences a cold continental climate, with freezing winters and mild to hot summers. Winter can be severe with significant snowfall, making this a consideration for anyone not fond of cold weather.
Weather and climate
Type
Indianapolis
St. Paul
Temperature - Average
52.1°F
45.6°F
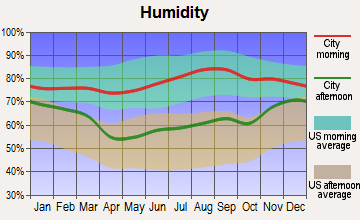
Humidity - Average morning or afternoon humidity
77%
74.9%
Humidity - Differences between morning and afternoon humidity
31%
33%
Humidity - Maximum monthly morning or afternoon humidity
86%
84%
Humidity - Minimum monthly morning or afternoon humidity
55%
51%
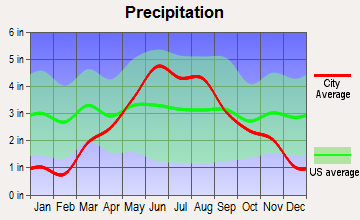
Precipitation - Yearly average
40.6 in
31.8 in
Snowfall - Yearly average
51 in
98.6 in
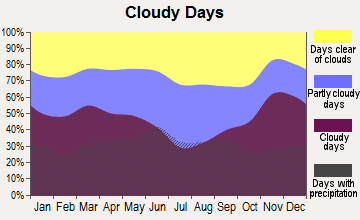
Clouds - Number of days clear of clouds
14.7%
15.8%
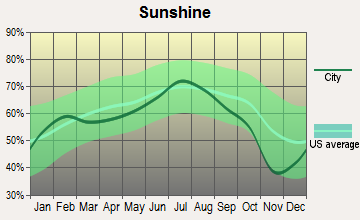
Sunshine amount - Average
56.2%
61.8%
Sunshine amount - Differences during a year
33%
37%
Sunshine amount - Maximum monthly
65%
74%
Sunshine amount - Minimum monthly
32%
37%
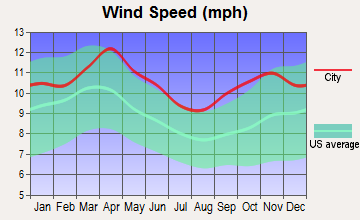
Wind speed - Average
10.3 mph
10.5 mph
Average climate in Indianapolis, Indiana
Average climate in St. Paul, Minnesota
Air pollution
Type
AQI
CO
NO2
OZONE
PB
PM10
PM25
SO2
Year
Indianapolis
St. Paul
Indianapolis
St. Paul
Indianapolis
St. Paul
Indianapolis
St. Paul
Indianapolis
St. Paul
Indianapolis
St. Paul
Indianapolis
St. Paul
Indianapolis
St. Paul
2018
94
81
0.58
0.24
13.2
11.6
23.1
28.2
N/A
N/A
18.2
20.4
10.4
8.5
0.3
1.0
2017
87
71
0.82
0.26
12.4
11.9
23.0
27.9
N/A
N/A
17.6
19.5
10.1
7.5
0.4
1.2
2016
91
76
0.62
0.28
13.0
11.2
22.5
26.7
N/A
N/A
18.0
18.2
9.9
6.8
0.4
1.2
2015
89
80
0.73
0.28
14.9
12.4
22.9
27.8
N/A
N/A
19.7
21.3
9.9
7.5
1.1
1.0
2014
100
83
0.62
0.25
16.1
14.2
25.1
26.8
N/A
N/A
20.6
23.1
12.1
8.1
3.2
0.9
2013
94
81
0.69
N/A
11.5
11.6
26.3
32.1
N/A
N/A
19.9
22.6
12.8
7.2
2.6
0.9
2012
103
80
0.65
N/A
10.4
7.7
25.7
29.0
N/A
N/A
20.8
25.6
12.9
8.3
2.9
0.2
2011
105
90
0.68
0.22
11.3
7.8
22.9
30.1
N/A
N/A
N/A
25.4
16.3
10.0
2.4
0.3
2010
101
101
0.54
N/A
12.7
9.6
21.6
28.3
N/A
0.002
N/A
24.7
15.9
11.1
3.3
0.5
2009
97
103
0.73
N/A
11.4
7.4
23.2
N/A
N/A
0.002
N/A
21.4
13.8
11.0
1.9
1.1
2008
91
92
0.62
N/A
11.5
8.8
N/A
N/A
0.010
0.004
N/A
18.3
13.2
11.0
3.0
1.0
2007
103
102
0.69
N/A
13.1
9.2
N/A
N/A
0.011
0.004
N/A
21.6
14.9
11.4
3.6
0.6
2006
95
88
0.59
N/A
14.5
9.5
N/A
N/A
0.009
0.007
N/A
20.5
14.5
10.4
3.6
1.2
2005
121
107
0.65
N/A
15.2
12.3
N/A
N/A
0.014
0.004
N/A
22.0
18.0
12.1
4.3
1.5
2004
104
103
0.62
N/A
15.8
11.0
N/A
N/A
0.010
0.004
N/A
23.9
15.1
11.9
4.6
2.3
2003
113
114
0.67
N/A
16.6
12.5
N/A
N/A
0.010
0.004
N/A
25.9
15.8
13.0
4.2
2.2
2002
125
95
0.76
0.42
17.4
15.7
N/A
N/A
0.009
0.006
N/A
N/A
16.8
11.1
3.9
1.1
2001
105
82
0.81
0.75
16.6
17.5
N/A
32.4
0.031
0.011
N/A
N/A
16.3
9.3
3.8
1.1
2000
98
68
0.87
0.75
17.3
16.6
N/A
31.2
N/A
0.009
N/A
N/A
N/A
N/A
4.5
1.4
Natural disasters
Type
Indianapolis
St. Paul
Tornado activity compared to U.S. average
226.7%
129.5%
Earthquake activity compared to U.S. average
179.6%
43.1%
Natural disasters compared to U.S. average
16%
18%
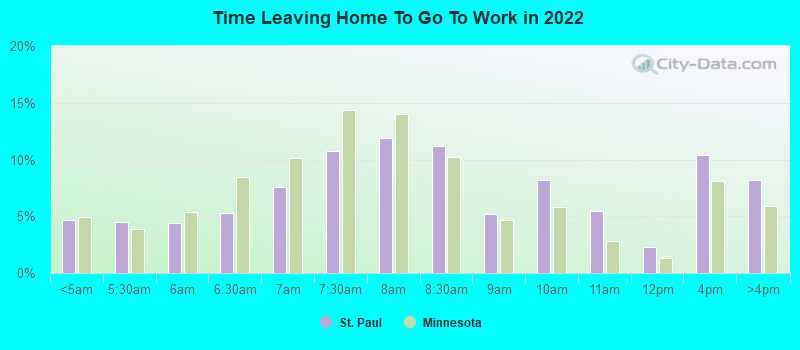
Transportation
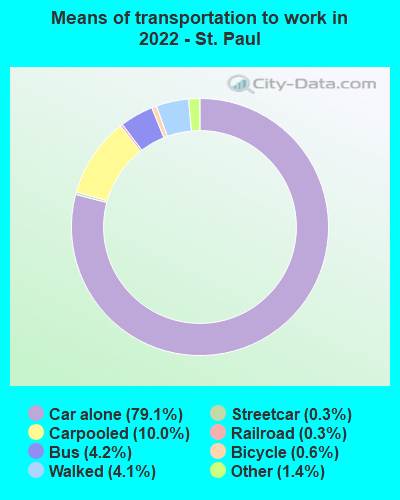
Both cities have robust public transportation systems, but commuting options vary. Indianapolis offers a network of buses and a bike-share program, while St. Paul has an extensive light rail and bus system. For those commuting, St. Paul's average commute time is typically shorter than Indianapolis’.
Transport
Type
Indianapolis
St. Paul
Amtrak stations
1
1
Amtrak stations nearby
1
1
FAA registered aircraft
739
0
FAA registered aircraft manufacturers and dealers
18
0
Means of transportation to work
Type
Indianapolis
St. Paul
Bicycle
0.5%
1%
Bus
1.2%
4.4%
Carpooled
8.5%
9.4%
Car alone
87.3%
79.9%
Railroad
0%
0.2%
Taxicab
0.1%
0.2%
Walked
1.6%
3.7%
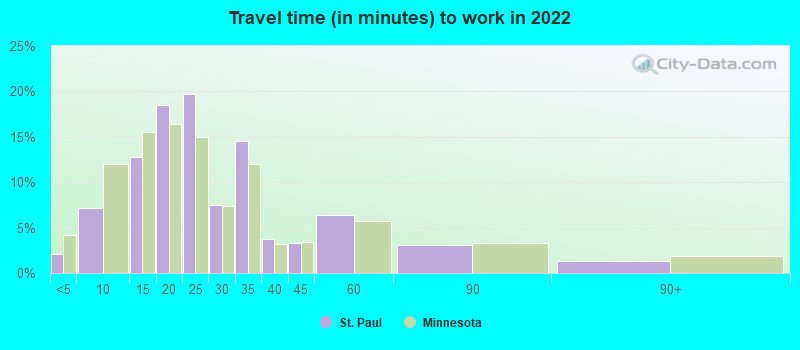
Average travel time to work
Type
Indianapolis
St. Paul
Average
28.1 min
25.8 min
Other means
22.5 min
20.7 min
Public transportation
40.2 min
34.4 min
Private vehicle occupancy
Type
Indianapolis
St. Paul
Average
1.2
1.2
Drove alone
88.2%
87.5%
In 2 person carpool
9.4%
9.4%
In 3 person carpool
1.3%
2%
In 4 person carpool
0.5%
0.6%
In 5-6 person carpool
0.4%
0.1%
In 7+ person carpool
0.1%
0.3%
How many people usually rode to work in the car, truck or van.
Real Estate
Real estate in St. Paul tends to be more expensive than in Indianapolis. Both cities, however, offer a variety of housing styles in urban, suburban, and rural settings. For potential buyers and renters, Indianapolis typically provides more affordable options, whereas St. Paul offers a variety of high-end and luxury homes.
Neighborhoods
Both Indianapolis and St. Paul offer diverse neighborhoods to match the preferences of any resident or visitor. In Indianapolis, neighborhoods like Fountain Square and Broad Ripple Village offer unique culture and art scenes. In St. Paul, neighborhoods like Macalester-Groveland and Summit Hill are known for their historic charm and community engagement.
Houses and residents
Type
Indianapolis
St. Paul
Houses
399,820
131,275
Average household size (people)
2.4
2.5
Median year apartment built
1977
1966
Length of stay in the house since moving in
13 years
12.8 years
Houses occupied
358,150 (89.6%)
121,964 (92.9%)
Houses occupied by owners
201,149 (56.2%)
67,642 (55.5%)
Houses occupied by renters
157,001 (43.8%)
54,322 (44.5%)
Median rent asked for vacant for-rent units
$876.58
$1,437
Median monthly housing costs
$980
$1,207
Median price asked for vacant for-sale houses and condos
$283,027
$431,254
Estimated median house or condo value
$188,700
$267,700
Median numbers of rooms
5.5
5.1
Median number of rooms in apartments
4.3
3.7
Median number of rooms in houses and condos
6.5
6.5
Median house price - detached houses
$231,490
$311,442
Median house price - in 2-unit structures
$257,253
$296,942
Median house price - in 3-to-4-unit structures
$240,688
$253,376
Median house price - in 5 or more unit structures
$247,275
$282,309
Median house price - Townhouses or other attached units
$222,424
$352,916
Median house price - All housing units
$229,666
$309,562
Median house age
48
67
Renting percentage
44.2%
48.7%
Housing density (houses/condos per square mile)
1,106.1
2,487.8
House value disparities
36.1%
29.1%
Household income disparities
44.4%
44.1%
Median household income for houses/condes with a mortgage
$86,008
$95,328
Median household income for apartments without a mortgage
$61,922
$76,318
Housing units without a mortgage
4,552 (3.2%)
934 (1.9%)
Housing units with both a second mortgage and home equity loan
9,787 (6.8%)
3,112 (6.5%)
Housing units with a mortgage
138,622 (96.8%)
47,031 (98.1%)
Housing units with a home equity loan
271 (0.2%)
441 (0.9%)
Housing units with a second mortgage
12,987 (9.1%)
4,559 (9.5%)
House/condo owner moved in on average (years ago)
11
10
House/condo renter moved in on average (years ago)
1
2
Housing units lacking complete kitchen facilities
3.4%
1.2%
Housing units lacking complete plumbing facilities
1.1%
0.2%
Housing units in structures
Housing units in structures
Indianapolis
St. Paul
One, detached
59.0%
50.0%
One, attached
9.2%
3.7%
Two
2.5%
6.4%
3 or 4
6.2%
4.0%
5 to 9
7.7%
4.9%
10 to 19
6.3%
6.0%
20 to 49
3.1%
7.5%
50 or more
5.0%
17.2%
Mobile homes
1.0%
0.2%
Median real estate property taxes paid for housing units
Self-employed workers in own not incorporated business
17,131
6,217
State government workers
15,502
9,418
Unpaid family workers
1,601
0
Industries and Occupations
Key industries in Indianapolis include manufacturing, health care, and education, while in St. Paul the main industries are healthcare, financial services, and education. A significant number of St. Paul residents work in management, business, science and arts occupations, compared to service, sales and office occupations in Indianapolis.
Both cities have notable health care systems. Indianapolis is home to multiple highly-ranked hospitals, such as Indiana University Health, which is ranked #1 in the state. St. Paul is home to some of the top hospitals in the nation, including Mayo Clinic, the #1 ranking hospital in the U.S.
Health (county statistics)
Type
Indianapolis
St. Paul
General health status score of residents in this county from 1 (poor) to 5 (excellent)
Both cities offer an excellent mix of amenities, shopping, and services for residents and visitors alike. With a major airport servicing each city—Minneapolis-St. Paul International Airport for St. Paul and Indianapolis International Airport for Indianapolis—both cities are well-connected to other parts of the United States.
Infrastructure
Type
Indianapolis
St. Paul
TV stations
19
18
Arenas or stadiums
3
1
Bank branches located here
259
12
Bank institutions located here
27
8
Drinking water stations with no reported violations in the past
1
2
Drinking water stations with reported violations in the past
HMDA - Conventional home purchase loans - Applications denied
Year
Indianapolis
St. Paul
1999
3,358
808
2000
3,562
747
2001
2,649
597
2002
1,915
577
2003
2,519
841
2004
3,702
1,156
2005
6,057
1,803
2006
5,811
1,781
2007
3,456
1,123
2008
1,247
467
2009
565
216
Culture and Food
Both cities boast rich cultural offerings and diverse culinary scenes. Indianapolis is known for its motor racing heritage, vibrant arts scene, and signature dishes like pork tenderloin sandwiches. St. Paul offers a blend of old and new, with its Victorian architecture, bustling arts scene, and a variety of international cuisines from all over the world, such as Hmong and Somalian foods.
Sports Teams
When it comes to sports teams, both cities have passionate followings. Indianapolis is home to the Colts (NFL), the Pacers (NBA), and the world-renowned Indianapolis 500. St. Paul shares its major league teams with Minneapolis— the Vikings (NFL), the Twins (MLB), and the Timberwolves (NBA), but uniquely hosts the Wild (NHL).


 Indianapolis, IN and
  St. Paul, MN : 503.3 miles